ICAEW chart of the week: IMF World Economic Outlook Update

My chart for ICAEW this week illustrates how countries rank in the IMF’s latest forecasts for economic growth over 2024 and 2025.

IMF World Economic Outlook Update
ICAEW chart of the week

(Horizontal bar chart)

Legend:

Emerging markets and developing economies (green)
World (purple)
Advanced economies (blue)
UK (red)

Projected annualised real GDP growth 2024 and 2025

Bars in green except where noted.

India: +6.5%
Philippines: +6.0%
Indonesia: +5.0%
Kazakhstan: +4.4%
China: +4.3%
Malaysia: +4.3%
Saudi Arabia: +4.3%
Egypt: +3.8%
Iran: +3.4%
Thailand: +3.2%
Türkiye: +3.1%
World Output: +3.1% (purple)
Nigeria: +3.0%
Poland: +3.0%
Pakistan: +2.7%
World Growth: +2.6% (purple)
South Korea: +2.3% (blue)
Mexico: +2.1%
United States: +1.9% (blue)
Canada: +1.8% (blue)
Russia: +1.8%
Brazil: +1.8%
Spain: +1.8% (blue)
Australia: +1.7% (blue)
France: +1.3% (blue)
South Africa: +1.1%
United Kingdom: +1.1% (red)
Germany: +1.0% (blue)
Argentina: +1.0%
Netherlands: +1.0% (blue)
Italy: +0.9% (blue)
Japan: +0.8% (blue)


8 Feb 2024.
Chart by Martin Wheatcroft FCA. Design by Sunday.
Source: IMF World Economic Outlook Update, 30 Jan 2024.

(c) ICAEW 2024

Each January, the International Money Fund (IMF) traditionally releases an update to its World Economic Outlook forecasts for the global economy. This year it says that it expects the global economy to grow by an average of 2.6% over the course of 2024 and 2025 at market exchange rates, or by 3.1% when using the economists-preferred method of converting currencies at purchasing power parity (PPP).

The chart shows how the 30 countries tracked by the IMF fit between emerging market and developing economies, most of which are growing faster than the global averages, and advanced economies, which tend to grow less quickly. 

The biggest drivers of the global forecast are the US, China and the EU, with both the US and China expected by the IMF to grow less strongly on average over the next two years than in 2023. This contrasts with an improvement over 2023 (which involved a shrinking economy in Germany) by the advanced national economies in the EU over the next two years – apart from Spain, which is expected to fall back from a strong recovery in 2023. 

Growth in emerging and developing countries is expected to average 4.1% over the two years, led by India (now the world’s fifth largest national economy after the US, China, Germany and Japan), followed by the Philippines, Indonesia, Kazakhstan growing faster than China, followed by Malaysia, Saudi Arabia, Egypt, Iran, Thailand and Türkiye. 

Nigeria, Poland and Pakistan are expected to grow slightly less than world economic output, followed by Mexico. 

Russia, Brazil and South Africa are expected to grow less strongly, while Argentina is expected to grow the least, with a forecast contraction in 2024 expected to be followed by a strong recovery in 2025.

The strongest-growing of the advanced economies in the IMF analysis continues to be South Korea, followed by the US, Canada, Spain, Australia, France, the UK, Germany, the Netherlands and Italy, with Japan expected to have the lowest average growth. Overall, the advanced economies are expected to grow by an average of 1.6% over the next two years.

For the UK, forecast average growth of 1.0% over the next two years is expected to be faster than the 0.5% estimated for 2023, but at 0.6% in 2024 and 1.6% in 2025 we may not feel that much better off in the current year.

Of course, forecasts are forecasts, which means they are almost certainly wrong. However, they do provide some insight into the state of the world economy and how it appears to be recovering the pandemic.

For further information, read the IMF World Economic Outlook Update.

More data

Not shown in the chart are the estimate for 2023 and the breakdown in 2024 and 2025, so for those who are interested, the forecast percentage growth numbers are as follows:

Emerging market and developing countries:

CountryAverage over
2024 and 2025
2023
Estimate
2024
Forecast
2025
Forecast
India6.5%6.7%6.5%6.5%
Philippines6.0%5.3%6.0%6.1%
Indonesia5.0%5.0%5.0%5.0%
Kazakhstan4.4%4.8%3.1%5.7%
China4.3%5.2%4.6%4.1%
Malaysia4.3%4.0%4.3%4.4%
Saudi Arabia4.1%-1.1%2.7%5.5%
Egypt3.8%3.8%3.0%4.7%
Iran3.4%5.4%3.7%3.2%
Thailand3.2%2.5%4.4%2.0%
Türkiye3.1%4.0%3.1%3.2%
Nigeria3.0%2.8%3.0%3.1%
Poland3.0%0.6%2.8%3.2%
Pakistan2.7%-0.2%2.0%3.5%
Mexico2.1%3.4%2.7%1.5%
Russia1.8%3.0%2.6%1.1%
Brazil1.8%3.0%2.6%1.1%
South Africa1.1%0.6%1.0%1.3%
Argentina1.0%-1.1%-2.8%5.0%

Advanced economies (including the UK): 

CountryAverage over
2024 and 2025
2023
Estimate
2024
Forecast
2025
Forecast
South Korea2.3%1.4%2.3%2.3%
USA1.9%2.5%2.1%1.7%
Canada1.8%1.1%1.4%2.3%
Spain1.8%1.1%1.4%2.3%
Australia1.7%1.8%1.4%2.1%
France1.3%0.8%1.0%1.7%
UK1.1%0.5%0.6%1.6%
Germany1.0%-0.3%0.5%1.6%
Netherlands1.0%0.2%0.7%1.3%
Italy0.9%0.7%0.7%1.1%
Japan0.8%1.9%0.9%0.8%

This chart was originally published by ICAEW.

ICAEW chart of the week: UK population projections

The Office for National Statistics has updated its national population projections, lifting its expectations for 2025 by one million to just under 70 million people living in the UK and for 2050 by four million to 78 million.

UK population projections
ICAEW chart of the week

Step chart with five columns each 25 years apart together with four intermediate steps showing the change over each quarter-century.

Legend:

Population (blue)
Births minus deaths (purple)
Net inward migration (orange)

1975: 56m population
+2m births minus deaths
+1m net inward migration
2000: 59m population 
+3m births minus deaths
+8m net inward migration
2025: 70m population
-0m births minus deaths
+8m net inward migration
2050: 78m population
-3m births minus deaths
+8m net inward migration
2075: 83m population


1 Feb 2024.
Chart by Martin Wheatcroft FCA. Design by Sunday.

Source: ONS, '2021-based UK population projections, 30 Jan 2024'; ONS, 'UK population mid-year estimate'.

(c) ICAEW 2024

My chart for ICAEW this week takes the latest principal population projections for the UK published by the Office for National Statistics (ONS) on 30 January 2024 and illustrates how the number of people in the UK has increased since 1975 and is projected to increase to 2075.

According to the ONS, there were 56m people living in the UK in June 1975 and our chart shows how this increased by 2m from births exceeding deaths (18m births – 16m deaths) and by 1m from net inward migration to reach 59m in June 2000, an average annual population growth rate of 0.2%.

The first quarter of the current century is expected to see the population increase to just under 70m by the middle of 2025, from a combination of 3m births less deaths (18m births – 15m deaths) and net inward migration of 8m, an average of just over 300,000 per year. This is equivalent to an average annual population growth rate of 0.7%.

From there, the population is projected to increase by approximately 8m to 78m in 2050, an average annual growth rate of 0.4%. This is driven by an assumption that immigration will continue to exceed emigration in the long-term by 315,000 a year, contributing 8m to the increase, while projected deaths are expected to marginally exceed births (18m deaths – 18m births) over the same period. The latter is also affected by the assumed level of immigration, with the ONS estimating that if net migration was zero then the population would fall by 3m over the 25 years to 2050 (18m deaths – 15m births).

The chart concludes with the projection for the following quarter-century from 2050 to 2075, with deaths exceeding births by 3m (21m deaths – 18m births) to partially offset an 8m projected increase from net inward migration to reach 83m in 2075, an average annual population growth of 0.3%.

These numbers are higher than the previous projection published by the ONS in January 2023 by 1m in 2025, 4m in 2050 and 8m in 2075, partly as a consequence of updating the baseline numbers to reflect the 2021 Census, but mainly because of higher assumptions for net inward migration. The ONS doubled the expected number of net inward migrants over the three years to June 2025 from approximately 300,000 per year to around 600,000 per year, and increased its long-term assumption from 245,000 net inward migrants per year to 315,000.

The challenge for policymakers is in balancing the needs of the economy and the public finances for more workers in order to pay for the pensions and health care costs of a rapidly growing number of pensioners, and fee-paying international students to subsidise the domestic university system, with political pressures to control immigration. Perhaps unsurprisingly this had led to a degree of unpredictability in immigration policy.

The challenge for the ONS is trying to reflect in its projections a highly unpredictable immigration policy, which in this case has resulted in it increasing its assumptions for net inward migration just as the government introduces a series of new restrictions that should significantly reduce the incoming flow of migrants. 

The irony is that the ONS might have been better off just leaving its previous projections in place – but then that’s life in the forecasting game.

This chart was originally published by ICAEW.

ICAEW chart of the week: EU Budget 2024

My chart for ICAEW this week illustrates how Ireland has displaced Luxembourg in contributing the most to the EU Budget on a per capita basis.

EU Budget 2024
ICAEW chart of the week

Vertical bar chart showing contributions per person per month to the EU budget for 2024 by country (blue bars) and the EU average (purple bar).

Ireland: €53.20
Luxembourg: €50.70
Belgium: €44.10
Netherlands: €39.00
Denmark: €37.80
Finland: €31.30
Germany: €29.70
Slovenia: €28.90
France: €28.60
Austria: €28.50
Sweden: €25.20
EU average: €25.20
Italy: €24.40
Malta: €23.20
Spain: €21.80
Estonia: €21.70
Cyprus: €20.70
Czechia: €20.30
Lithuania: €20.00
Portugal: €17.80
Latvia: €16.90
Hungary: €16.20
Poland: €15.70
Greece: €15.40
Slovakia: €15.00
Croatia: €13.10
Romania: €12.00
Bulgaria: €10.50

25 Jan 2024.
Chart by Martin Wheatcroft FCA. Design by Sunday.
Sources: European Union, 'EU Budget 2024'; Eurostat, 'Population projections'; ICAEW calculations.

(c) ICAEW 2024

The European Union’s Budget for the 2024 calendar year amounts to €143bn, with national governments contributing €137bn and EU institutions generating the balance of €6bn. At a current exchange rate of £1:€1.17 this is equivalent to a budget of £122bn comprising national contributions of £117bn and other income of £5bn.

My chart illustrates how much national governments contribute to the EU budget on a per capita basis, ranging from Ireland contributing the most to Bulgaria the least. Ireland’s recent economic success has seen it overtake Luxembourg as the country with the highest GDP per capita, and hence the highest per capita contributor to the EU Budget. 

The average contribution for the EU’s population works out at just over €302 (£258) per person per year or €25.20 (£21.50) per person per month, based on a total population of 453m living in the 27 EU member countries.

The chart shows how Ireland’s contributions are equivalent to €53.20 per person per month, followed by Luxembourg on €50.70, Belgium on €44.10, Netherlands on €39.00, Denmark on €37.80, Finland on €31.30, Germany on €29.70, Slovenia on €28.90, France on €28.60, Austria on €28.50, Sweden on €25.20, Italy on €24.40, Malta on €23.20, Spain on €21.80, Estonia on €21.70, Cyprus on €20.70, Czechia on €20.30, Lithuania on €20.00, Portugal on €17.80, Latvia on €16.90, Hungary on €16.20, Poland on €15.70, Greece on €15.40, Slovakia on €15.00, Croatia on €13.10, Romania on €12.00, and Bulgaria on €10.50.

Total contributions of €137bn amount to approximately 0.8% of the EU’s gross national income of €17.7trn. They comprise €25bn from 75% of customs duties and sugar sector levies, a €24bn share of VAT receipts, €7bn based on plastic packaging that is not recycled (providing countries with an economic incentive to reduce it), and €82bn calculated as a proportion of gross national income. 

While the UK ‘rebate’ no longer exists, these numbers in the chart are net of the equivalent but proportionately smaller ‘rebate’ totalling €9bn that continues to go to Germany, Netherlands, Sweden, Austria and Denmark. The EU Commission had proposed removing it during the negotiations for the 2021 to 2027 multi-year financial framework but was unsuccessful in persuading these five countries to give it up.

The chart only shows the gross contributions paid by national governments – it doesn’t show the amount that comes back to each country through EU spending, whether in the form of economic development funding and agricultural subsidies, through science, technology, educational or other programmes, or through the economic benefits of hosting EU institutions. This will reduce the effective net contribution for most of the richer nations, while poorer member states will benefit by more coming from the EU than they are paying in.

The numbers also do not include €113bn (£97bn) of spending through the NextGenerationEU programme that is funded by direct borrowing by the EU. This is equivalent to additional spending of €20.80 per person per month that will need to be repaid over the next few decades – hopefully through the benefits of higher economic growth.

This chart was originally published by ICAEW.

ICAEW chart of the week: Inflation

My chart for ICAEW this week illustrates how core inflation has only dropped from 6.3% in December 2022 to 5.1% in December 2023, even as the headline rate has come down from 10.5% to 4.0%.

Two step charts under the title 'Inflation'.

Step chart 1: 2022
(12 months to Dec 2022)

Core inflation +6.3% (corresponding to 5.0% in height)
+ Food prices +16.8% (height 1.8%)
+ Alcohol & tobacco +3.7% (height 0.2%)
+ Energy prices +52.8% (height 3.5%)

= CPI all items +10.5% (height 10.5%)

Step chart 2: 2023
(12 months to Dec 2023)

Core inflation +5.51% (height 4.0%)
+ Food prices +8.0% (height 0.9%)
+ Alcohol & tobacco +12.9% (height 0.5%)
+ Energy prices -17.3% (height -1.4%)

= CPI all items +4.0% (height 4.0%)


18 Jan 2024.
Chart by Martin Wheatcroft FCA. Design by Sunday.
Source: ONS, 'Consumer price inflation, UK: Dec 2023'.

(c) ICAEW 2024

On 17 January 2023, the Office for National Statistics (ONS) published its latest consumer price inflation (CPI) statistics for the 12 months to December 2023, reporting that headline inflation has fallen to an annual rate of 4.0% compared with 10.5% a year earlier – a more than halving of the annual rate of price growth.

This contrasts with CPI excluding energy, food, alcohol and tobacco (typically described as core inflation), which was 6.3% and 5.1% in the 12 months to December 2022 and 2023 respectively.

The left-hand side of my chart this week illustrates how core inflation in the 12 months to December 2022 of 6.3% contributed just under 5.0% to the weighted average total inflation rate of 10.5%, with food prices up 16.8%, alcohol and tobacco up 3.7%, and energy prices up 52.8% contributing a further 1.8%, 0.2% and 3.5% respectively.

The right-hand side shows the 12 months to December 2023, where core inflation of 5.1%, food price inflation of 8.0%, alcohol and tobacco inflation of 12.9%, and a fall in energy prices of 17.3% contributed approximately 4.0%, 0.9%, 0.5% and -1.4% respectively to the weighted average total rate of consumer price inflation of 4.0%

The relative weightings may explain why many people feel that inflation is still running faster than the headline rate. Food prices, up 8.0% in the past 12 months, have increased twice as fast as CPI of 4.0%, while alcohol (up 9.6%) and tobacco (up 16.0%) have gone up by even more. These may have been offset by energy prices coming down by 17.3% over the past 12 months, but this may not be perceived as that beneficial given how energy is still significantly more expensive than it was before the cost-of-living crisis started.

For policymakers, the bigger concern will be the stickiness in core inflation, which remains stubbornly higher than the Bank of England’s target for overall CPI of 2.0%. While the expectation is that both core and headline rates will come down further during the course of 2024, the Bank is likely to remain cautious about declaring victory in the fight against inflation despite worries about the effects of high interest rates on the struggling economy.

This chart was originally published by ICAEW.

ICAEW chart of the week: UK flights

My chart for ICAEW this week illustrates how the number of flights to and from UK airports has not fully recovered since the pandemic.

Column chart titled 'UK flights'
ICAEW chart of the week

2019: 2,137,000 flights
2020: 835,000
2021: 823,000
2022: 1,714,000
2023: 1,931,000


11 Jan 2024.
Chart by Martin Wheatcroft FCA. Design by Sunday.

Sources: ONS, 'Daily UK Flight Data, 11 Jan 2024'; EUROCONTROL.

Our chart this week looks at how the number of flights departing and arriving from UK airports (including internal flights) has changed over the past five years. 

According to numbers published by the Office for National Statistics (ONS) – based on data from EUROCONTROL – there were approximately 2,137,000 flights in 2019, 835,000 in 2020, 823,000 in 2021, 1,714,000 in 2022 and 1,931,000 in 2023.

This was equivalent to daily averages of 5,870, 2,282, 2,254, 4,695 and 5,290 in 2019, 2020, 2021, 2022 and 2023 respectively.

Despite reports that consumer demand for air travel has recovered to (or potentially even exceeded) pre-pandemic levels, the number of flights in 2023 was only 90% of that seen in 2019. This is believed to reflect changing travel patterns among business travellers, where video conferencing, corporate carbon reduction targets and cost-saving initiatives are all thought to have contributed to a significant reduction in business trips compared with pre-pandemic times.

For the airline industry, the loss of businesses paying higher prices for flexible bookings has been a key challenge that has caused airlines to focus on improving passenger load factors (ie, seat utilisation), promoting premium tickets to leisure travellers and, in some cases, rebalancing towards the budget carrier market.

With the number of flights in the second half of 2023 around 9% more than in 2022, the industry will be hoping for further growth in demand during 2024.

This chart was originally published by ICAEW.

ICAEW chart of the week: Sterling exchange rates 2023

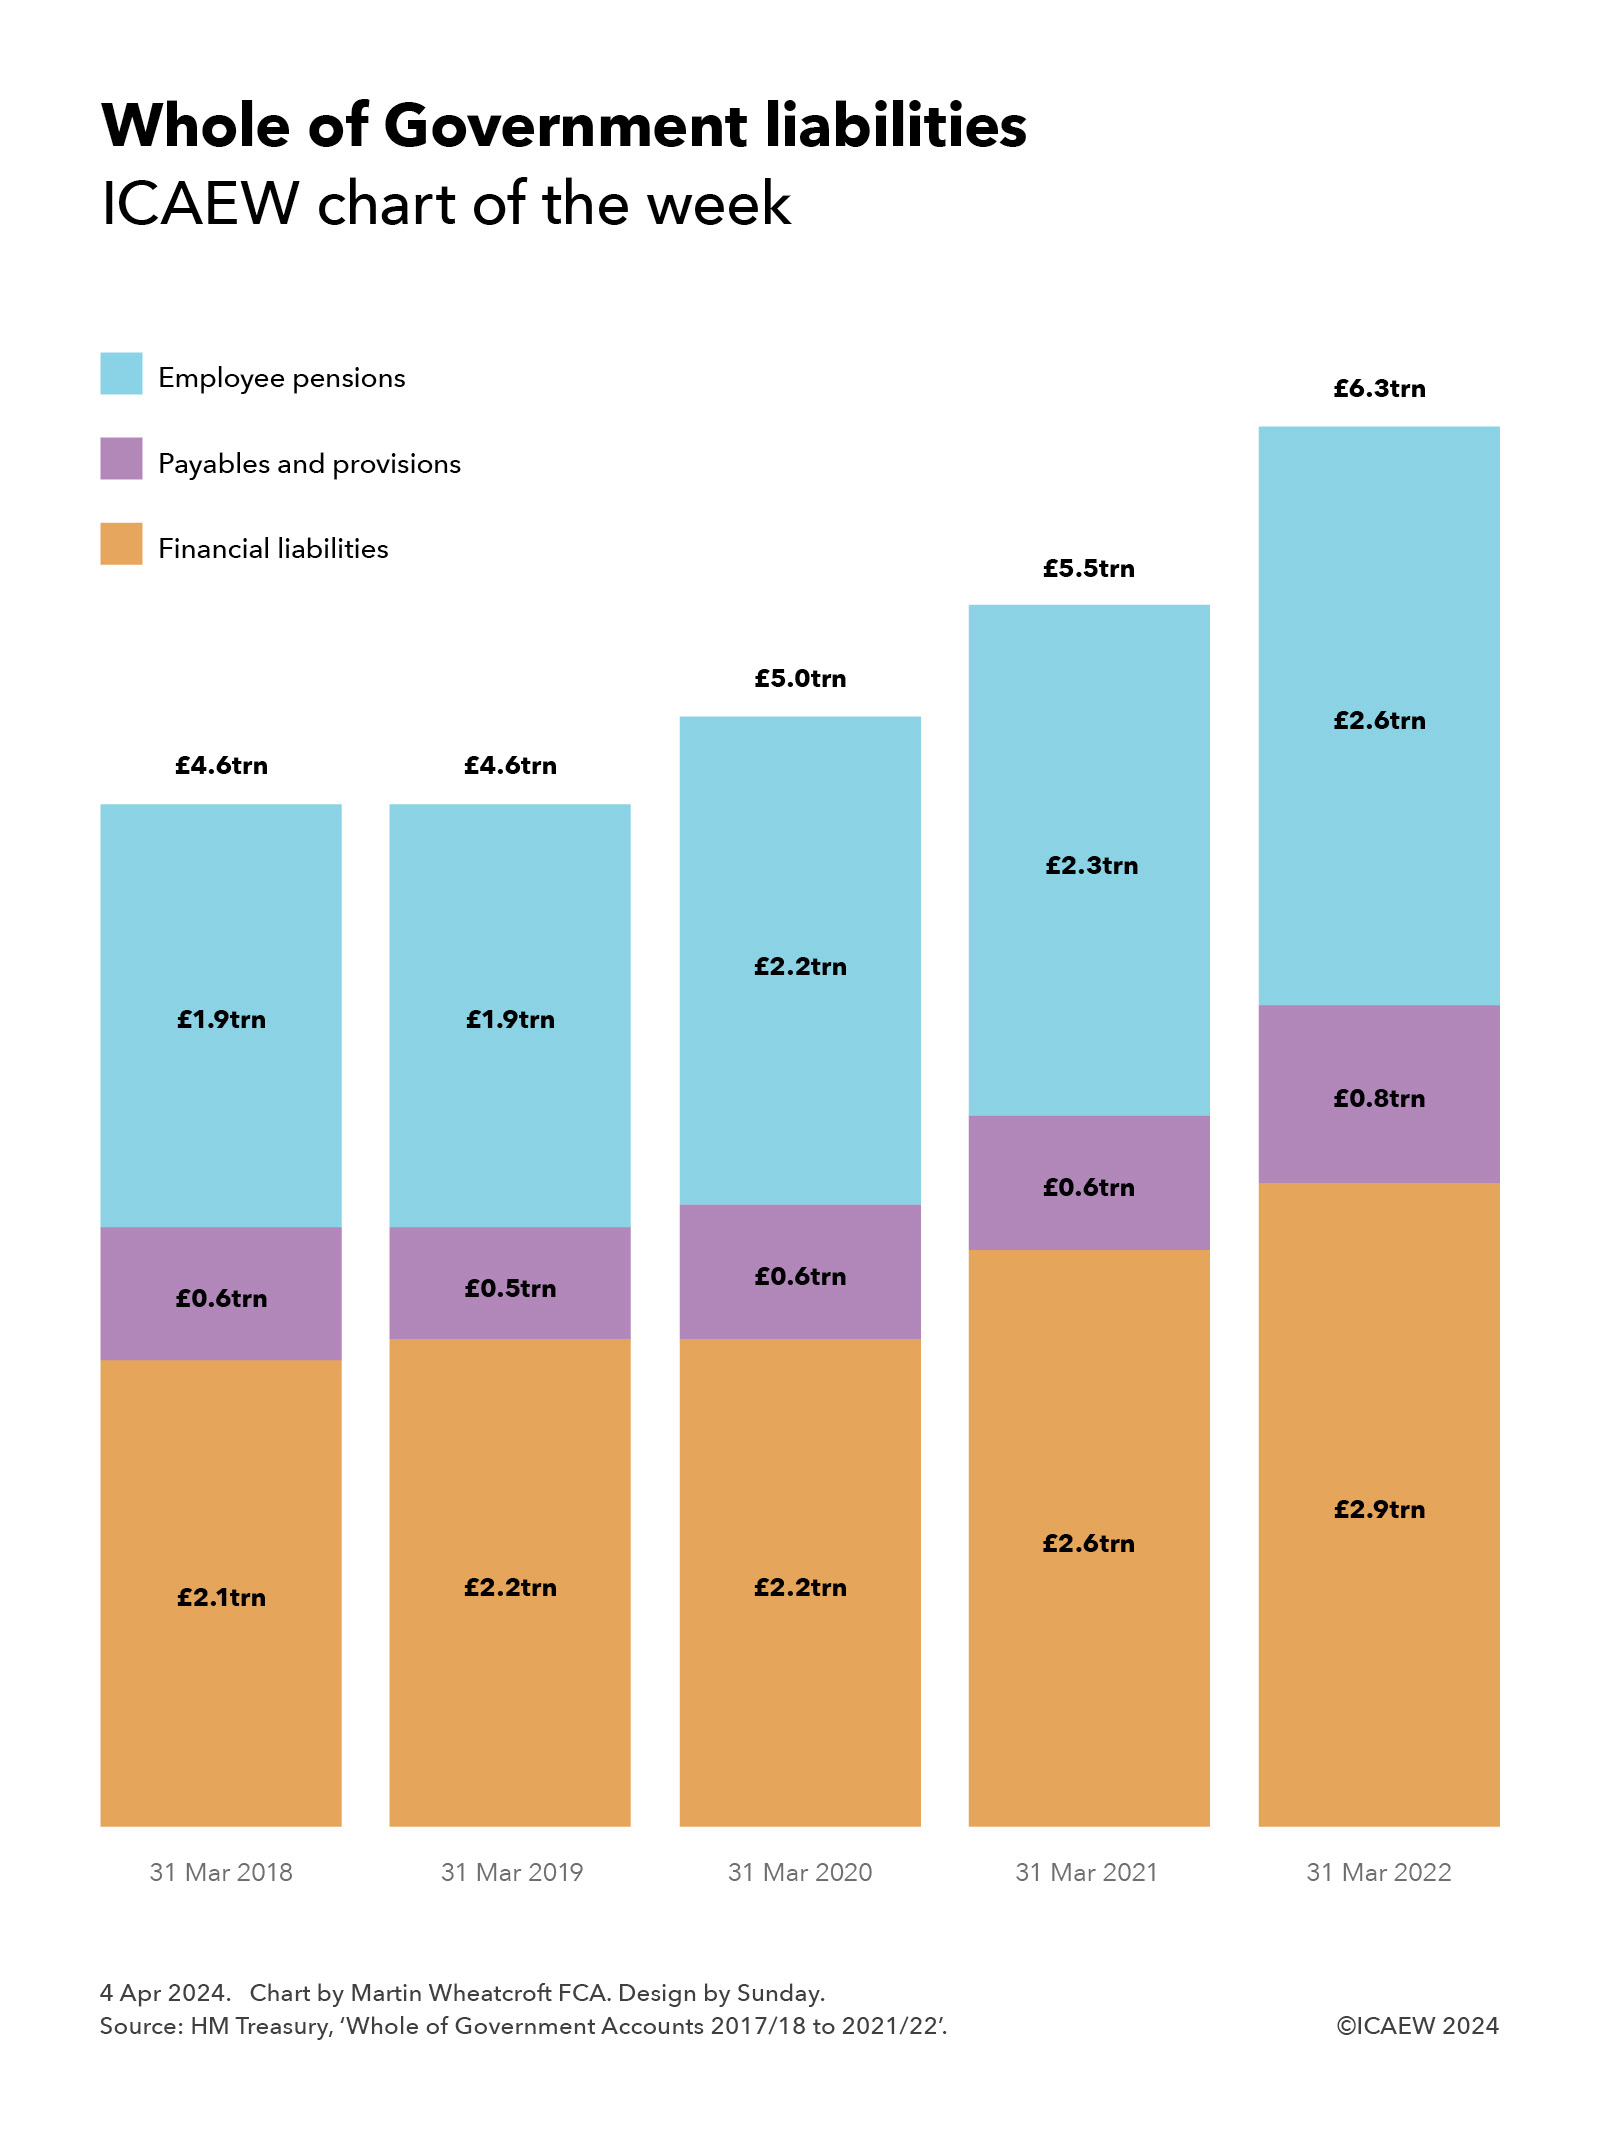
My chart for ICAEW this week looks at how the pound appreciated in value against the euro, US dollar, yuan and yen respectively during 2023.

4 x step charts titled 'Sterling exchange rates 2023'


Euro

30 Dec 2022: €1.128 = £1.00
Change: +2%
29 Dec 2023: €1.154 = £1.00


US dollar

30 Dec 2022: $1.204 = £1.00
Change: +6%
29 Dec 2023: $1.275 = £1.00


Chinese yuan

30 Dec 2022: ¥8.31 = £1.00
Change: +9%
29 Dec 2023: ¥9.08 = £1.00


Japanese yen

30 Dec 2022: ¥159 = £1.00
Change: +13%
29 Dec 2023: ¥180 = £1.00


4 Jan 2024.
Chart by Martin Wheatcroft FCA. Design by Sunday.

Source: Bank of England, 'Daily spot exchange rates against sterling'.

My first chart of the week of 2024 for ICAEW looks back at 2023 and how sterling strengthened against the euro, US dollar, yuan and yen – the currencies of the four largest economies in the world – based on exchange rates reported by the Bank of England.

The smallest increase was against the principal currency of the European Union, our largest trading partner, with the sterling to euro exchange rate up by just over 2% from £1:00:€1.128 to £1.00:€1.154 between 30 December 2022 and 29 December 2023. 

This contrasted with a 6% rise in sterling against the US dollar during 2023 from £1.00:$1.204 at the end of 2022 to £1.00:$1.275 at the end of 2023, a 9% rise against the Chinese yuan renminbi from £1.00:¥8.31 to £1.00: ¥9.08. Sterling increased, and a 13% increase against the Japanese yen from £1.00:¥159 to £1.00:¥180.

Exchange rate movements can be attributed to multiple factors, including relative rates of inflation and economic growth, interest rates, trade and investment flows, and fiscal credibility among others – both actuals and sentiment about prospects for the future. In sterling’s case, expectations that interest rates in the UK are likely to stay higher for longer than in other major economies is a key contributor to the rise in sterling over 2023, although this is only part of the story.

While sterling has appreciated over the last year against these and many other currencies, the pound is still much lower in value than 10 years ago, being down 4% against the euro compared with £1.00:€1.200 at the end of 2013, down 23% against the US dollar from £1.00:$1.653, and down 9% against the Chinese yuan from £1.00:¥10.01. The exception is the Japanese yen, where the rise this year has more than offset falls over the previous decade to leave sterling 4% higher against the yen than the exchange rate £1.00:¥173 on 31 December 2013.

Time to book that holiday to China or Japan?

ICAEW chart of the week: Civil service numbers

My chart for ICAEW this week illustrates how the civil service has grown by 92,000 or 23% to 496,000 FTEs over the past five years.

Step chart titled 'Civil service numbers'

(First column) September 2018: 179,000 ministerial departments, 22,000 in Scottish and Welsh governments, and 203,000 in agencies and non-ministerial departments = 404,000 total number of civil servants.

(Middle column) Change: +38,000 minisministerial departments, +10,000 Scottish and Welsh governments, +44,000 agencies and non-ministerial departments = +92,000 total change.

September 2023: 217,000 ministerial departments, 32,000 Scottish and Welsh governments, 247,000 agencies and non-ministerial departments = 496,000 total number of civil servants.

The number of civil servants has increased by 92,000 or 23% from 404,000 full-time equivalents (FTEs) in September 2018 to 496,000 FTEs in September 2023, which may be surprising in the light of government rhetoric about cutting public spending.

As my chart for ICAEW this week illustrates, the size of the UK civil service has grown significantly over the past five years. FTEs in ministerial departments have grown by 38,000 or 21% from 179,000 to 217,000, in the Scottish and Welsh governments by 10,000 or 45% from 22,000 to 32,000, and in agencies and non-ministerial departments by 44,000 or 22% from 203,000 to 247,000.

The civil service is just one part of the public sector workforce, which has increased by 571,000 or 13% from 4,433,000 to 5,004,000 FTEs over the same period. 300,000 of the increase has been in the NHS (up 21% from 1,451,000 to 1,751,000 FTEs in September 2023), which after taking account of the 92,000 increase in the civil service means the rest of the public sector workforce (schools, police, army, local government and others) has grown by a relatively slower number of 179,000 or 7% from 2,578,000 to 2,757,000 over the same period.

The increases in the civil service reverse cuts in the austerity years that saw the civil service fall from 493,000 FTEs in September 2009 to 384,000 in June 2016, just before the Brexit referendum.

The UK’s departure from the EU Single Market and the EU Customs Union on 31 December 2020 has been a major driver in the increase, most prominently in the Home Office, which has grown by 15,000 from 29,000 to 44,000 FTEs. Machinery of government changes make it difficult to track the other impacts, but it is likely that another 20,000 of the increase is likely driven by Brexit, made up of small changes across Whitehall departments and individual agencies, such as the 80% increase in the size of the Rural Payments Agency (from 1,400 to 2,600), 

The individual agency with the largest increase is HM Prisons and Probation Service, up 15,000 from 49,000 to 64,000 as the outsourced probation was re-absorbed back into the civil service.

The pandemic also had a small impact on the civil service (as opposed to the NHS) with the Department of Health and Social Security more than doubling in size from just under 1,500 FTEs in September 2018 to almost 3,200 in September 2023.

Some increases are more difficult to attribute, such as the 30% increase in the size of the National Crime Agency from 4,200 to 5,500 or the 9% increase in the size of HM Revenue and Customs from 57,100 to 62,000. Brexit is likely to be part of the story following the reversion of responsibilities from Brussels to London, but the growth of cybercrime (for example) in the past few years will also have been a factor.

The civil service numbers reported by the Office for National Statistics exclude civil servants working for the Northern Ireland Executive and its agencies, but do include both the Scottish and Welsh governments. Most of the growth in numbers from 22,000 to 32,000 has been in Scotland as more powers have been devolved to its devolved administration, with the 16,800 FTEs in September 2018 growing by 9,700 or 58% to 26,500 in September 2023. The size of the civil service in Wales has gone up by a much more modest 700 or 13% from 5,200 to 5,900 in the same period.

One possible driver for some of the other increases is that cuts in the civil service made during the austerity years were never sustainable in the longer-term, with the demands that drove those numbers never having gone away. Another is that governments tend to want to “get things done” and there is therefore a need to find people to do them. 

Both of these factors may explain why both government departments and agencies have grown in size over the past half a decade.

While the civil service is less than 10% of the public sector workforce, it is often the first place that the government looks when it wants to find cost savings – and the current government is no different in seeking to cut the size of the civil service again. Whether those costs savings are sustainable in the long-term without more fundamental reform is another matter.

This chart was originally published by ICAEW.

ICAEW chart of the week: Incorporations and dissolutions

My chart for ICAEW this week illustrates how company dissolutions continue to outpace incorporations as the economy remains in first gear.

Column chart titled 'Incorporations and dissolutions' with two-column comparisons over five years.

2019: 670,575 incorporations and 671, 501 dissolutions

2020: 758,012 and 536,564

2021: 762,278 and 807,049

2022: 778,219 and 876,521

2023: 801,831 and 825,980


7 Dec 2023.
Chart by Martin Wheatcroft FCA. Design by Sunday.

Source: ONS, 'Companies House incorporations and dissolutions, 7 Dec 2023'.

A key indicator for the health of the economy is the comparison between how many companies are created each year and the number that are dissolved, and our chart this week illustrates how these compare over the last four years up until 1 December 2023.

In 2019 there were 670,575 company incorporations and 671,501 dissolutions (391,066 compulsorily and 280,435 voluntarily), a net contraction in the number of companies of 926, consistent with the rather tepid economy we were experiencing in the year before the pandemic.

The numbers for 2020 were distorted by the pandemic, with incorporations rising to 758,012 and dissolutions falling to 536,564 (275,933 compulsorily and 260,631 voluntarily) – a net increase of 221,448. The rise in incorporations was no doubt contributed to by people deciding to start new businesses during lockdown, although bulk incorporations may also have been a factor. The significant fall in companies dissolved in 2020 compared with the previous year reflects government support on offer during the pandemic that propped up many companies that would otherwise have failed during 2020.

Incorporations rose further to 762,278 in 2021 and 778,219 in 2022, but these gains were more than offset by a sharp rise in dissolutions, which jumped to 807,049 (508,448 compulsorily and 289,604 voluntarily) in 2021 and 876,521 (572,646 compulsorily and 304,875 voluntarily) in 2022 as government support was withdrawn and reality caught up with many companies. Extremely high energy costs and high inflation were key factors in the demise of many businesses over this period. The net decrease in the number of companies was 44,771 in 2021 and 98,202 in 2022.

The number of companies incorporated during the first 11 months of 2023 was 801,831, a 9% rise on the equivalent period last year, while 825,980 companies were dissolved (539,643 compulsorily and 286,337 voluntarily), a rise of less than 1%. This has narrowed the gap to a contraction of 24,149 companies in the first 11 months of 2023.

While these numbers may be accurate to the nearest digit (unlike most sample-based statistics), their meaning for the economy is much less precise. Many companies are incorporated but never go on to trade, while some incorporations are merely a corporate wrapper around an existing business, or with personal service companies they can be a conversion of economic activity from one legal form to another. Unfortunately, companies are also sometimes incorporated for fraudulent purposes. Similarly, companies are wound up for a range of reasons and not just because they are all the consequence of failing businesses.

Despite that, they do provide a helpful indicator on what is going on with the economy, as the ‘cycle of business life’ is played out. For example, in theory it should be positive that even after a post-pandemic ‘shakeout’ the total number of companies over the period from 2019 to 1 December 2023 has grown by 53,300.

This may also be a statistic worth watching in 2024 as Companies House uses its new powers to weed out companies in the register. Just how significant will the introduction of new verification procedures and more active enforcement activity be to numbers of companies being incorporated and dissolved each year?

This chart was originally published by ICAEW.

ICAEW chart of the week: Exploding debt

My chart for ICAEW this week takes a look at how UK public debt has exploded since the financial crisis to more than quintuple from £0.6trn in March 2008 to a projected £3.1trn in March 2029.

Exploding debt

Step chart showing how UK public sector net has changed between March 2008 and the projected position in March 2029.

[debt bars shaded orange, changes shaded in purple]

March 2008: £0.6trn
Financial crisis: +£0.7trn
March 2012: £1.3trn
Austerity years: +£0.5trn
March 2020: £1.8trn
Pandemic / energy crisis: +£0.9trn
March 2024: £2.7trn

[bar colours shaded by 50% to indicate the following are projected numbers]

Latest plan: +£0.4trn
March 2029:  £3.1trn

30 Nov 2023.
Chart by Martin Wheatcroft FCA. Design by Sunday.
Source: OBR, 'Public finances databank - Nov 2023'.

As illustrated by our chart this week, the sums borrowed by the government since the financial crisis of a decade and half ago have been truly astonishing. 

In March 2008, the official measure of net debt for the UK public sector was less than £0.6trn. During the financial crisis, government borrowing totalled £0.7trn over a four-year period, causing public sector net debt to more than double to £1.3bn in March 2012. 

The eight austerity years saw government cut spending on public services to a significant degree but still borrow a further £0.5trn to see net debt reach £1.8trn in March 2020 – arguably not mending the roof while the sun was shining. This was then followed by an exceptional amount of borrowing during four years of pandemic and energy crisis (including the current financial year) that is expected to see net debt increase by a total of £0.9trn to reach £2.7trn in March 2024.

The Autumn Statement 2023 on Wednesday 22 November saw the Chancellor set out his latest plan for the UK public finances over the next five financial years. This includes a further £0.4trn of borrowing, with public sector net debt projected to amount to £3.1trn in March 2029 – more than quintuple the net amount owed by the UK state 21 years earlier in March 2008.

This assumes that the government can stick to its borrowing plans – many commentators have suggested that planned cuts in spending on public services are unrealistic, meaning more borrowing if taxes are not to rise.

The £2.5trn increase in debt between 2008 and 2029 comprises £2.2trn in borrowing to fund 21 years of deficits (the annual shortfall between receipts and spending) and £0.3trn in other borrowing to fund government lending (such as student loans) and working capital requirements.

As a share of the economy, the increase is less dramatic but still significant – rising from a net debt to GDP ratio of 35.6% in March 2008, to 74.3% in March 2012, to 85.2% in March 2020, to an anticipated 97.9% in March 2024. However, the good news is that net debt / GDP is expected to fall to 94.1% in March 2029 as inflation and economic growth offset the additional borrowing.

The worry for this (or any alternative) government is that while borrowing levels in the OBR’s forecast spreadsheet for the next five years appear manageable and are (just) within the current fiscal rules, the numbers assume that we don’t enter another recession or other economic crisis in that time. Otherwise, we could see debt exploding again.

This chart was originally published by ICAEW.

ICAEW chart of the week: Autumn Statement 2023

My chart for ICAEW this week illustrates how Chancellor Jeremy Hunt used almost all of the available upside from inflation and fiscal drag to fund his tax measures and a series of business growth initiatives.

Autumn Statement 2023

Step chart (waterfall diagram) showing the average change to 2023/24 to 2027/28 forecasts since the Spring Budget 2023.

Forecast revisions (steps in orange):

Inflation +$41bn
Fiscal drag +£7bn
Other changes +£4bn
Debt interest -£21bn
Welfare uprating -£13bn

= Forecast revisions +£18bn (subtotal in purple)

Policy measures (steps in blue):

Tax measures -£11bn
Spending and other -£6bn

= Net changes +£1bn (total in purple)


23 Nov 2023.
Chart by Martin Wheatcroft FCA. Design by Sunday.
Sources: HM Treasury, 'Autumn Statement 2023'; OBR, 'Economic and fiscal outlook, Nov 2023'.

The Autumn Statement 2023 on Wednesday 22 November featured a surprise tax cut to national insurance and a perhaps less surprising decision to make full expensing of business capital expenditure permanent.

As my chart illustrates, the forecasts for the deficit over the next five years benefited by £41bn a year on average in higher receipts from inflation, £7bn a year on average in additional ‘fiscal drag’ as higher inflation erodes the value of frozen tax allowances more quickly, and a net £4bn in other upward forecast revisions. These improvements to the forecasts were offset by an average of £21bn a year in higher debt interest and £13bn from the expected inflation-driven uprating of the state pension and welfare benefits, to arrive at a net improvement of £18bn a year on average over the five financial years from 2023/24 to 2027/28 before policy decisions.

In theory, these upward forecast revisions should be absorbed by more spending on public services as higher inflation feeds through into salaries and procurement costs. However, the Chancellor has chosen to (in effect) sharply cut public spending and use almost all of the upward revisions to fund tax measures and business growth initiatives instead. These amounted to £11bn a year on average in tax changes and £6bn a year on average in spending increases and other changes to reduce the net impact to just £1bn a year on average over the five-year period.

The resulting net change of £1bn on average in forecasts for the deficit is to reduce the forecast deficit by £8bn for the current year (from £132bn to £124bn) and by £1bn for 2024/25 (to £85bn), with no net change in 2025/26 (at £77bn), an increase of £5bn in 2027/28 (to £68bn), and no net change for 2027/28 (at £49bn).

The main tax changes announced were the cuts in national insurance for employees by 2 percentage points from 12% to 10% and by 1 percentage point for the self-employed from 9% to 8%, reducing tax receipts by an average of £9bn over five years. This is combined with the effect of making full expensing permanent of £4bn – this change mainly affects the later years of the forecast (£11bn in 2027/28), although ironically the average is a better proxy for the long-term cost of this change, which the OBR estimates is around £3bn a year. 

Other tax changes offset this to a small extent. 

Spending and other changes of £6bn a year on average comprise incremental spending of £7bn a year plus £2bn higher debt interest to fund that spending, less £3bn in positive economic effects from that spending and from the tax measures above.

Although the cumulative fiscal deficit over five years has been revised down by £4bn, the OBR has revised its forecast for public sector net debt as of 31 March 2028 up by £94bn from to £3,004bn. This principally reflects changes in the planned profile of quantitative tightening and higher lending to students and businesses.

The big gamble the Chancellor appears to be making by choosing to opt for tax cuts now is that the OBR and Bank of England’s pessimistic forecasts for the economy are not realised – enabling him to find extra money in future fiscal events to cover the effect of inflation on public service spending. Otherwise, while it may be possible to cut public spending by as much as the Autumn Statement suggests, it is difficult to see how he can do so without a further deterioration in the quality of public services given he is not providing any additional investment in technology, people and process transformation to deliver sustainable efficiency gains.

This chart was originally published by ICAEW.