ICAEW chart of the week: UK public debt profile

Our chart this week shines a spotlight on the UK’s public debt, focusing on the Government’s debt strategy ahead of the fast approaching Spending Review.

A big worry for the Chancellor of the Exchequer in putting together the Budget and Spending Review this month is the possibility that higher inflation and interest rate rises will hit the public finances, restricting the amounts he has available to meet his policy objectives. Our chart this week illustrates just how exposed the UK’s public debt is to changes in inflation and interest rates.

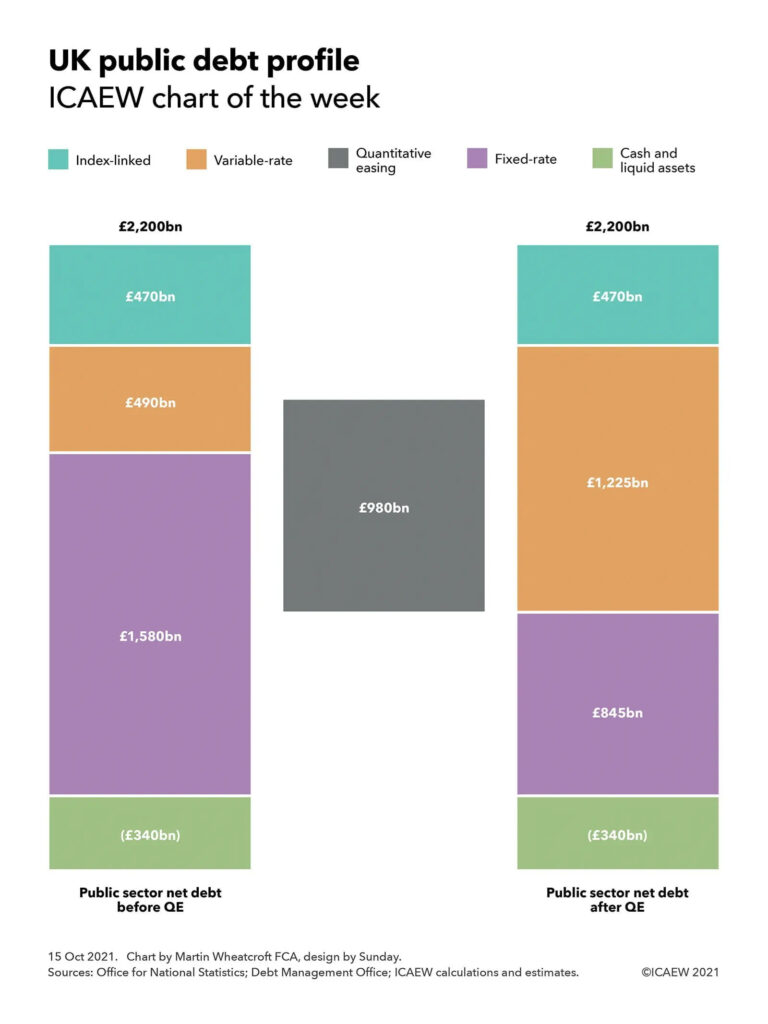
UK public debt profile - column chart

UK public sector net debt before QE: Index-linked £470bn + Variable-rate £490bn + Fixed-rate £1,580bn - Cash and liquid assets £340bn = £2,200bn

Quantitative easing: £980bn (£735bn overlaps with fixed-rate and £245bn overlaps with variable-rate.

UK public sector net debt after QE: Index-linked £470bn + Variable-rate £1,225bn + Fixed-rate £845bn - Cash and liquid assets £340bn = £2,200bn

Sources: Office for National Statistics, Debt Management Office, ICAEW calculations and estimates.

UK public sector net debt was marginally over £2.2tn at the end of August 2021, comprising in the order of £2,540bn in gross debt less £340bn in cash and liquid assets. As ICAEW’s chart of the week illustrates using approximate numbers, this can be broadly divided into fixed-rate, variable-rate and index-linked debt, reflecting the Government’s debt strategy as executed by the UK Debt Management Office and by National Savings & Investments.

What the chart highlights is how quantitative easing (QE) has changed the profile of UK public debt significantly. This tool has been used by the operationally independent Bank of England to ease monetary policy by pumping money into the economy in response to the financial crisis a decade ago and the coronavirus pandemic more recently, but has the effect of switching fixed-rate government securities into variable-rate central bank deposits, contributing to falling interest costs even as public sector net debt has risen from less than £0.5tn in 2007 before the financial crisis to £1.8tn in March 2020 before the pandemic and £2.2tn currently.

Fixed-rate debt of £1,580bn comprises approximately £1,490bn in government bonds or gilts repayable over periods generally ranging from five to 30 years, together with £75bn in other central and local government loans net of intra-government holdings (which we have assumed are mostly fixed-rate in nature) and up to £15bn in fixed-rate savings certificates sold to individual investors by National Savings & Investment.

Variable-rate debt of £490bn comprises around £185bn of variable-rate National Savings & Investments deposits and certificates, £60bn in short-term Treasury bills, and £245bn in Bank of England liabilities relating to QE (see below). The balance of £470bn is in the form of index-linked gilts, where the amounts owed increase in line with the retail prices index (RPI).

This is before deducting £340bn in cash and liquid assets, comprising around £150bn of official reserves (much of which is currency deposits with foreign central banks) and £115bn, £40bn and £35bn in bank, building society and other liquid financial asset holdings held by central government, local government and other parts of the public sector respectively.

In practice, the sterling work of the UK Debt Management Office (DMO) to create a balanced portfolio of public debt has been upended by the Bank of England’s Monetary Policy Committee, albeit with the agreement of successive Chancellors. The spread of inflation-, variable- and fixed-rate exposure combined with extended maturities to manage refinancing requirements over longer periods has been offset by £980bn of QE purchases and lending that has replaced £735bn (or around half) of the fixed-rate gilts in issue at nominal value with central bank deposits that pay interest at the Bank of England base rate – reducing the net fixed rate exposure to £845bn. This is in addition to the QE-related liabilities of £245bn already included in variable-rate debt, of which £110bn was used to finance Term Funding Scheme low-cost business loans, £20bn to fund corporate bond purchases, and £115bn to finance premiums on gilt purchases (in effect prepaying some of the interest that would have gone to external investors over time if the gilts had not been purchased by the Bank of England).

The consequence is a public debt portfolio that is currently being financed much more cheaply than anyone ever expected, but which is much more sensitive to changes in inflation and interest rates than was ever planned.

With inflation now expected to rise to in the order of 5% (or even higher) over the next few months, and suggestions that the Bank of England may start to increase the base rate in early 2022, the gains the public finances have experienced from ultra-low borrowing costs look as if they will start to go into reverse. This is likely to put additional pressure onto the public finances at a time of elevated economic uncertainty, making for even tougher choices for the Chancellor on both tax and spending in the Spending Review and Autumn Budget in a couple of weeks’ time.

This chart was originally published by ICAEW.

ICAEW chart of the week: Canada Budget 2021

Canada Budget 2021

2020-21 Forecast outturn
C$635 (£363bn)

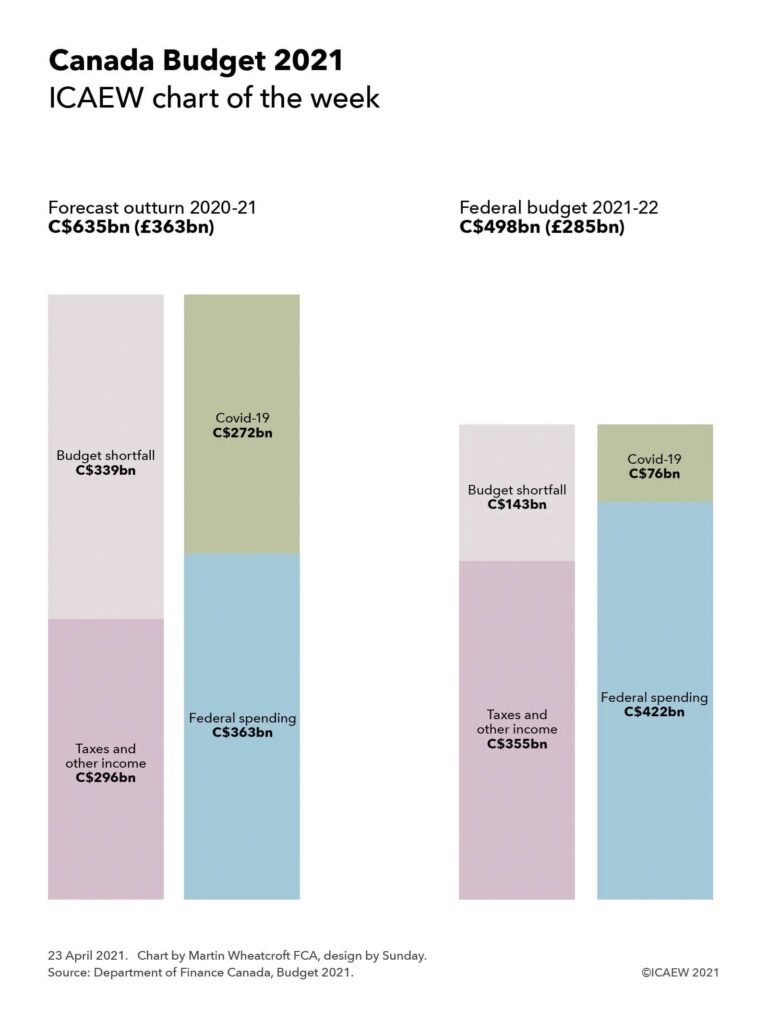
Budget shortfall C$339bn + Taxes and other income C$296bn
Covid-19 C$252bn + Federal spending C$363bn

2021-22 Federal budget
C$498bn (£285bn)

Budget shortfall C$143bn + Taxes and other income C$355bn
Covid-19 C$76bn + Federal spending C$422bn

Monday 19 April 2021 saw Chrystia Freeland, the Canadian deputy prime minister and minister of finance, release her country’s 725-page Budget 2021, setting out the Government of Canada’s plan to “finish the fight against COVID-19 and ensure a robust economic recovery that brings all Canadians along”.

As the #icaewchartoftheweek illustrates, the forecast outturn for the fiscal year ended 31 March 2021 involved spending by the federal government of C$635bn (equivalent to £363bn at an exchange rate of C$1,75:£1), resulting in a budget shortfall of C$339bn after taking taxes and other income of C$296bn into account. Spending comprised C$363bn on ‘normal’ federal government activities – operational spending, welfare payments and transfers to provinces and territories and C$272bn on exceptional measures in response to covid-19.

COVID-19 spending is much lower in 2021-22 at C$76bn, even as other spending increases to C$422bn as the federal government seeks to generate economic growth following the pandemic – total spending of C$498bn (£285bn). Assuming taxes and other income recovers to C$355bn as expected, the budget shortfall should reduce to C$143bn – still much higher than the C$29bn seen before the pandemic in 2019-20.

The federal finances were in a fairly strong position coming into the pandemic compared with many other countries, with debt at 31 March 2020 of C$813bn (31% of GDP) rising to C$1,176bn (49% of GDP) at 31 March 2021 and a forecast C$1,334bn (51% of GDP) at 31 March 2022. This provides Canada with some room for manoeuvre as it navigates its way after the pandemic. 

Fortunately for Canadians, one side-effect of the US government’s stimulus package is that it is expected to not only drive growth in the US economy, but in its Canadian neighbour too.

More (much more) information is available in the Canada Budget 2021.

This chart was originally published by ICAEW.

ICAEW chart of the week: US federal budget baseline projections

19 February 2021: Congressional Budget Office expects a decade of trillion-dollar deficits as the US public finances are hit by the pandemic.

The US Congressional Budget Office (CBO) recently updated its ten-year fiscal projections for the federal budget, providing the subject for this week’s #icaewchartoftheweek. 

As the chart illustrates, there was a shortfall of $3.1tn between revenues and spending by the federal government in the year ended 30 September 2020, with a projected deficit of $2.3tn in the current financial year and deficits ranging from $0.9tn to $1.9tn over the coming decade.

The CBO is at pains to stress that its projections are not a forecast of what will happen but instead, provide a baseline against which decisions can be assessed. This is particularly relevant at the moment as Congress debates a potential $1.9tn stimulus plan that would increase this year’s deficit significantly if passed.

On the path shown in the projections, the CBO calculates that debt held by the public will increase from $21.0tn (100% of GDP) in 2020 up to $35.3tn (107% of GDP) by 2031. Will policymakers in the US be comfortable in continuing to run with such a high level of debt compared with pre-pandemic levels of around 80% of GDP and a pre-financial crisis level of less than 40%?

The projections are based on assumed economic growth excluding inflation of 4.6% in the current financial year following on from a fall of 3.5% last year, with the recovery continuing into 2022 with growth of 2.9%. Economic growth over the following nine years to 2031 is expected to average around 1.9%. This is much lower than the average rate of growth experienced before the financial crisis just over a decade ago but may still prove optimistic given the potential for a recession at some point over the next ten years.

The UK counterpart to the CBO – the Office for Budget Responsibility (OBR) – is currently working its abacus quite hard on updating its five-year projections ready for the Budget on 3 March. The OBR’s projections will be extremely useful in understanding the near-term path in the UK’s public finances, including the effect of any tax and spending announcements that may be featured in the Budget. Unfortunately, they will be less useful than the CBO’s projections in that they are not expected to provide a refreshed baseline for the second half of the decade when the hard work of starting to repair the public finances is expected to take place.

This chart was originally published by ICAEW.