ICAEW chart of the week: Australian Government balance sheet

My chart for ICAEW marks Australia Day by looking at the federal government balance sheet over the last decade.

My chart for ICAEW marks Australia Day by looking at the federal government balance sheet over the last decade.

Australia Day is on Monday 26 January, prompting us take a look at the Australian Government’s consolidated financial position over the last 10 years.

The chart is derived from federal government consolidated financial statements prepared in accordance with Australian Accounting Standards (as adjusted for prior period adjustments), divided by annual estimates of GDP in current prices published by the Australian Bureau of Statistics in October 2025.

The chart shows how net worth was negative throughout the period, going from 18% of GDP on 30 June 2015 to 23% on 30 June 2025.

Other key stats from the balance sheet

  • Non-financial assets going from 10% on 30 June 2015 to 11% on 30 June 2025
  • Financial assets going from 24% on 30 June 2015 to 27% on 30 June 2025
  • Interest bearing liabilities going from 28% on 30 June 2015 to 36% on 30 June 2025
  • Provisions and payables going from 24% on 30 June 2015 to 25% on 30 June 2025

Financial assets of AU$753bn on 30 June 2025 comprised of AU$570bn in financial investments, AU$174bn in receivables and accrued revenue, and AU$9bn in cash. While non-financial assets of AU$320bn comprised of AU$94bn in military equipment, AU$96bn in other plant, equipment and infrastructure, AU$79bn in land and buildings, AU$17bn in intangibles, AU$13bn in inventories, AU$13bn in heritage and cultural assets, and AU$8bn in other non-financial assets.

Interest bearing liabilities of AU$1,009bn on 30 June 2025 comprised of AU$679bn in government securities, AU$216bn in central bank and other deposit liabilities, AU$58bn in loans, AU$33bn in leases and AU$23bn in other interest-bearing liabilities. While provisions and payables of AU$696bn comprised of AU$411bn in pension liabilities, AU$103bn Australian currency in issue, AU$50bn in payables and AU$132bn in provisions.

Net worth was -AU$632bn on 30 June 2025 and GDP in the year to 30 June 2025 was AU$2,779bn. (Australian balance sheet to GDP ratios are based on GDP for the preceding 12 months, rather the UK practice of using ‘mid-year’ GDP from 6 months before to 6 months after the balance sheet date). 

Nominal GDP has increased by 70% or an average of 5.5% a year over the past decade, comprising inflation of 3.2% a year on average and average economic growth of 2.2% a year. The latter reflects average population growth of 1.5% per year and average per capita economic growth of 0.75% per year.

Not shown in the chart are revenues as a share of GDP respectively in the 10 financial years from 24% in 2015/16 to 27% in 2024/25, expenditure of 27% in 2015/16 to 29% in 2024/25, and net accounting (deficits)/surpluses as a share of GDP of (2.4%) in 2015/16 to (1.5%) to 2024/25. Net investment averaged 0.5% of GDP over the ten years.

This is of course not the full picture of the Australian public finances, as these numbers exclude approximately AU$1.7tn of positive net worth in the balance sheets of states and territory governments and local authorities across Australia.

Overall, Australia’s overall general government net debt – including states, territories and local government, but excluding illiquid financial assets, non-financial assets and non-debt liabilities – is reported to be around 32% of GDP in 2025. This compares with around 95% of GDP for the UK according to the IMF.

Apart from the pandemic years – when deficits rose and GDP fell in real terms – what is remarkable is how stable the Australian Government balance sheet has been over the last decade when compared with the size of the Australian economy. 

This has been partly down to the continued growth of Australia’s sovereign wealth funds (the Australia Future Funds) and the decision to close federal defined benefit pension schemes to new members in 2005 (non-military) and 2016 (military), slowing the growth in these liabilities. It also reflects a relatively prudent fiscal stance over the last few decades by successive governments.

For the Australian Government, this is a positive financial position to be in.
This chart was originally published by ICAEW.

ICAEW chart of the week: Whole of Government liabilities

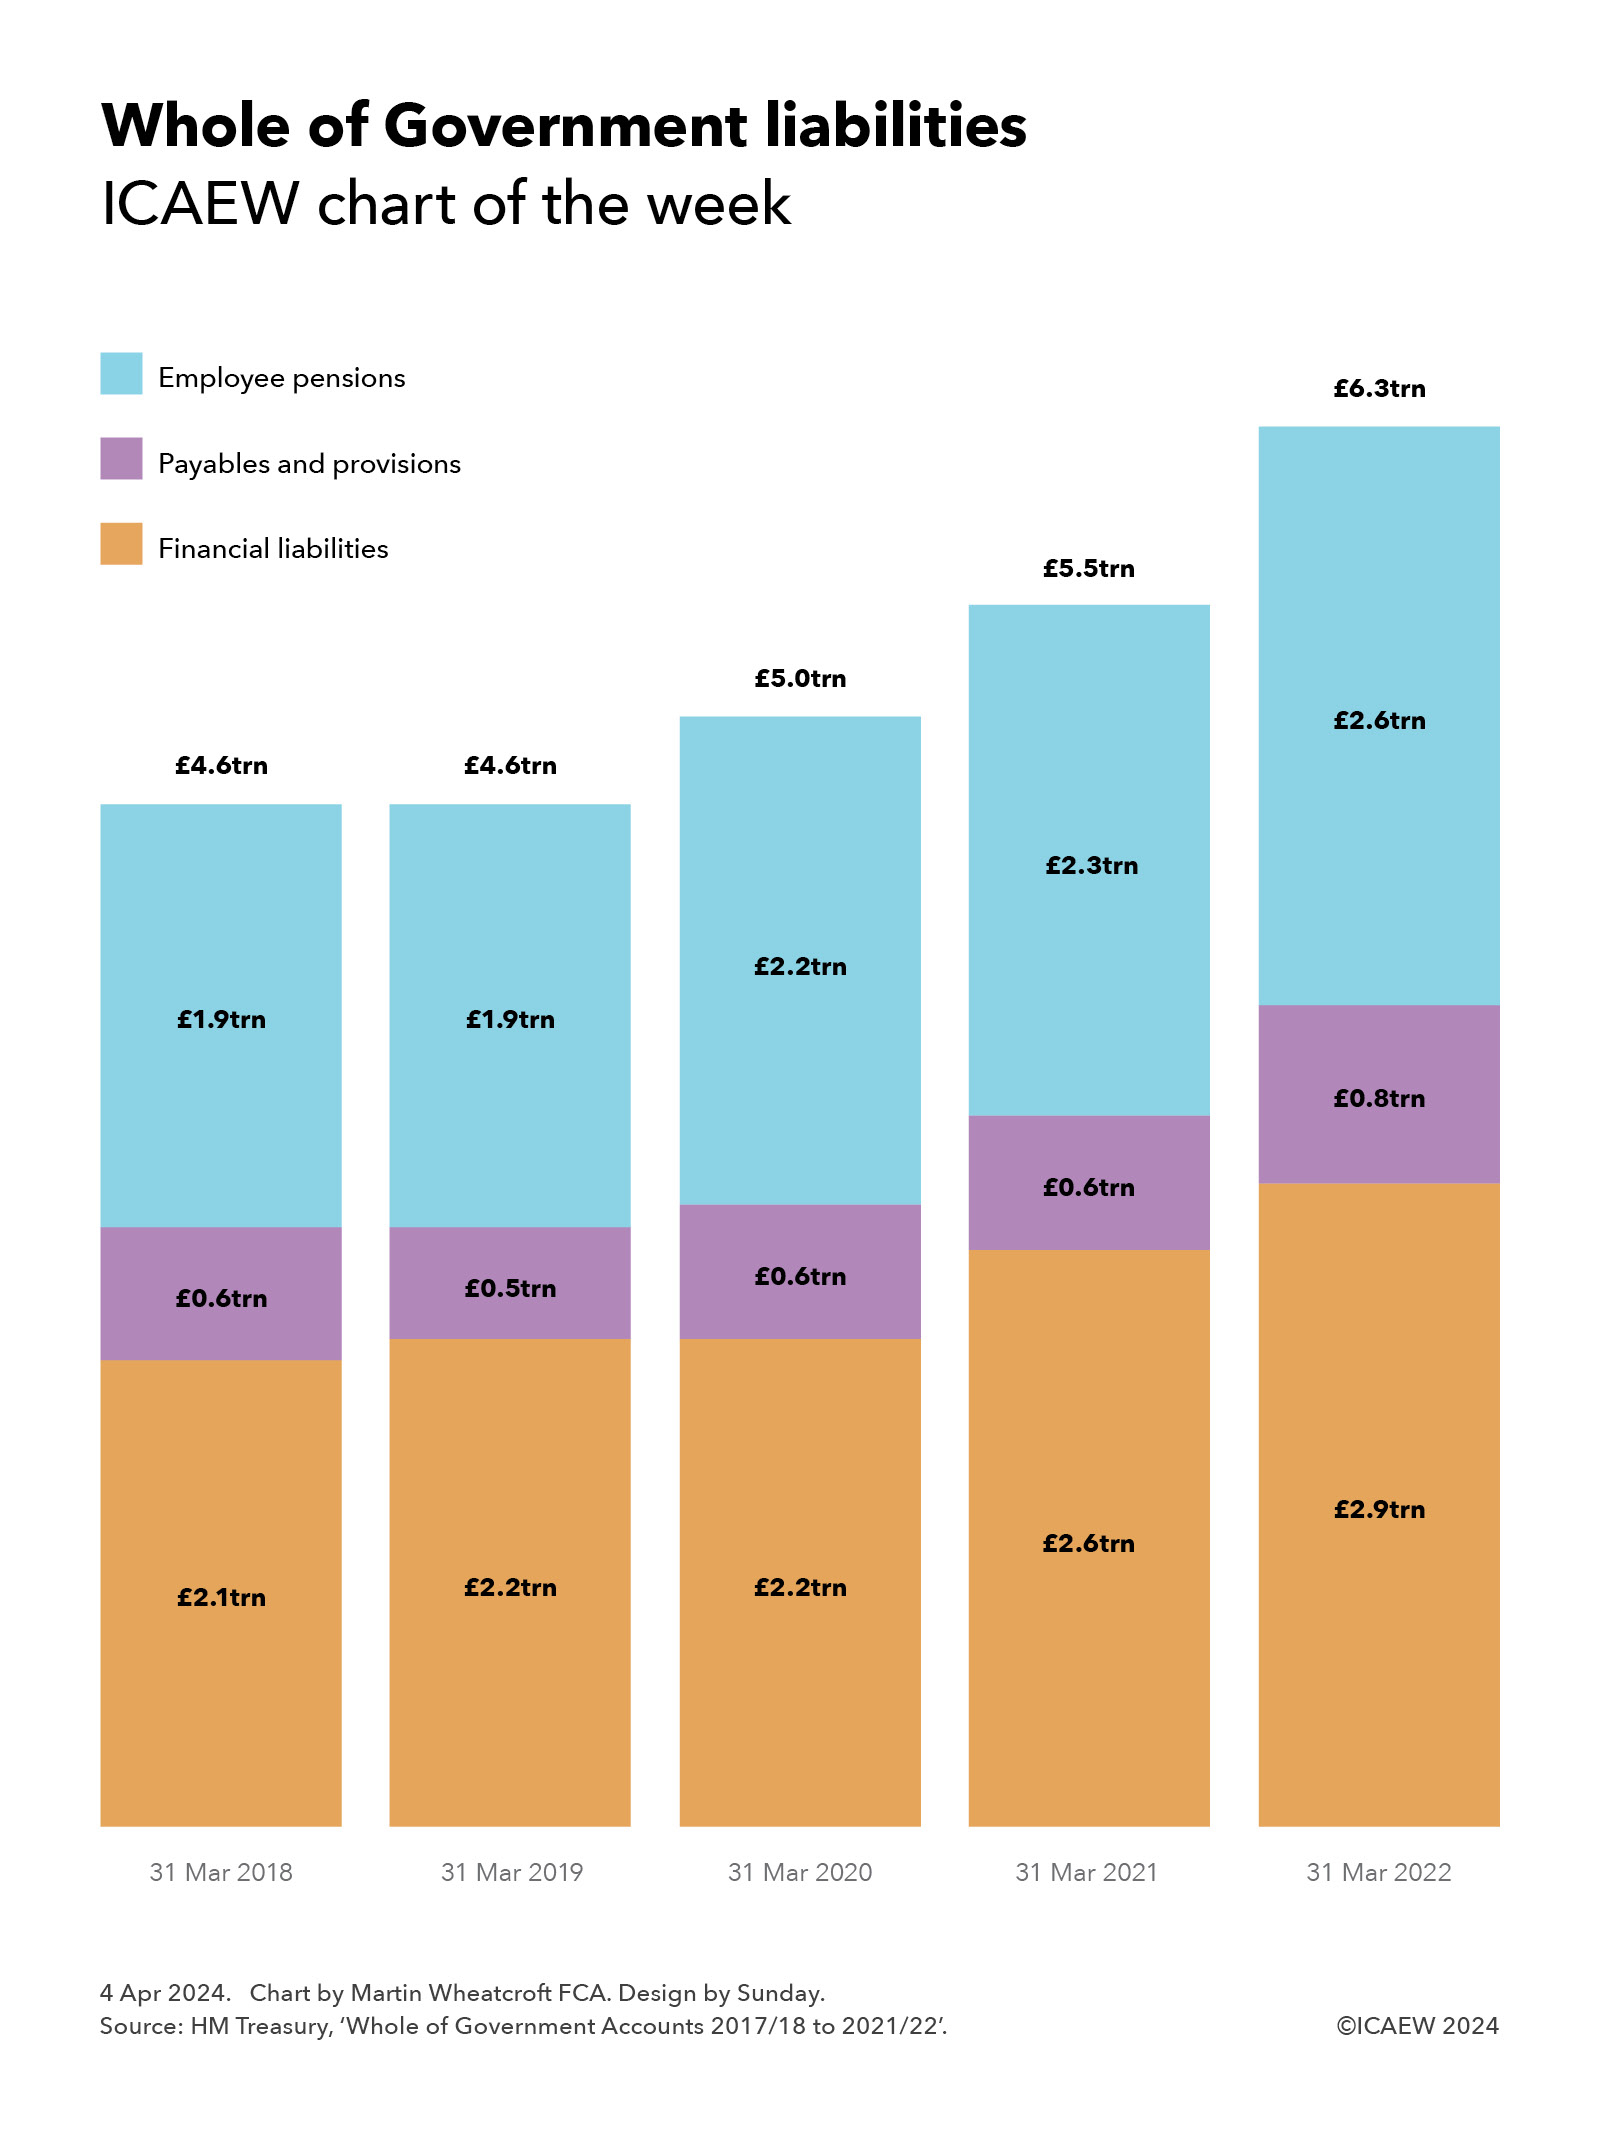
My chart for ICAEW this week looks at how liabilities in the UK’s public balance sheet have risen significantly over the five years to March 2022.

Column chart:

Whole of Government liabilities
ICAEW chart of the week

Employee pensions (blue)
Payables and provisions (purple)
Financial liabilities (orange)

31 Mar 2018: £2.1trn financial liabilities + £0.6trn payables and provisions + £1.9trn employee pensions = £4.6trn total

31 Mar 2019: £2.2trn + £0.5trn + £1.9trn = £4.6trn

31 Mar 2020: £2.2trn + £0.6trn + £2.2trn = £5.0trn

31 Mar 2021: £2.6trn + £0.6trn + £2.3trn = £5.5trn

31 Mar 2022: £2.9trn + £0.8trn + £2.6trn = £6.3trn


4 Apr 2024.
Chart by Martin Wheatcroft FCA. Design by Sunday.
Source: HM Treasury, 'Whole of Government Accounts 2017/18 to 2021/22'.

(c) ICAEW 2024.

HM Treasury published the Whole of Government Accounts (WGA) 2021/22 on 26 March 2024, just under two years after the balance sheet date. This is a significant improvement from the 27 months it took to publish the 2020/21 edition, but is still a lot longer than the nine or 10 months HM Treasury is aiming for in the medium term, or the four months or less that it generally takes listed companies to publish their consolidated financial statements.

WGA are consolidated financial statements for more than 10,000 or so organisations in the UK public sector, including central government departments, devolved administrations, regional and local authorities, the Bank of England and other public corporations, government agencies, schools, hospitals, police and fire services, transport authorities and other public bodies. They are prepared in line with international generally accepted accounting practice – International Financial Reporting Standards – different to the statistical standards used by governments to report fiscal numbers in National Accounts.

My chart for ICAEW illustrates how the liability side of the balance sheet has grown over the five-year period, from £4.6trn on 31 March 2018 and 2019 to £5trn on 31 March 2020, £5.5trn on 31 March 2021 and £6.3trn on 31 March 2022.

This reflects how debt liabilities increased from £2.1trn to £2.9trn over that time, with huge sums borrowed in 2020/21 and 2021/22 during the coronavirus pandemic. 

The other big liability in the balance sheet is the net pension obligation for public sector employees, which was £1.9trn on 31 March 2018 but had risen to £2.6trn by 31 March 2022, with falling discount rates a key factor in that rise. The latter comprises liabilities of £2.5trn for unfunded pension schemes and net liabilities of £0.1trn (£0.5trn liabilities less £0.4trn in assets) for local government and other funded pension schemes.

The balance sheet does not include the much larger commitment to pay the state pension, which as a welfare benefit is accounted for when incurred.

Total liabilities of £6.3trn on 31 March 2022 are equivalent to £93,000 per person in the UK, comprising £43,000 in financial liabilities, £11,000 in payables and provisions, and £39,000 in for public sector employee pensions.

Not shown in the chart is the asset side of the balance sheet, with assets of £2.4trn on 31 March 2022 or £36,000 per person, comprising fixed assets of £1.4trn (£20,500 per person), investments of £0.5trn (£7,000), receivables and other of £0.2trn (£3,500) and cash and other financial assets of £0.3trn (£5,000). This results in an overall net liability position of £3.9trn or £57,000 per person on 31 March 2022. 

The good news is that HM Treasury is working hard to reduce the delays in producing the WGA, which means it shouldn’t be too long before we discover what is in the 31 March 2023 balance sheet. This is expected to show an improvement, as although the government has continued to borrow, pushing up financial liabilities, the net present value of pension obligations and provisions should fall significantly as discount rates have risen sharply since March 2022.

This chart was originally published by ICAEW.

ICAEW chart of the week: Whole of Government Accounts 2020/21

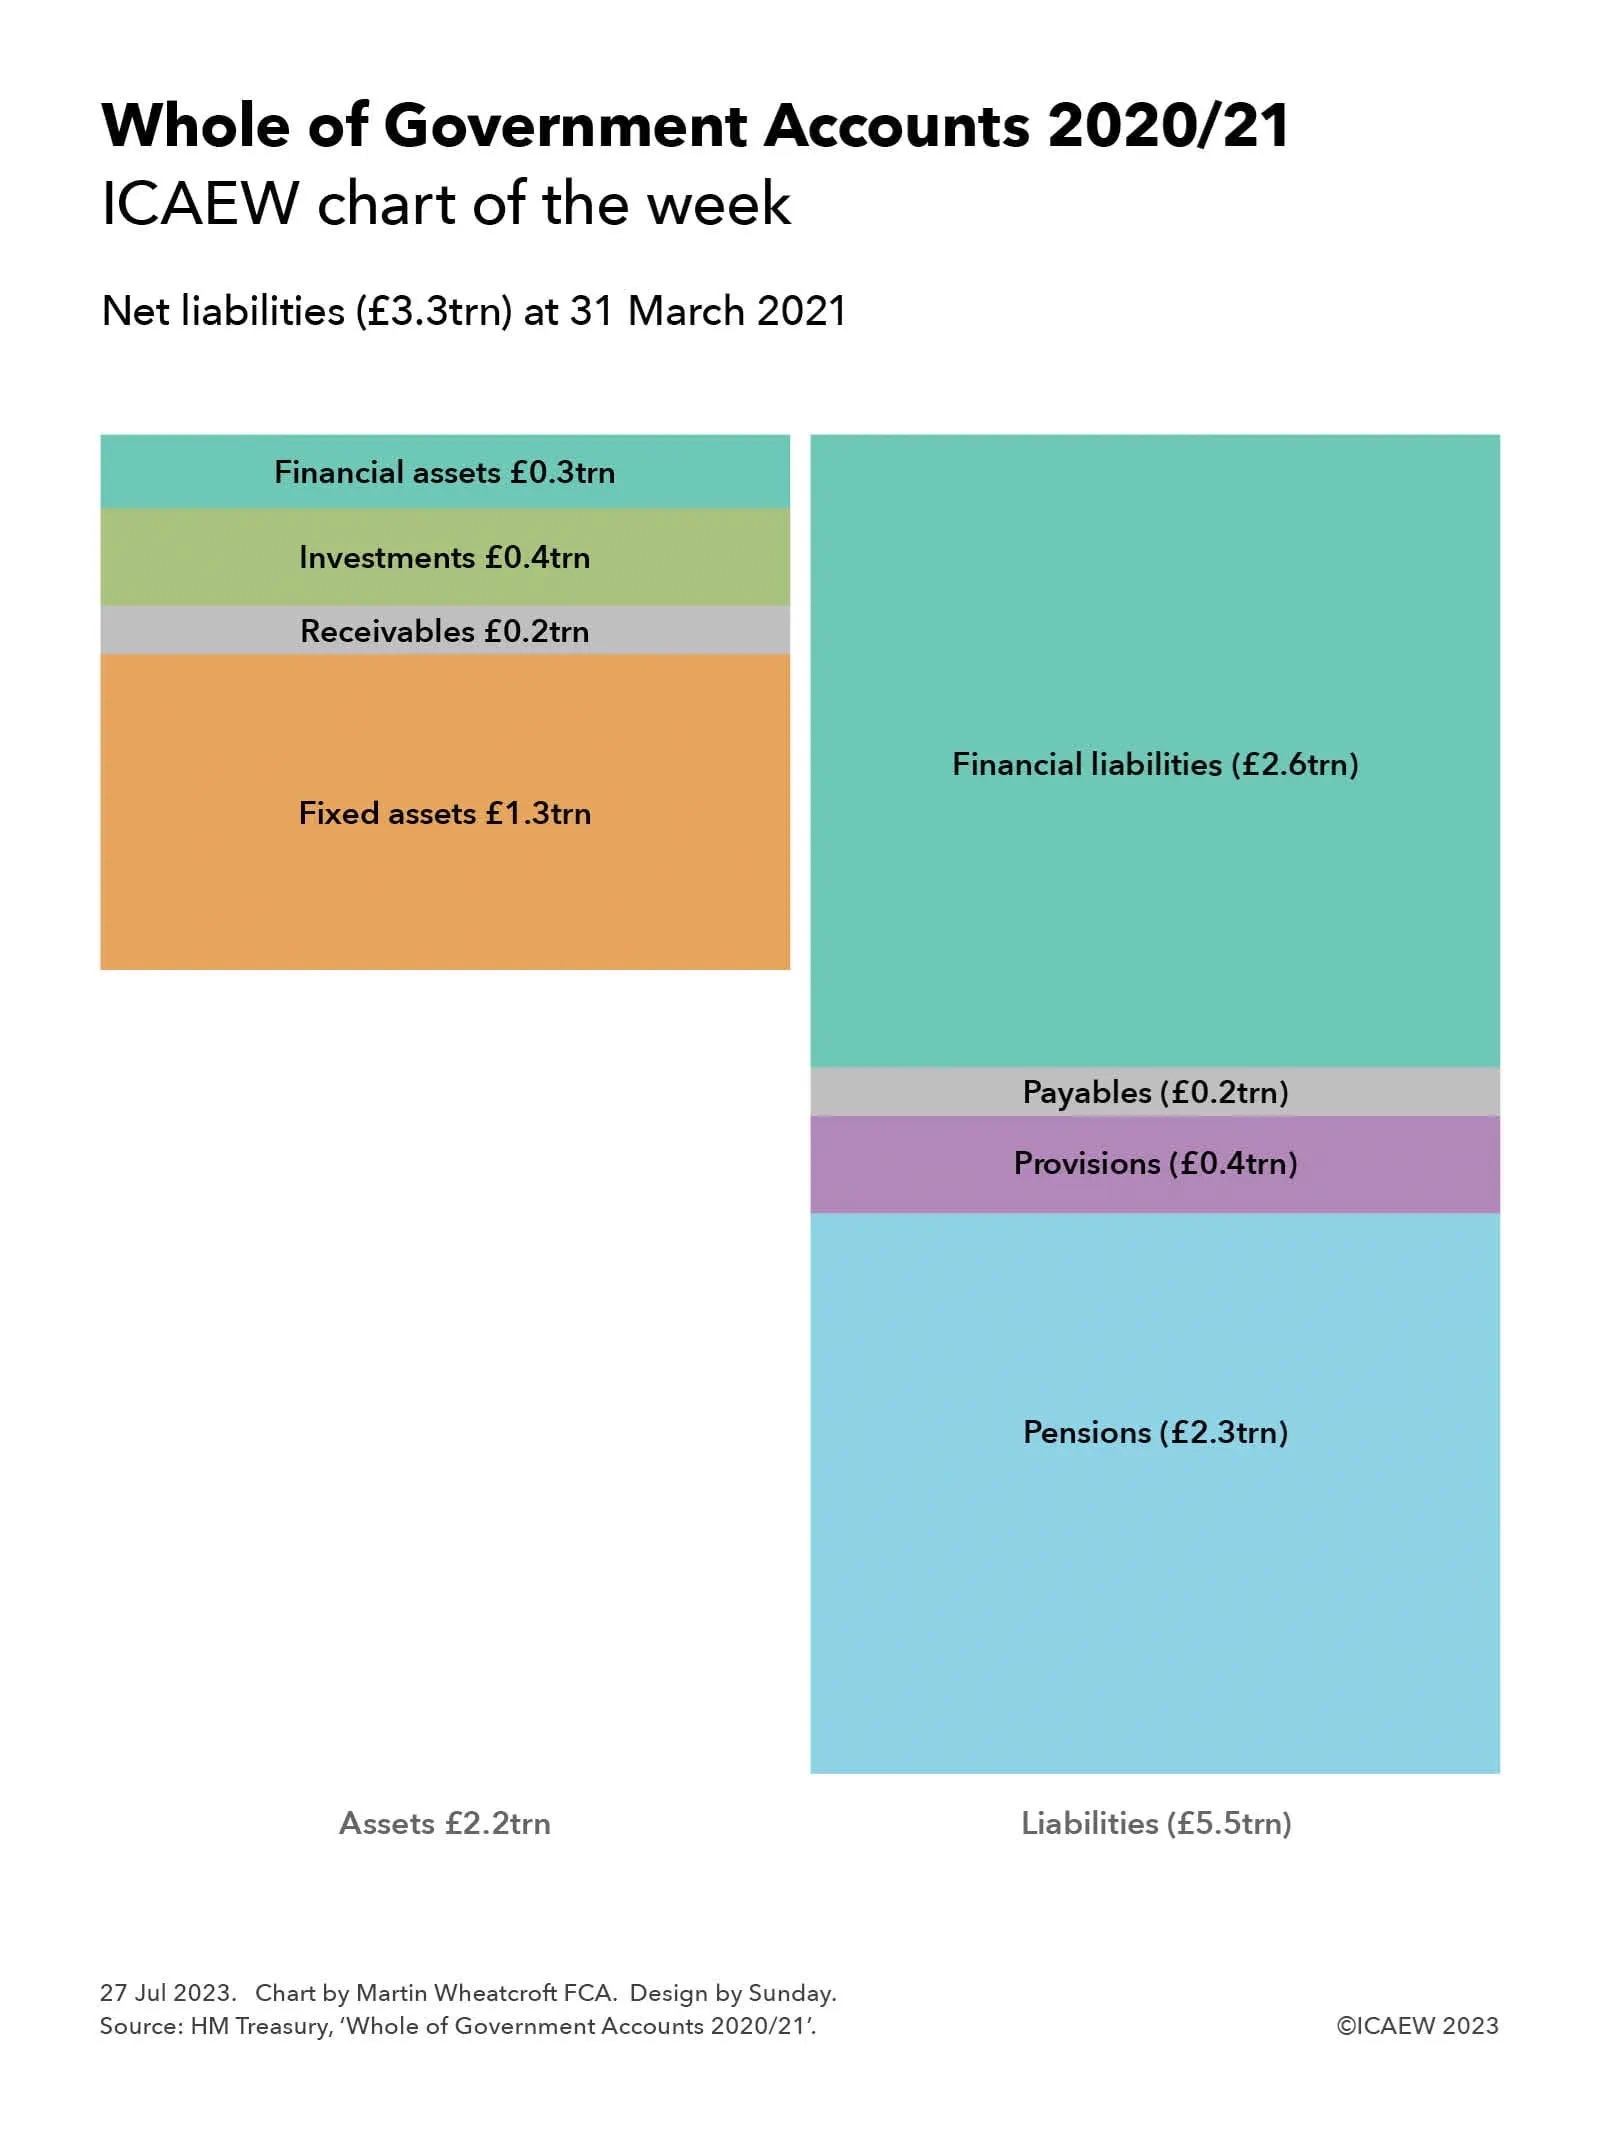
My chart this week looks at the £3.3trn of net liabilities presented in the UK government’s consolidated financial statements for the year ended 31 March 2021 that were finally published more than 27 months after the balance sheet date.

Two column chart showing assets and liabilities that make up net liabilities of £3.3trn reported in the Whole of Government Accounts 2020/21 at 31 March 2021:

Assets £2.2trn

Fixed assets £1.3trn
Receivables £0.2trn
Investments £0.4trn
Financial assets £0.3trn

Liabilities (£5.5trn)

Financial liabilities (£2.6trn)
Payables (£0.2trn)
Provisions (£0.4trn)
Pensions (£2.3trn)

The UK’s Whole of Government Accounts for the year ended 31 March 2021 were published and submitted to Parliament on 20 July 2020, more than 27 months after the balance sheet date. These are consolidated financial statements prepared in accordance with International Financial Reporting Standards (IFRS) that incorporate the financial results of more than 10,000 public bodies in the UK across central government, local government, and other parts of the public sector. 

The Whole of Government Accounts provide a much more comprehensive picture of the financial performance and position of the UK public sector than is presented in the statistics-based National Accounts, using a financial language familiar to millions of users of financial reports in the private sector. 

As our chart this week highlights, the statement of financial position (balance sheet) of the UK public sector at 31 March 2021 was in heavily negative territory with £3.3trn in net liabilities, comprising assets of £2.2trn less liabilities of £5.5trn. This compares with net liabilities of £2.8trn a year earlier.

Assets of £2.2trn comprised £1.3trn in tangible and intangible fixed assets, £0.2trn in receivables and other non-financial assets, £0.4trn in non-current investments and £0.3trn in cash and other current financial assets. Liabilities of £5.5trn comprised £2.6trn in debt and other financial liabilities, £0.2trn in payables, £0.4trn in provisions and £2.3trn in net pension obligations.

Fixed assets of £1,313bn consisted of infrastructure assets of £677bn, land and buildings of £409bn, plant and equipment of £184bn, and intangible assets of £41bn. Receivables and other non-financial assets of £218bn comprised £164bn in tax receivable and accrued, £39bn in other receivables, prepayments and accruals, and £15bn in inventories. Non-current investments of £360bn comprised £152bn in loans and deposits, £85bn in student loans, £44bn in equities, £60bn in other financial investments, £16bn in investment properties, and £3bn in assets held for sale. Cash and other current financial assets of £317bn comprised £40bn in cash and cash equivalents, £12bn in gold, £129bn in debt securities, £101bn in loans and deposits, and £35bn of other financial assets.

Debt and other financial liabilities of £2,639bn comprised £1,265bn in externally held gilts, £203bn in direct borrowing from the public through National Savings & Investments, £53bn in short-term treasury bills, £815bn in Bank of England deposits, £84bn in bank and other borrowing, £85bn in banknotes, £27bn in derivatives, £20bn in financial guarantees, and £87bn in other financial liabilities. Payables of £221bn comprised £44bn in trade and other payables, £81bn in accruals and deferred income, £55bn in tax refunds, and £41bn on PFI, finance leases and other contracts. Provisions of £366bn consisted of £159bn for nuclear decommissioning, £87bn for clinical negligence, £36bn for payments to the EU, £29bn for the Pension Protection Fund, and £55bn in other provisions for liabilities and charges. Net public sector pension obligations of £2,306bn comprised £2,168bn in unfunded pension obligations (including £792bn for the NHS, £501bn for teachers, £339bn for the civil service, £254bn for the armed forces, £209bn for police and fire services, and £73bn other) and a net £138bn (£479bn of obligations less £341bn in fund assets) for local government and other funded pension schemes. 

Not shown in the chart is the revenue and expenditure statement, which reported revenue of £732, expenditure of £1,063bn and finance and other items of £73bn to give a net accounting loss for the year of £404bn – more than twice the £192bn loss reported for the pre-pandemic year. The financial statements covered the first year of the coronavirus pandemic, which saw income fall and costs soar, resulting in net borrowing during the year of £524bn according to the cash flow statement.

The Whole of Government Accounts is probably the most important report published by the UK government each year, but you wouldn’t have known that by the lack of fanfare on its publication amid the wave of hundreds of other documents released ahead of the parliamentary recess. This may be driven by understandable embarrassment by the length of time it has taken to prepare them – more than 27 months after the balance sheet date compared with the nine months that is its long-term aim – as well as by the gaps in preparation caused by local authorities and other public bodies that are substantially behind in producing their individual financial statements, leading to an additional audit qualification for completeness this year.

Despite that, and the other audit qualifications that highlight problems with the numbers reported, every citizen ideally should read the Whole of Government Accounts 2020/21. After all, it tells the financial story of the most dramatic year in recent history.

Read more: Whole of Government Accounts 2020/21.

This chart was originally published by ICAEW.

ICAEW chart of the week: Australia federal deficit

Our chart heads down under this week to take a look at how the reported financial position of Australia’s federal government has changed over the last decade.

Australia Day on 26 January provides an opportunity to take a look at the federal balance sheet for Australia. This is included in the audited consolidated financial statements of the Commonwealth of Australia that are prepared in accordance with Australian Accounting Standards, which generally align with International Financial Reporting Standards (IFRS), although AASB 1049 Whole of Government and General Government Sector Financial Reporting diverges from IFRS in some aspects. They encompass the federal level of government in Australia, excluding states, territories and local authorities.

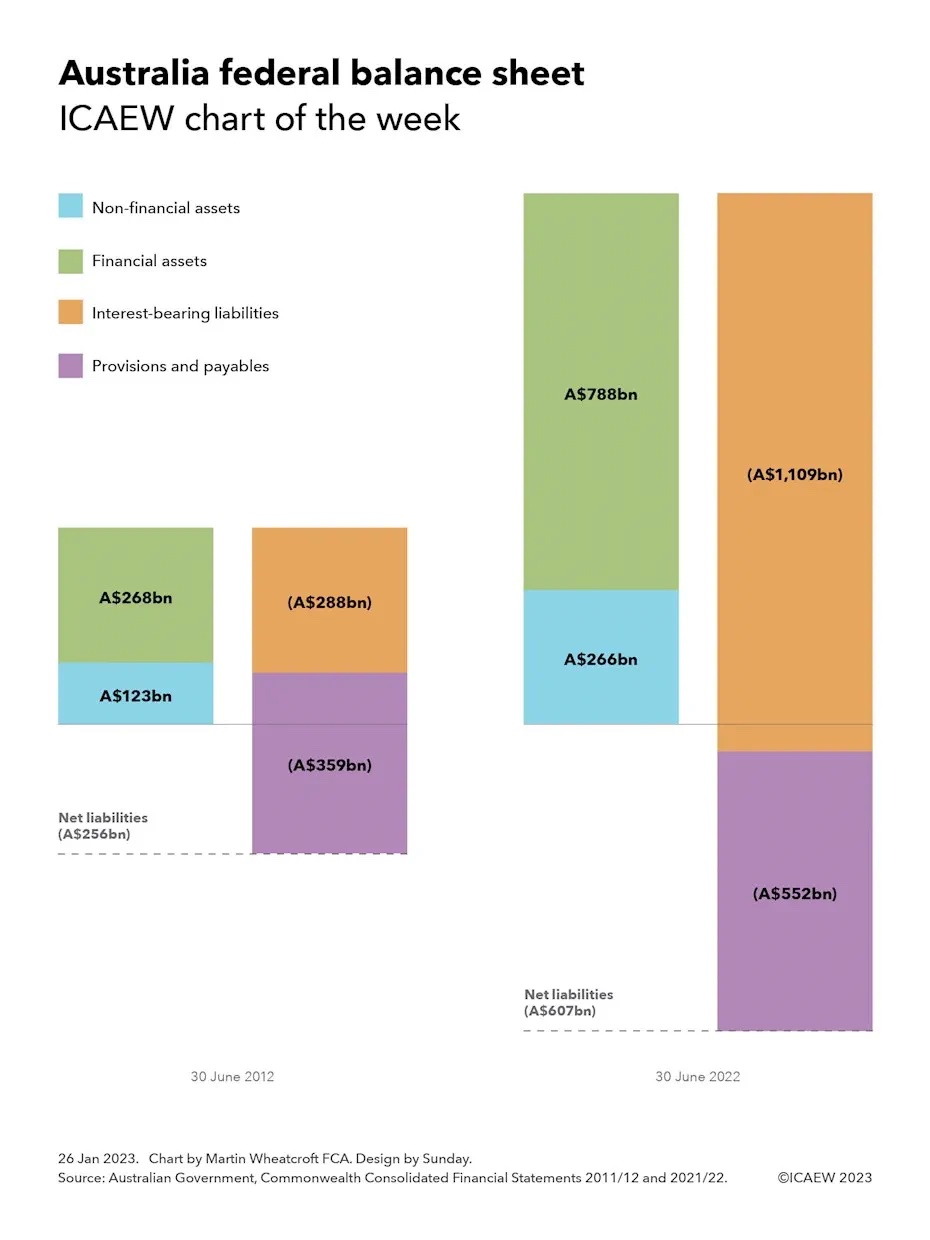
Our chart shows how the balance sheet has grown over the last 10 years, from net liabilities of A$256bn at 30 June 2012 (£147bn at the current exchange rate of A$1.77:£1.00) to A$607bn at 30 June 2022 (£348bn).

At 30 June 2012, the balance sheet comprised non-financial assets of A$123bn and financial assets of A$268bn, less interest-bearing liabilities of A$288bn, and provisions and payables of A$359bn to give a negative net worth of $256bn. These balances had grown to non-financial assets of A$266bn and financial assets of A$788bn at 30 June 2022, less interest bearing liabilities of A$1,109bn, and provisions and payables of A$552bn. 

Non-financial asset balances grew over the 10 years from 2012 to 2022 with land and buildings increasing from A$35bn to A$66bn, military equipment A$40bn to A$81bn, other plant, equipment and infrastructure $19bn to A$72bn, intangibles A$7bn to A$15bn, heritage and cultural assets A$10bn to A$13bn, and other from A$12bn to A$19bn.

Financial assets also grew, with investments and loan balances increasing from A$197bn to A$640bn, advances from A$27bn to A$70bn, receivables and accrued revenue from A$39bn to A$69bn, and cash from A$5bn to A$9bn. A substantial proportion of this growth relates to the Australia Future Fund, a sovereign wealth fund that was established in 2006 primarily to cover the costs of paying for unfunded pension obligations, together with a series of smaller funds intended to support infrastructure investment, disability insurance, medical research, indigenous communities and natural disasters.

Interest-bearing liabilities increased significantly as a consequence of the pandemic, with government securities increasing from A$268bn to A$577bn over the 10 years to June 2022, central bank and other deposits from A$3bn to A$426bn, and loans, leases and other interest bearing liabilities from A$17bn to A$106bn.

Provisions and payables grew by a lesser extent, with superannuation and other employee liabilities increasing from A$252bn to A$359bn, Australian currency on issue from A$54bn to A$102bn, payables from A$23bn to A$27bn, and provisions from A$30bn to A$64bn.

While negative net worth has increased from 17% of GDP to 24% of GDP over the 10 years, principally as a consequence of the pandemic in the last couple of years, the establishment of the Australia Future Fund, the move of federal employees from defined benefit to defined contribution pension arrangements, and active management of the balance sheet means that Australia is in a much healthier fiscal position than many other developed countries. 

For the Australian Department of the Treasury at least, this should make for a happy Australia Day.

This chart was originally published by ICAEW.