My chart for ICAEW this week illustrates how soldier, sailor and aircrew numbers have fallen from 338,000 fifty years ago to a new low of 136,000 on 1 Jan 2025. Could this be the turning point now that defence spending is back on the agenda?
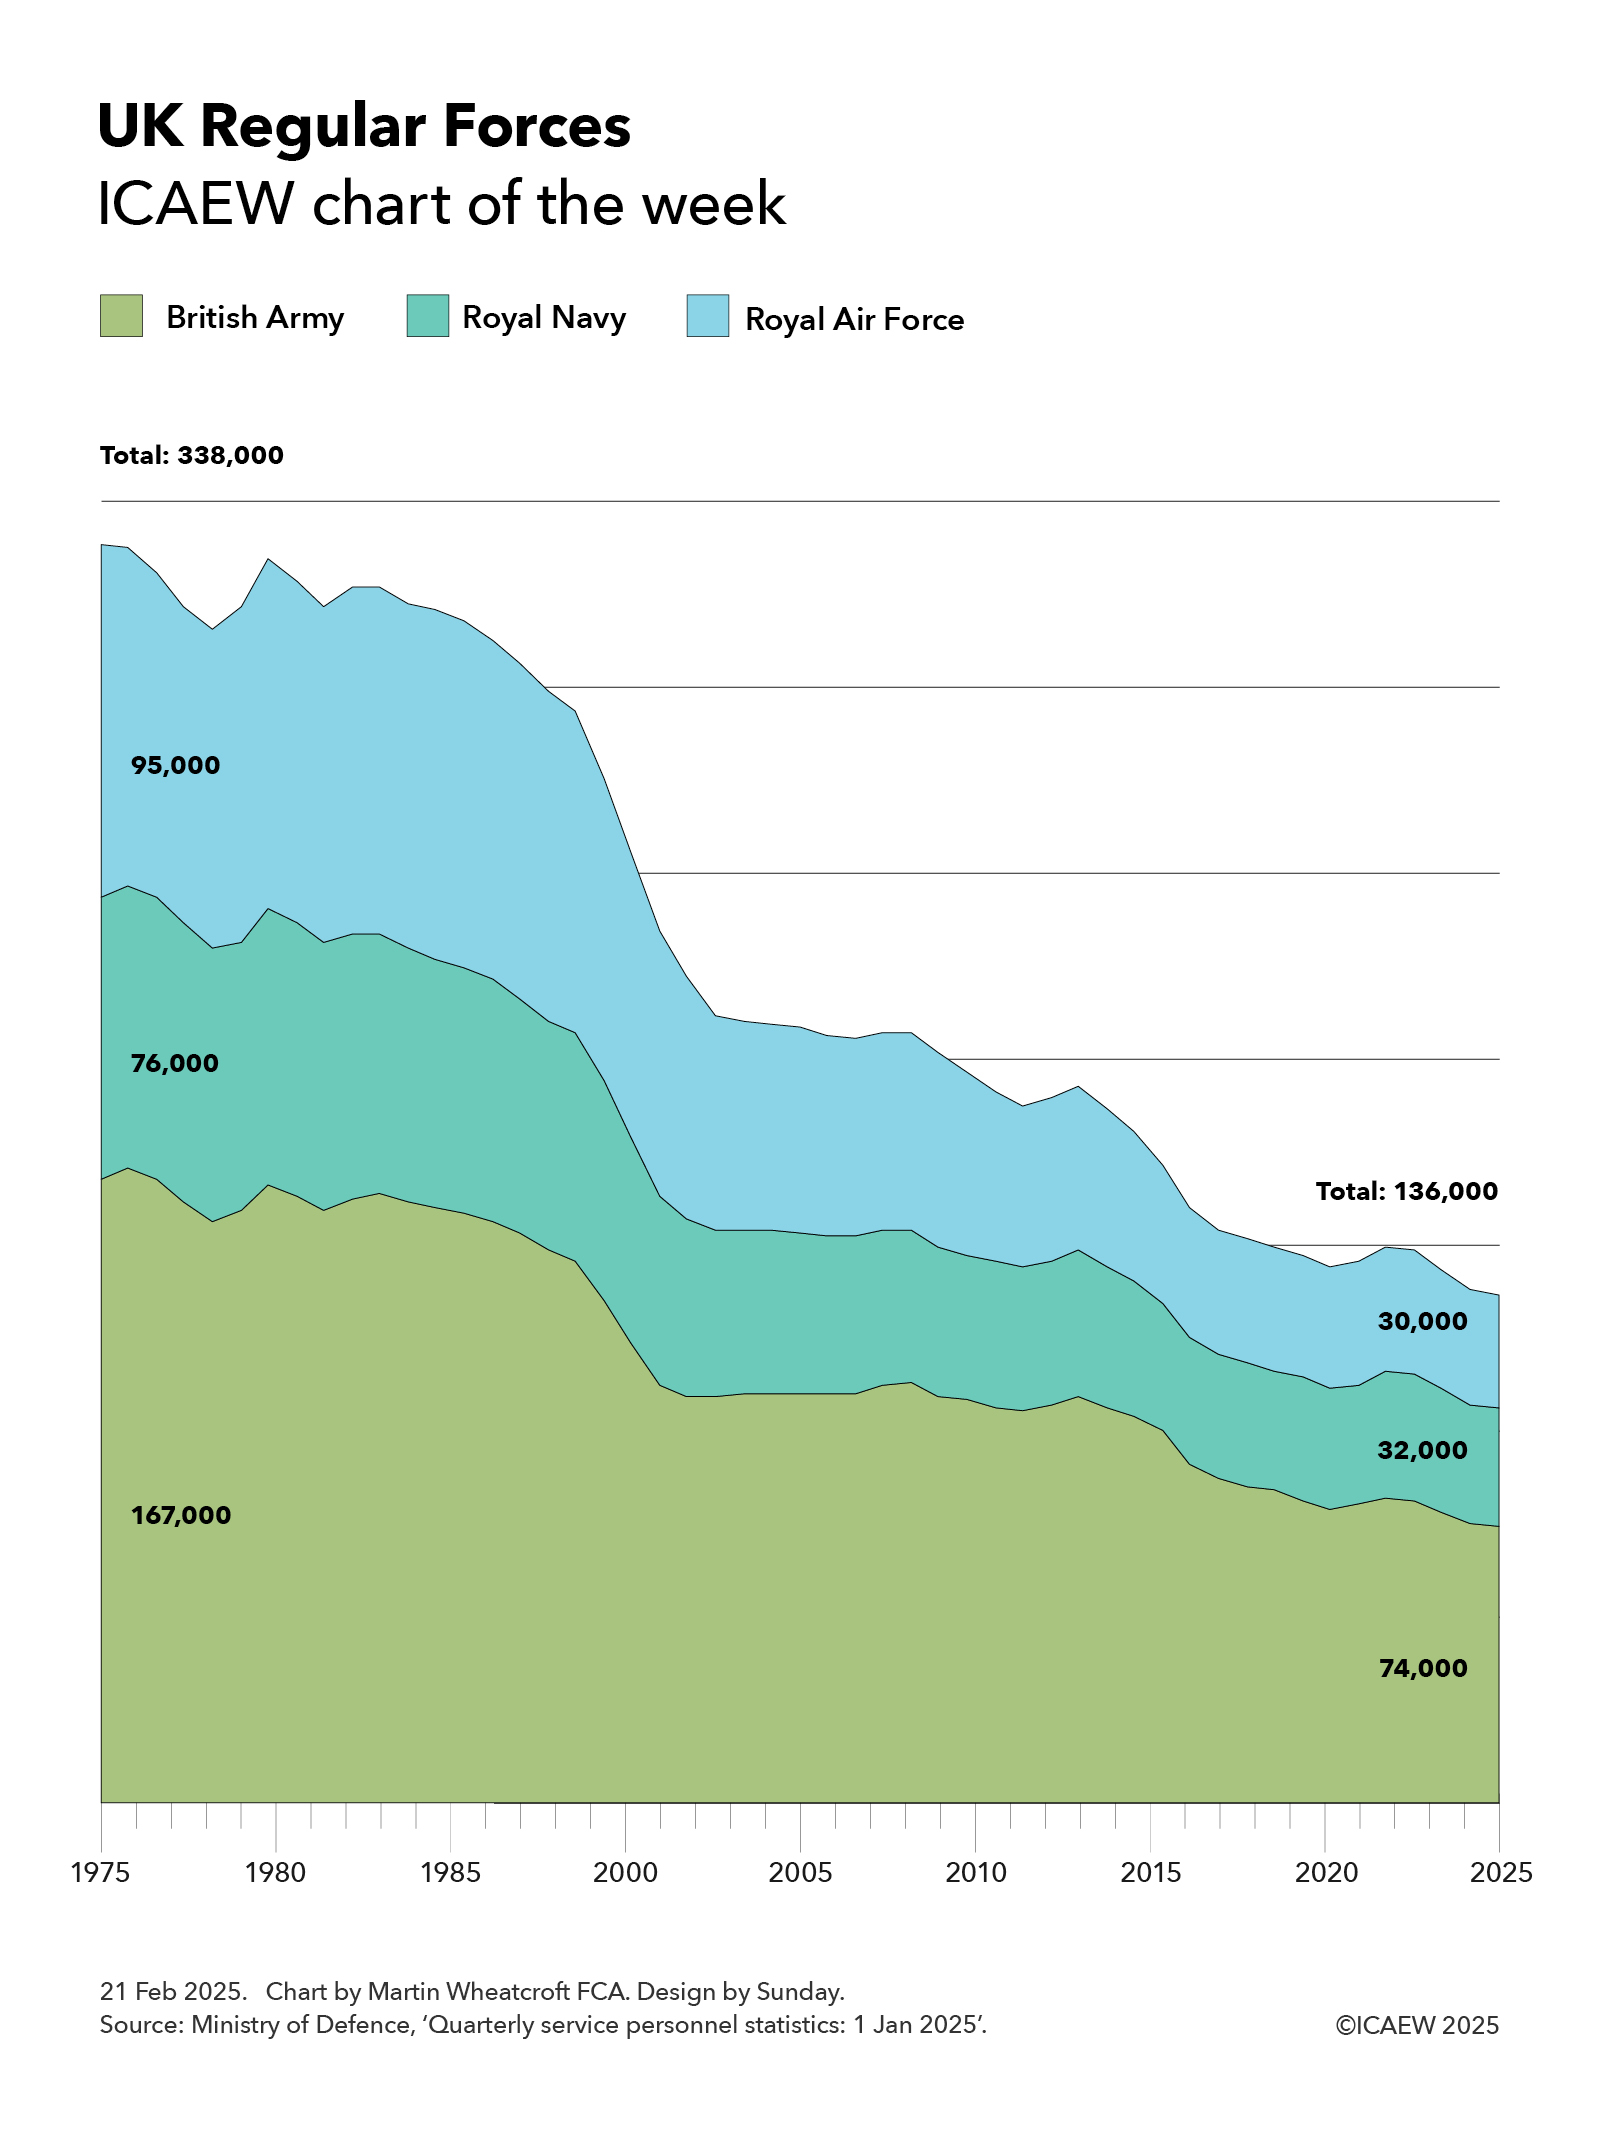
The latest armed forces personnel statistics published by the Ministry of Defence on 20 February 2025 report that UK Regular Forces fell from 136,861 on 1 October 2024 to 136,117 on 1 January 2025, which we have rounded to 136,000 for the purpose of my chart this week. This is made up of just under 74,000 members of the British Army, just under 32,000 in the Royal Navy, and just over 30,000 in the Royal Air Force (RAF).
These numbers exclude around 4,000 Gurkhas, 32,000 volunteers in the Army, Navy and RAF Reserves (including some who are mobilised) and around 8,500 other military personnel.
This is a significant decline from the 338,000 regular service personnel (167,000 in the British Army, 76,000 in the Royal Navy and 95,000 in the RAF) that were in the UK’s armed forces on 1 April 1975.
While some of this decline is due to automation and a shift of some activities from military to civilian staff, the main reason for the decline has been decisions by government to reduce our military capabilities over the past 50 years. Starting with the ‘peace dividend’ following the end of the Cold War, defence spending has been cut by successive governments to fund an expanding welfare state.
As a result, serving military personnel fell rapidly during the 1990s to reach 208,000 on 1 April 2000 (110,000 in the British Army, 43,000 in the Royal Navy and 55,000 in the RAF). Numbers started to fall again from around 2005, before accelerating downwards during the austerity years of the 2010s, and then again in the past few years following the pandemic and the energy crisis.
Recent debate about the capacity of the British Army to deploy a peacekeeping force to Ukraine has highlighted how few soldiers the UK now has, given our existing commitments and an increasingly concerning international security position.
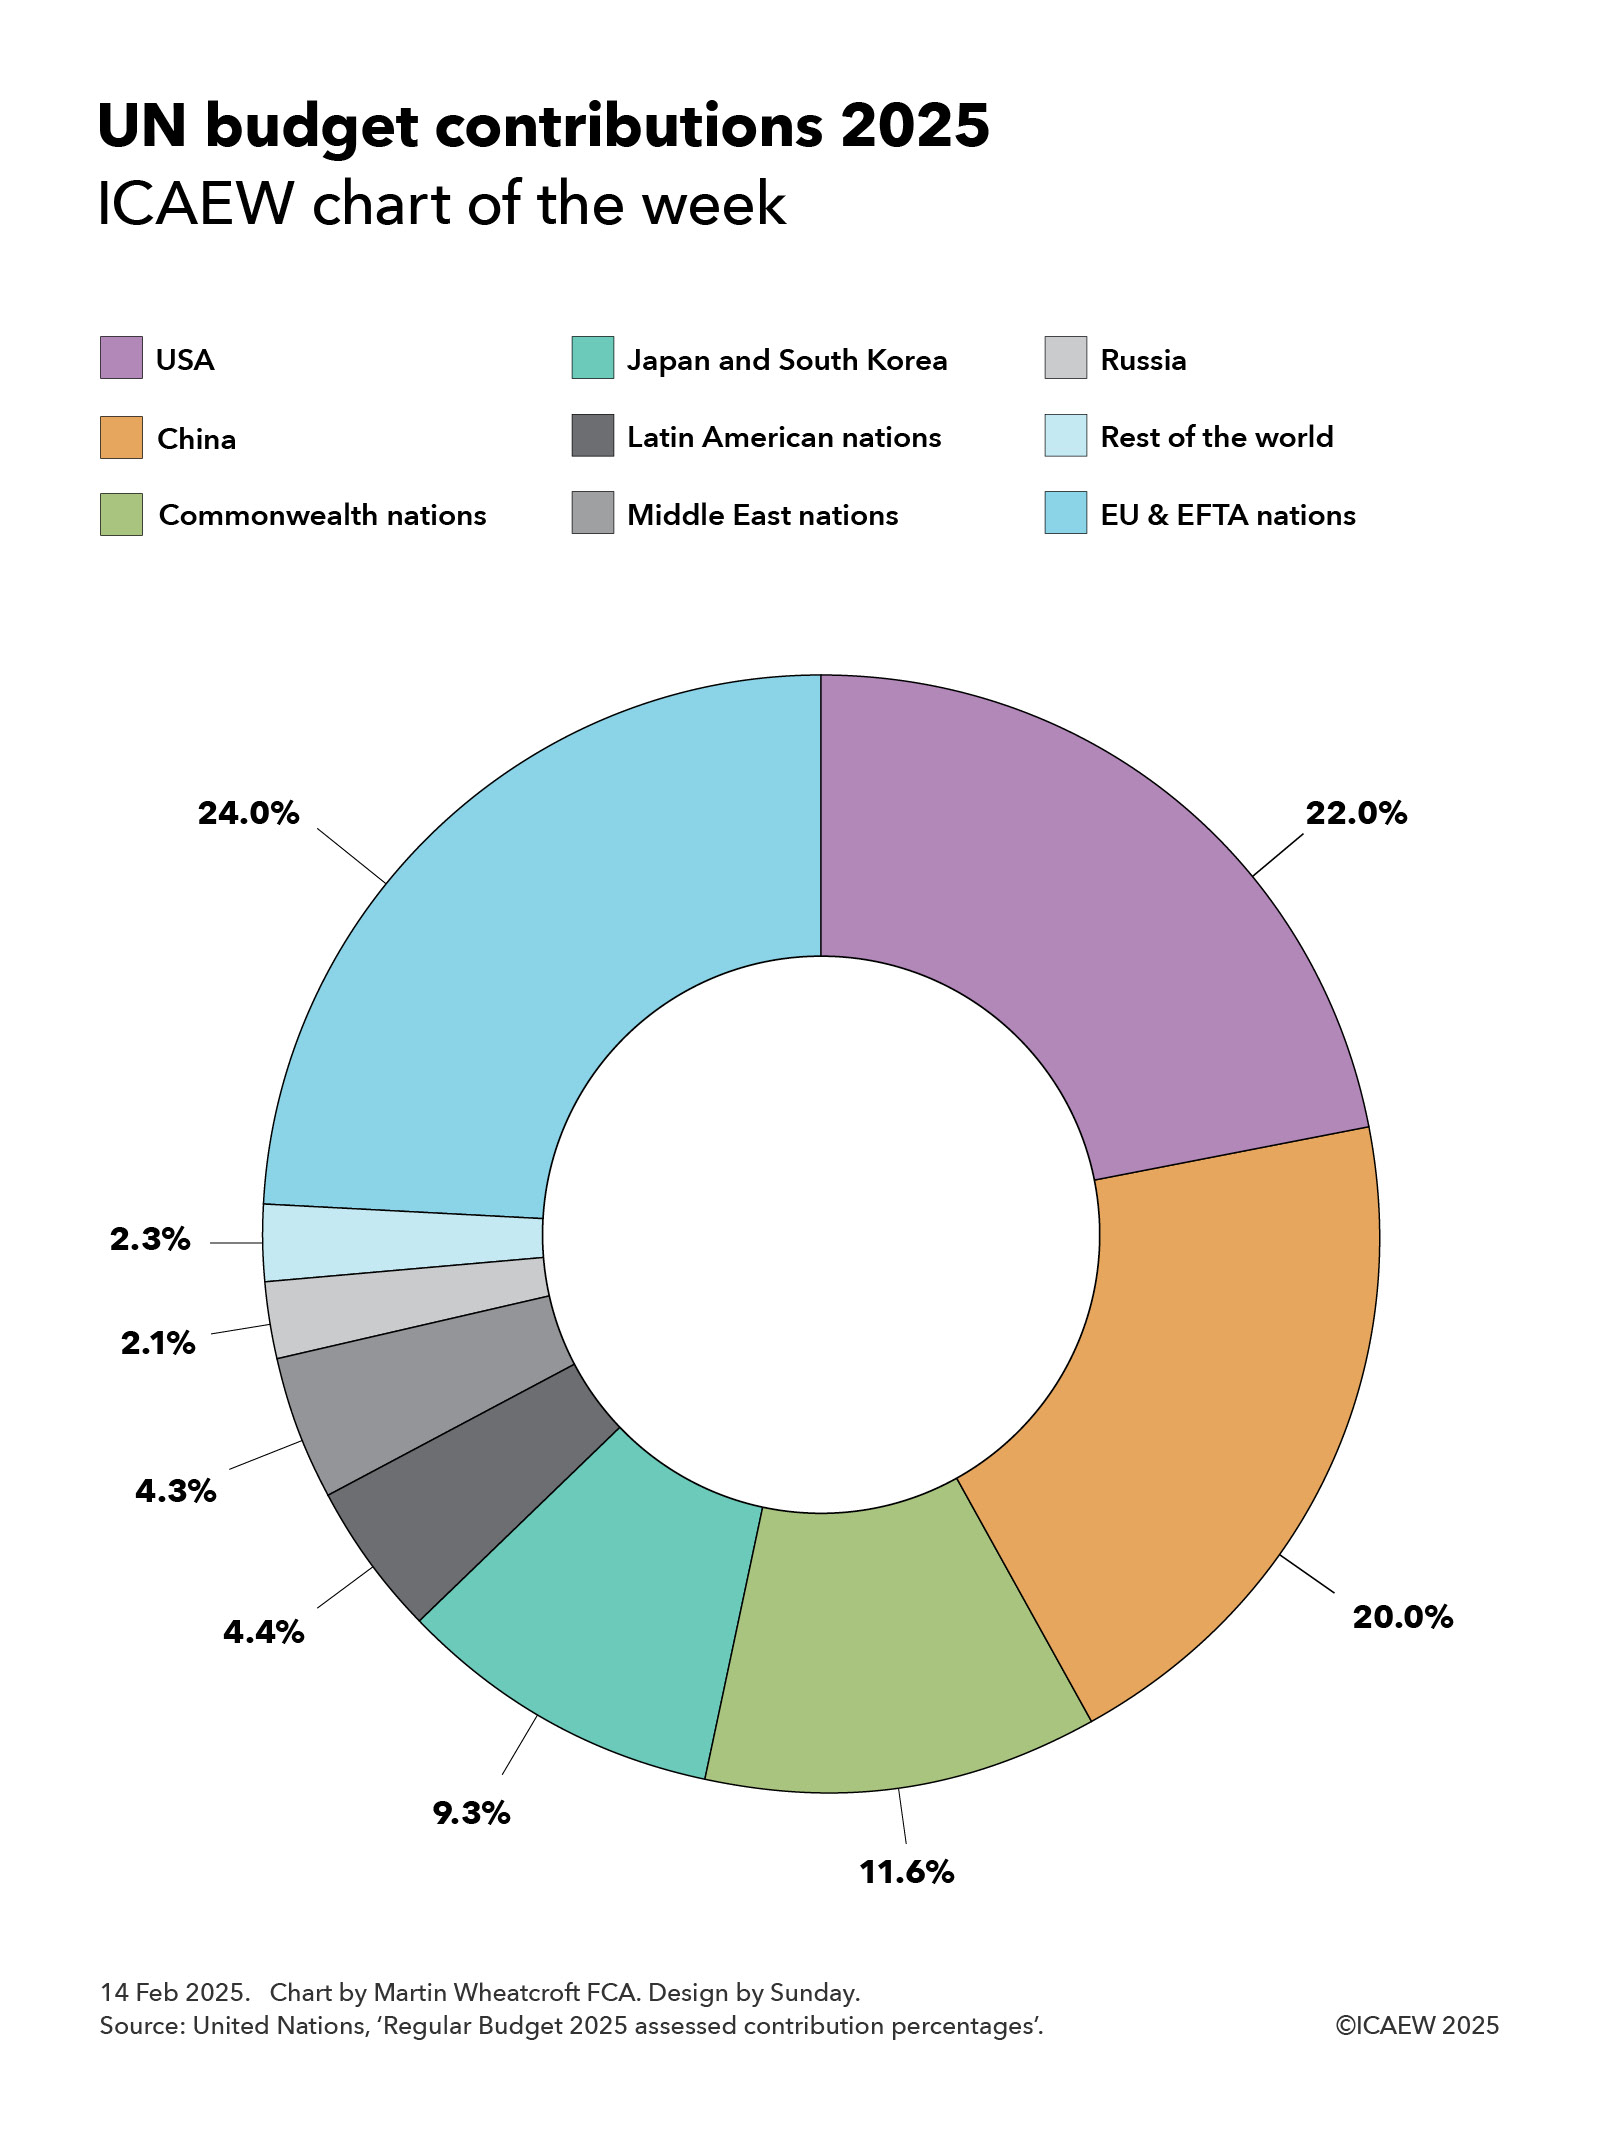
Overall, the 136,000 UK Regular Forces comprise around 4% of the 3.4 million total military personnel in NATO. In 2024 this comprised 1,300,000 in the US armed forces, 1,383,000 in EU countries who are also members of NATO (including 216,000 Polish, 205,000 French, 186,000 German, 171,000 Greek and 117,000 Spanish soldiers, sailors and aircrew), Türkiye 481,000, UK 138,000 (last year), Canada 77,000 and other non-EU European countries 39,000 (mainly Norway 24,000).
This may not be the nadir for the UK armed forces in terms of military strength, as numbers are likely to continue to fall over the next few quarters. However, the indications are that the UK is likely to switch to a path of increasing both defence spending and the number of soldiers, sailors and aircrew as it responds to calls from the US for European countries to increase their contribution to NATO and, more importantly, to address a much higher international risk environment.