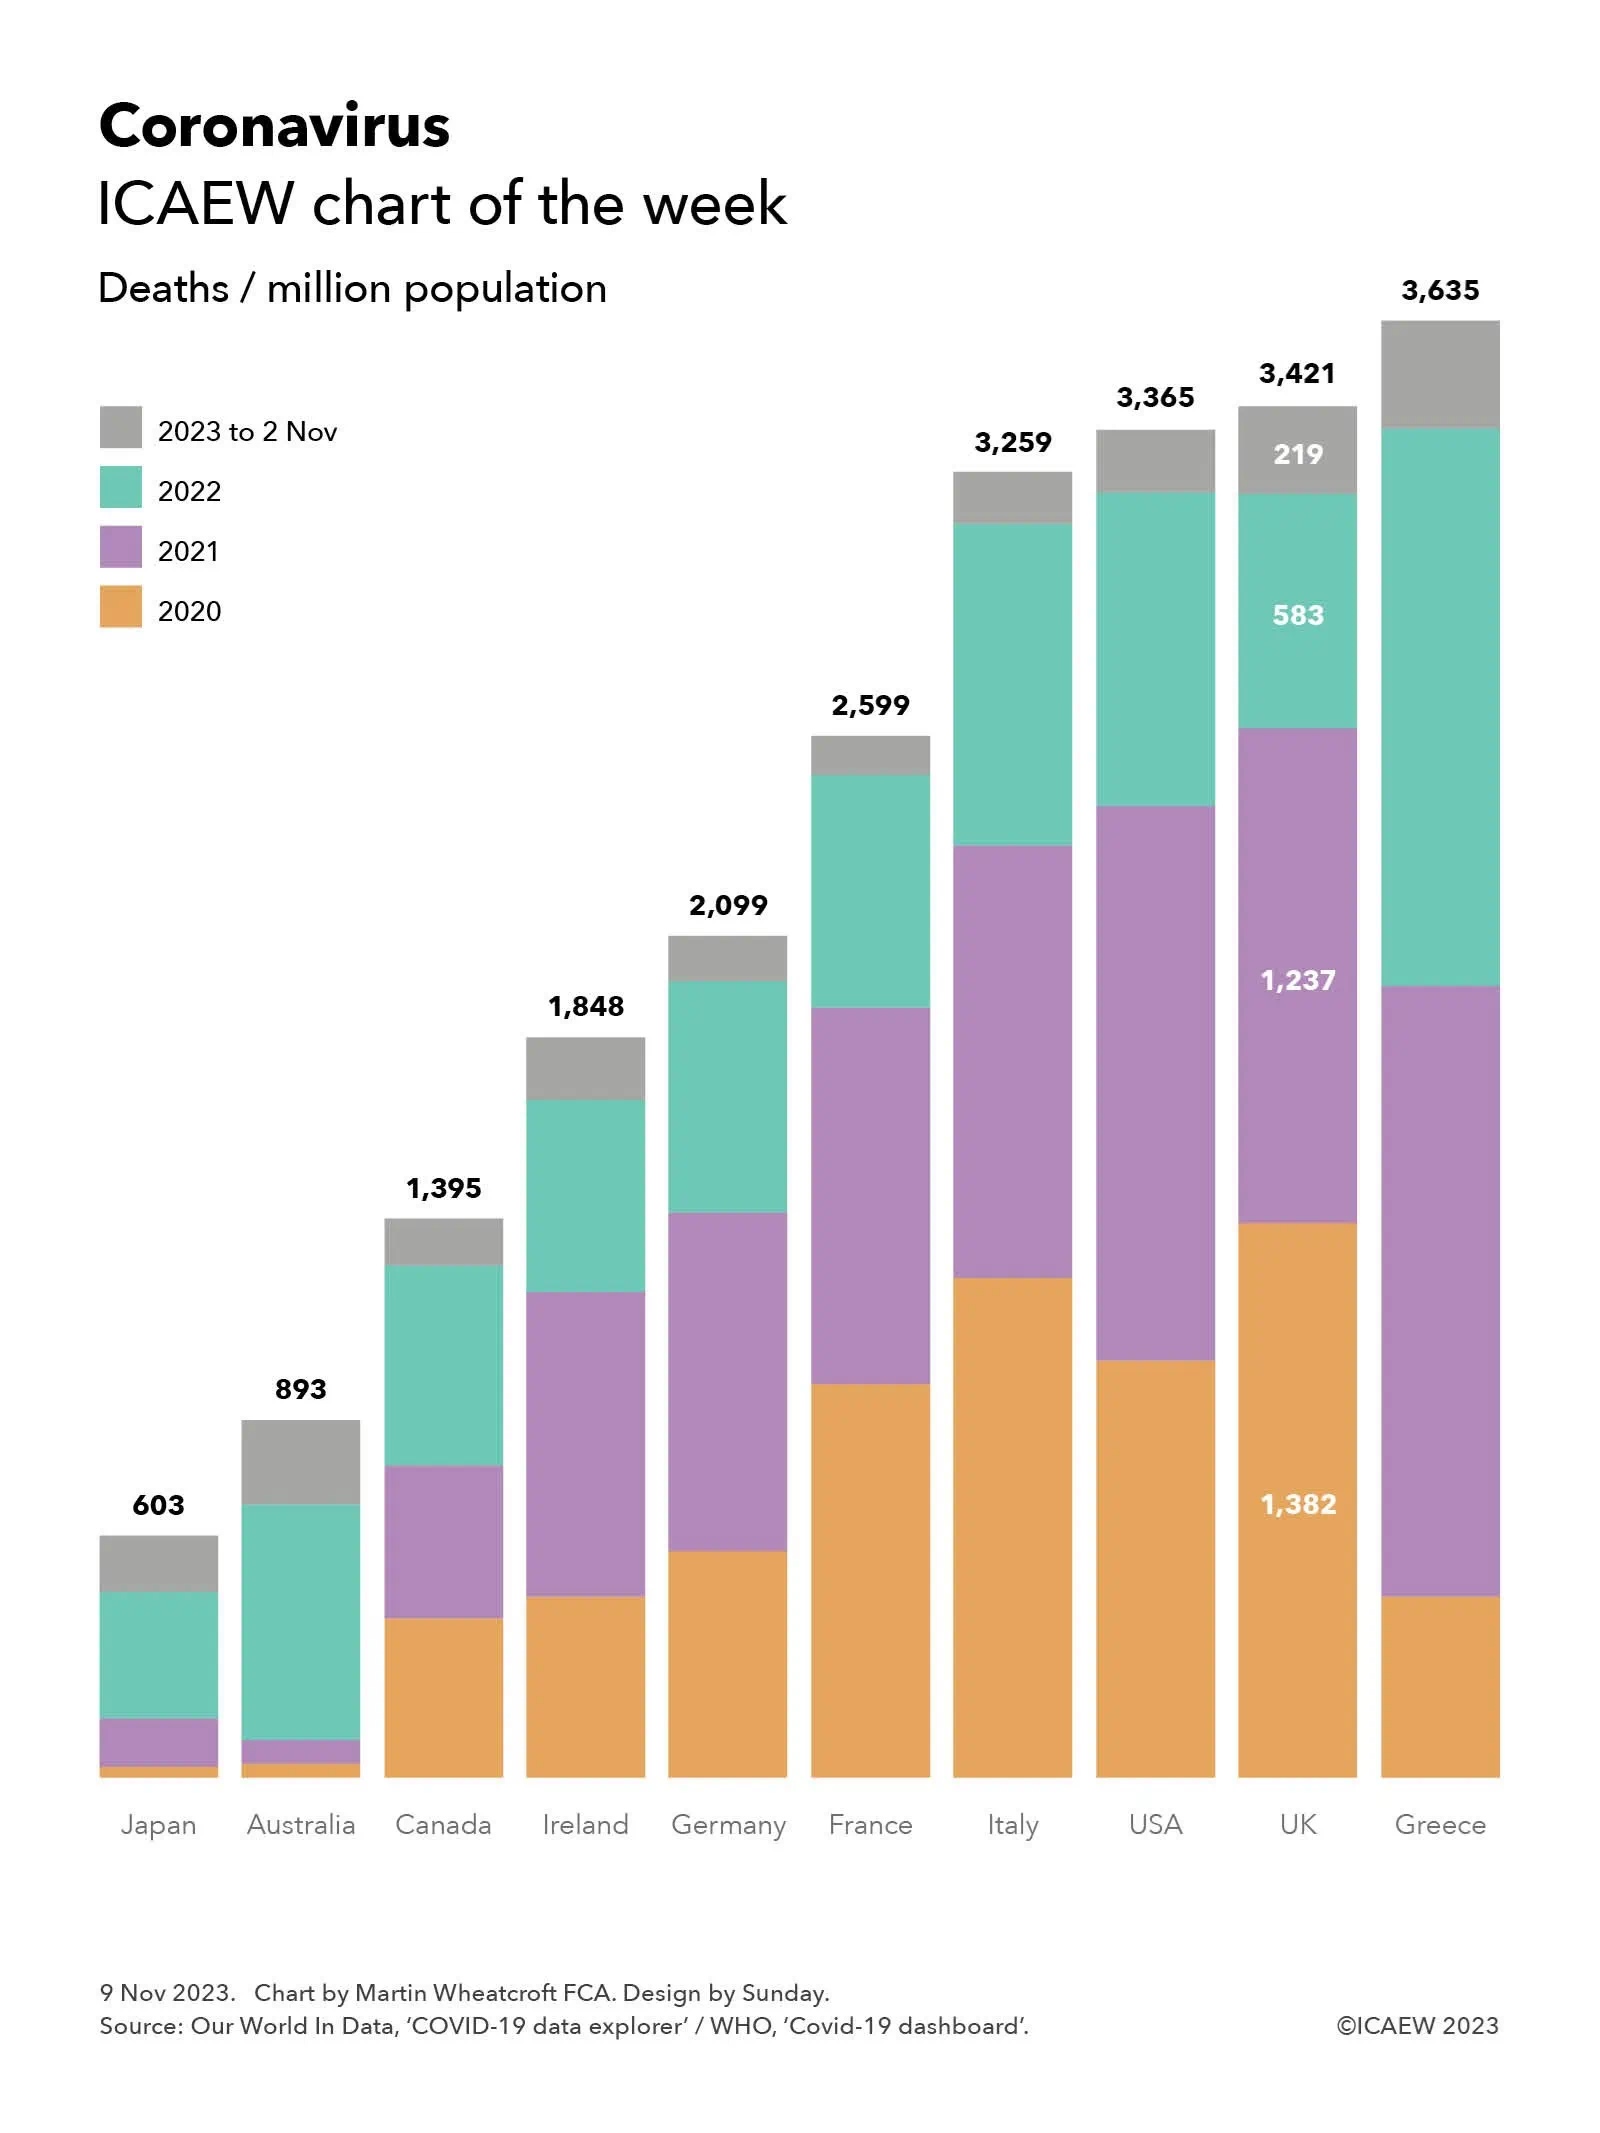
My chart this week looks at one of the big questions being looked at by the UK COVID-19 Inquiry: why did the UK experience one of the highest death rates in the developed world?
According to the official statistics, there were 3,421 deaths per million population attributed to COVID-19 in the UK between 1 January 2020 and 2 November 2023. This compares with 603 deaths per million in Japan, 893 in Australia, 1,395 in Canada, 1,848 in Ireland, 2,099 in Germany, 2,599 in France, 3,259 in Italy, 3,365 in the US and 3,635 in Greece.
Not shown in the chart are the total number of cumulative deaths attributed to COVID-19 (ie before dividing by the population) of 74,694 in Japan, 23,289 in Australia, 53,297 in Canada, 9,281 in Ireland, 174,979 in Germany, 167,985 in France, 192,406 in Italy, 1.14m in the USA, 230,974 in the UK, and 37,738 in Greece.
Both Our World In Data and the WHO give warnings about the data, especially given difficulties in identifying which deaths were caused by the coronavirus (especially in 2020 before testing was widely available), whether deaths are recorded when they happened or when they were reported, and differences in how countries attribute deaths to causes.
Despite those factors, these statistics give an overall impression of how badly the coronavirus affected different countries, especially when combined with other data, such as excess mortality (also not shown in the chart). According to Our World In Data, the cumulative difference between total deaths reported from all causes and projected deaths (based on an extrapolation from the years prior to the pandemic) changes the rankings for the countries in our chart, improving the UK’s position to an extent with the US has more excess deaths proportionately than the UK, and Italy more than Greece. Australia has the lowest level of excess deaths for these countries, below Japan, while France is between Canada and Ireland.
The chart also illustrates the deaths per million of population by year, highlighting how for the UK this was 1,382 in 2020, 1,237 in 2021, 583 in 2022, and 219 in 2023, up to 2 November 2023.
The UK COVID-19 Inquiry is looking at much more than the number of deaths as it considers how coronavirus affected all of us over the past few years, how people were affected, including short- and long-term impacts on health and how people died, as well as the impact on the economy and our lives more generally of COVID-19 – and the UK Government’s response to it.
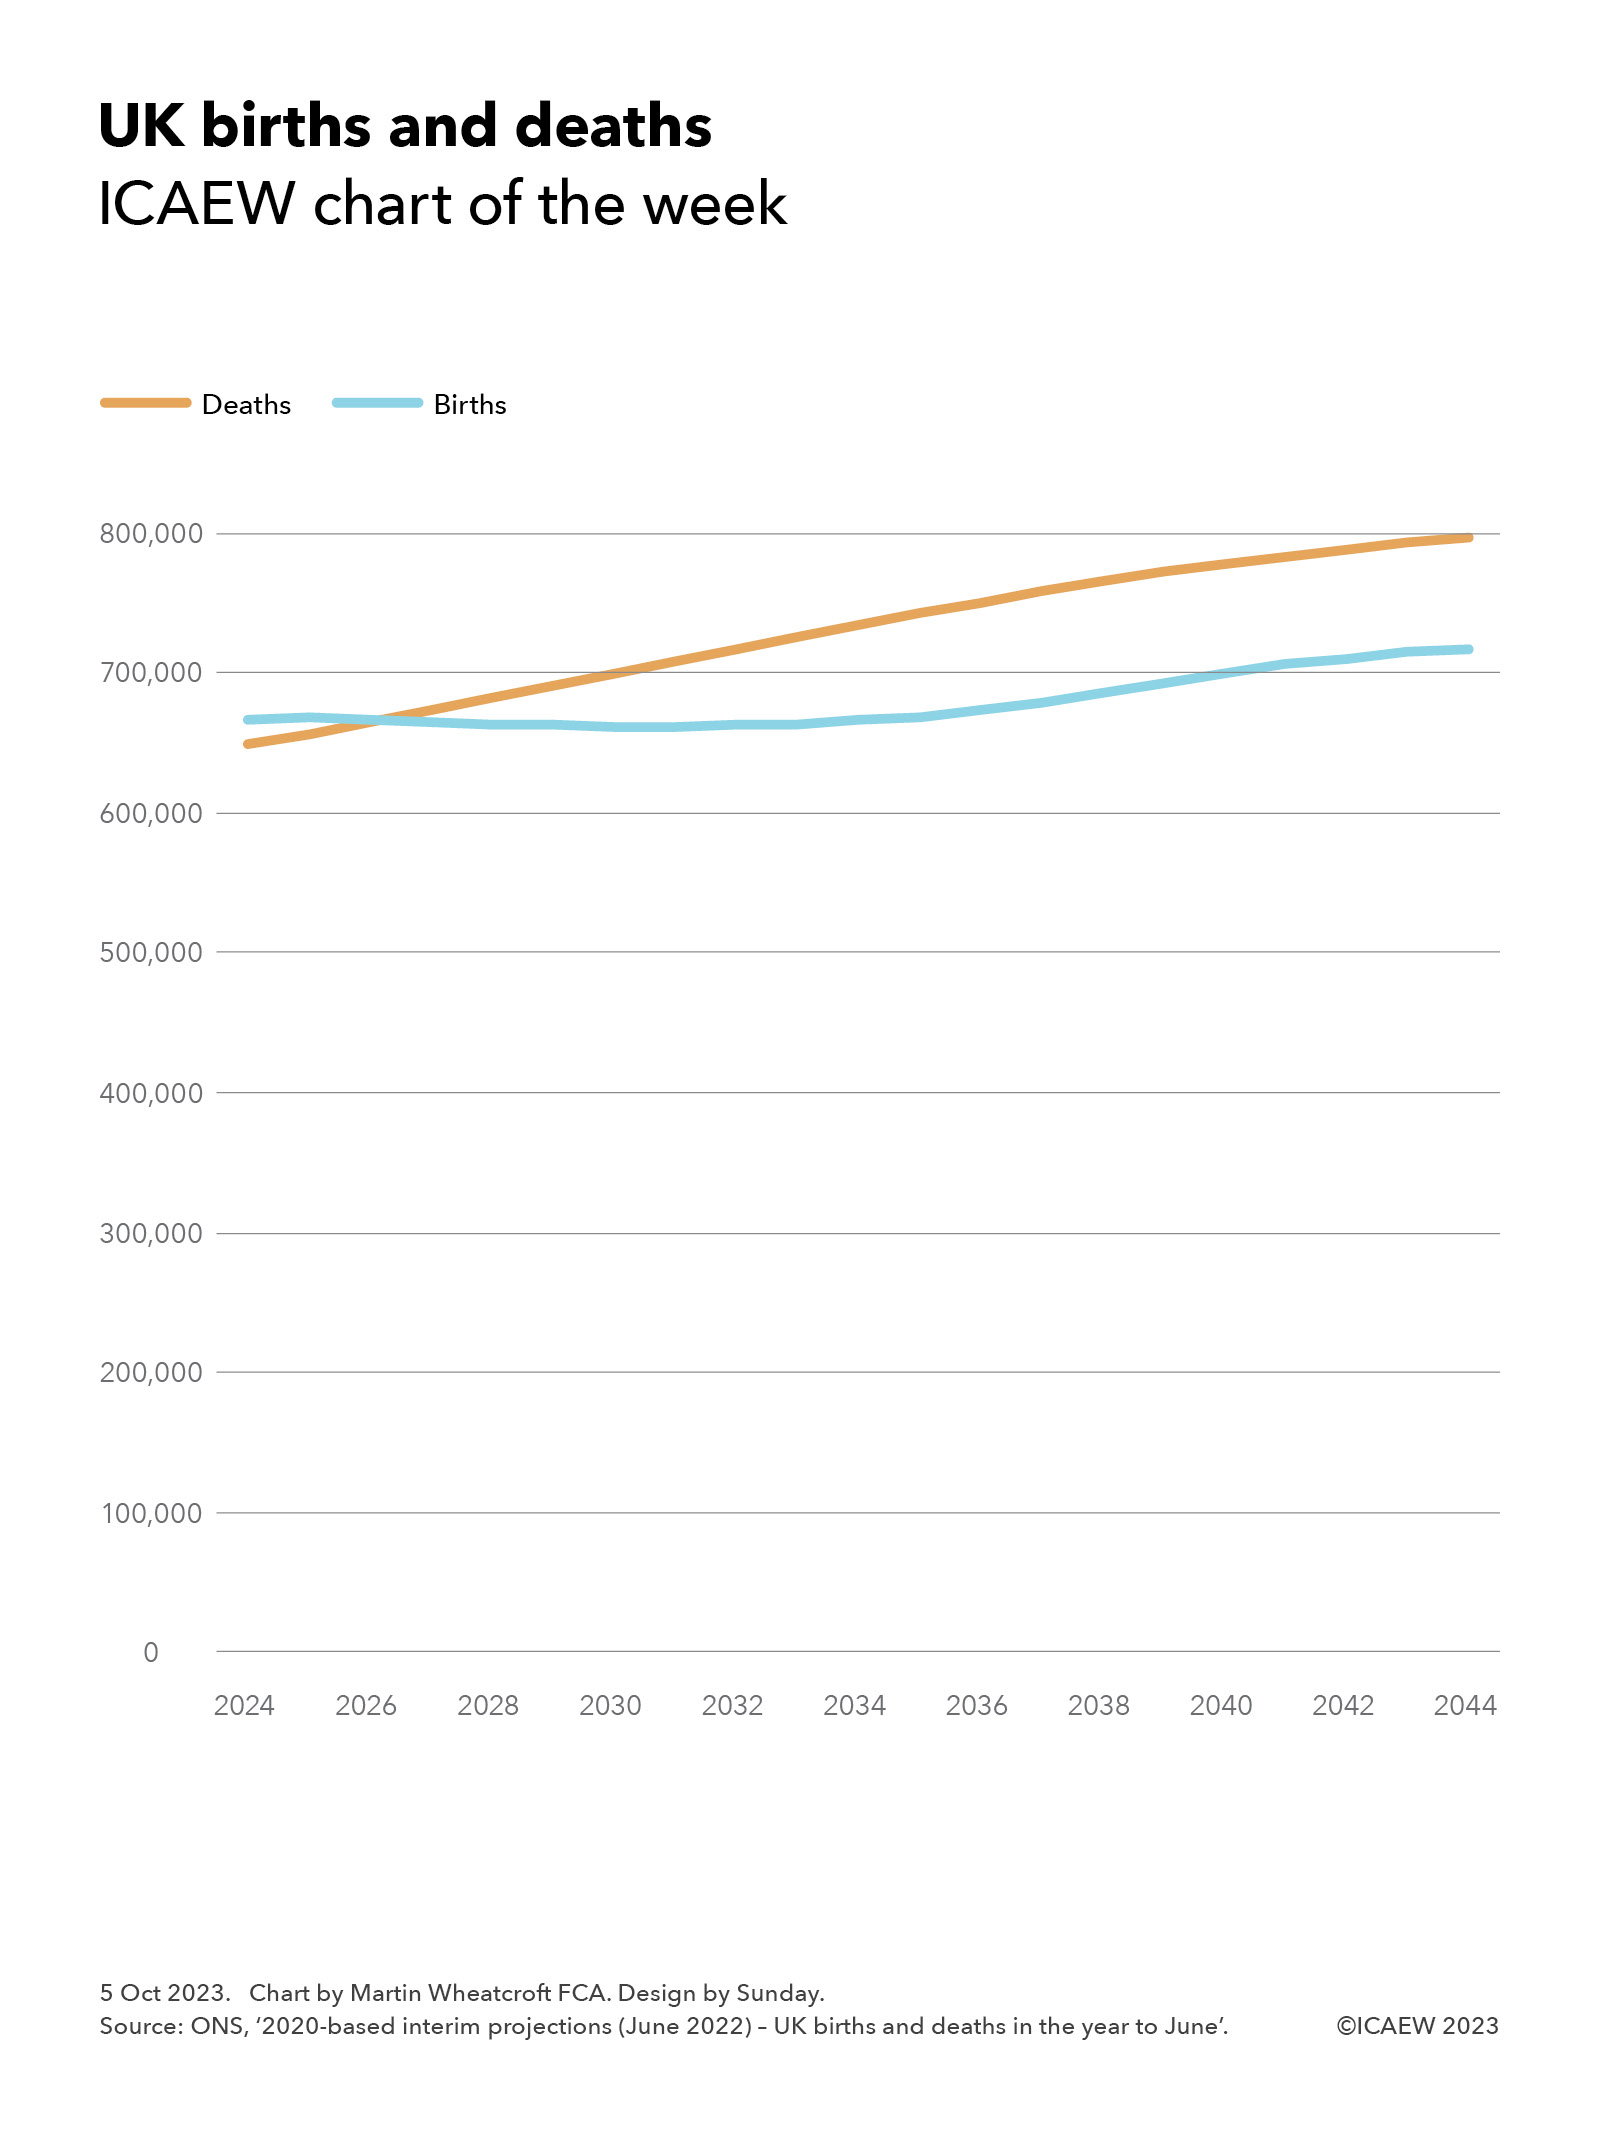
My chart this week looks at how deaths in the UK are expected to exceed births within just a couple of years – a major change in our demographic story.
The big drivers of population change in the UK (and in many other developed countries) have been a declining birth rate and more people living longer, resulting in a growing population even before taking account of net inward migration.
However, that growth is starting to slow as the birth rate has declined as a proportion of the overall population – absent migration, it is expected to start to go into reverse as the death rate rises, driven by the bulge in the population constituted by the ‘baby boomer’ generation reaching their 60s and 70s.
As illustrated by my chart this week, the number of births is expected to fall slightly over the next few years (from 667,000 in the year to June 2024 and 668,000 in the year to June 2024 to 662,000 in the year to June 2031) before gradually rising to 718,000 in the year to June 2044. At the same time deaths are expected to rise throughout the period, from 650,000 in the year to June 2024 to 797,000 in the year to June 2044.
The projection is for births of 667,000 and deaths of 665,000 in the year to June 2026, a small net increase of 2,000, before reversing after that to reach 80,000 more deaths than births in the year to June 2044.
The population is still expected to grow, despite this shift from (to use the statistical terminology) ‘natural’ growth in the population (births exceeding deaths) to ‘natural’ contraction (deaths exceeding births). This is because the ONS has assumed net inward migration will continue at an average of 245,000 a year for most of the projection period, resulting in a projected growth in the population of 4.0m people or 6% (from 68.1m to 72.1m) over the next 20 years, in contrast with the 8.4m or 14% increase in the UK’s population over the past two decades.
Without inward migration, the likelihood is that the gap between deaths and births would be even larger than illustrated in our chart, given that a proportion of the children expected to be born will be the children of migrants.
This change in the demographics of the UK will have significant implications for the debate about migration over the coming decades, especially if the population absent migration is shrinking by 80,000 a year by 2044 as projected by the ONS.
There are also implications for the public finances as, even with net inward migration, population growth is expected to be less than 0.3% a year over the next two decades instead of the 0.7% a year seen over the past 20 years. Not only will that reduce the potential for economic growth, but it will reduce the opportunities for efficiencies of scale in public spending that have been possible in previous decades.
The demographic tale of the 20th century in the UK was one of a rapidly growing population as many more children survived into adulthood, life expectancy increased significantly and migration offset a declining birth rate. The 21st century looks like being a very different story.
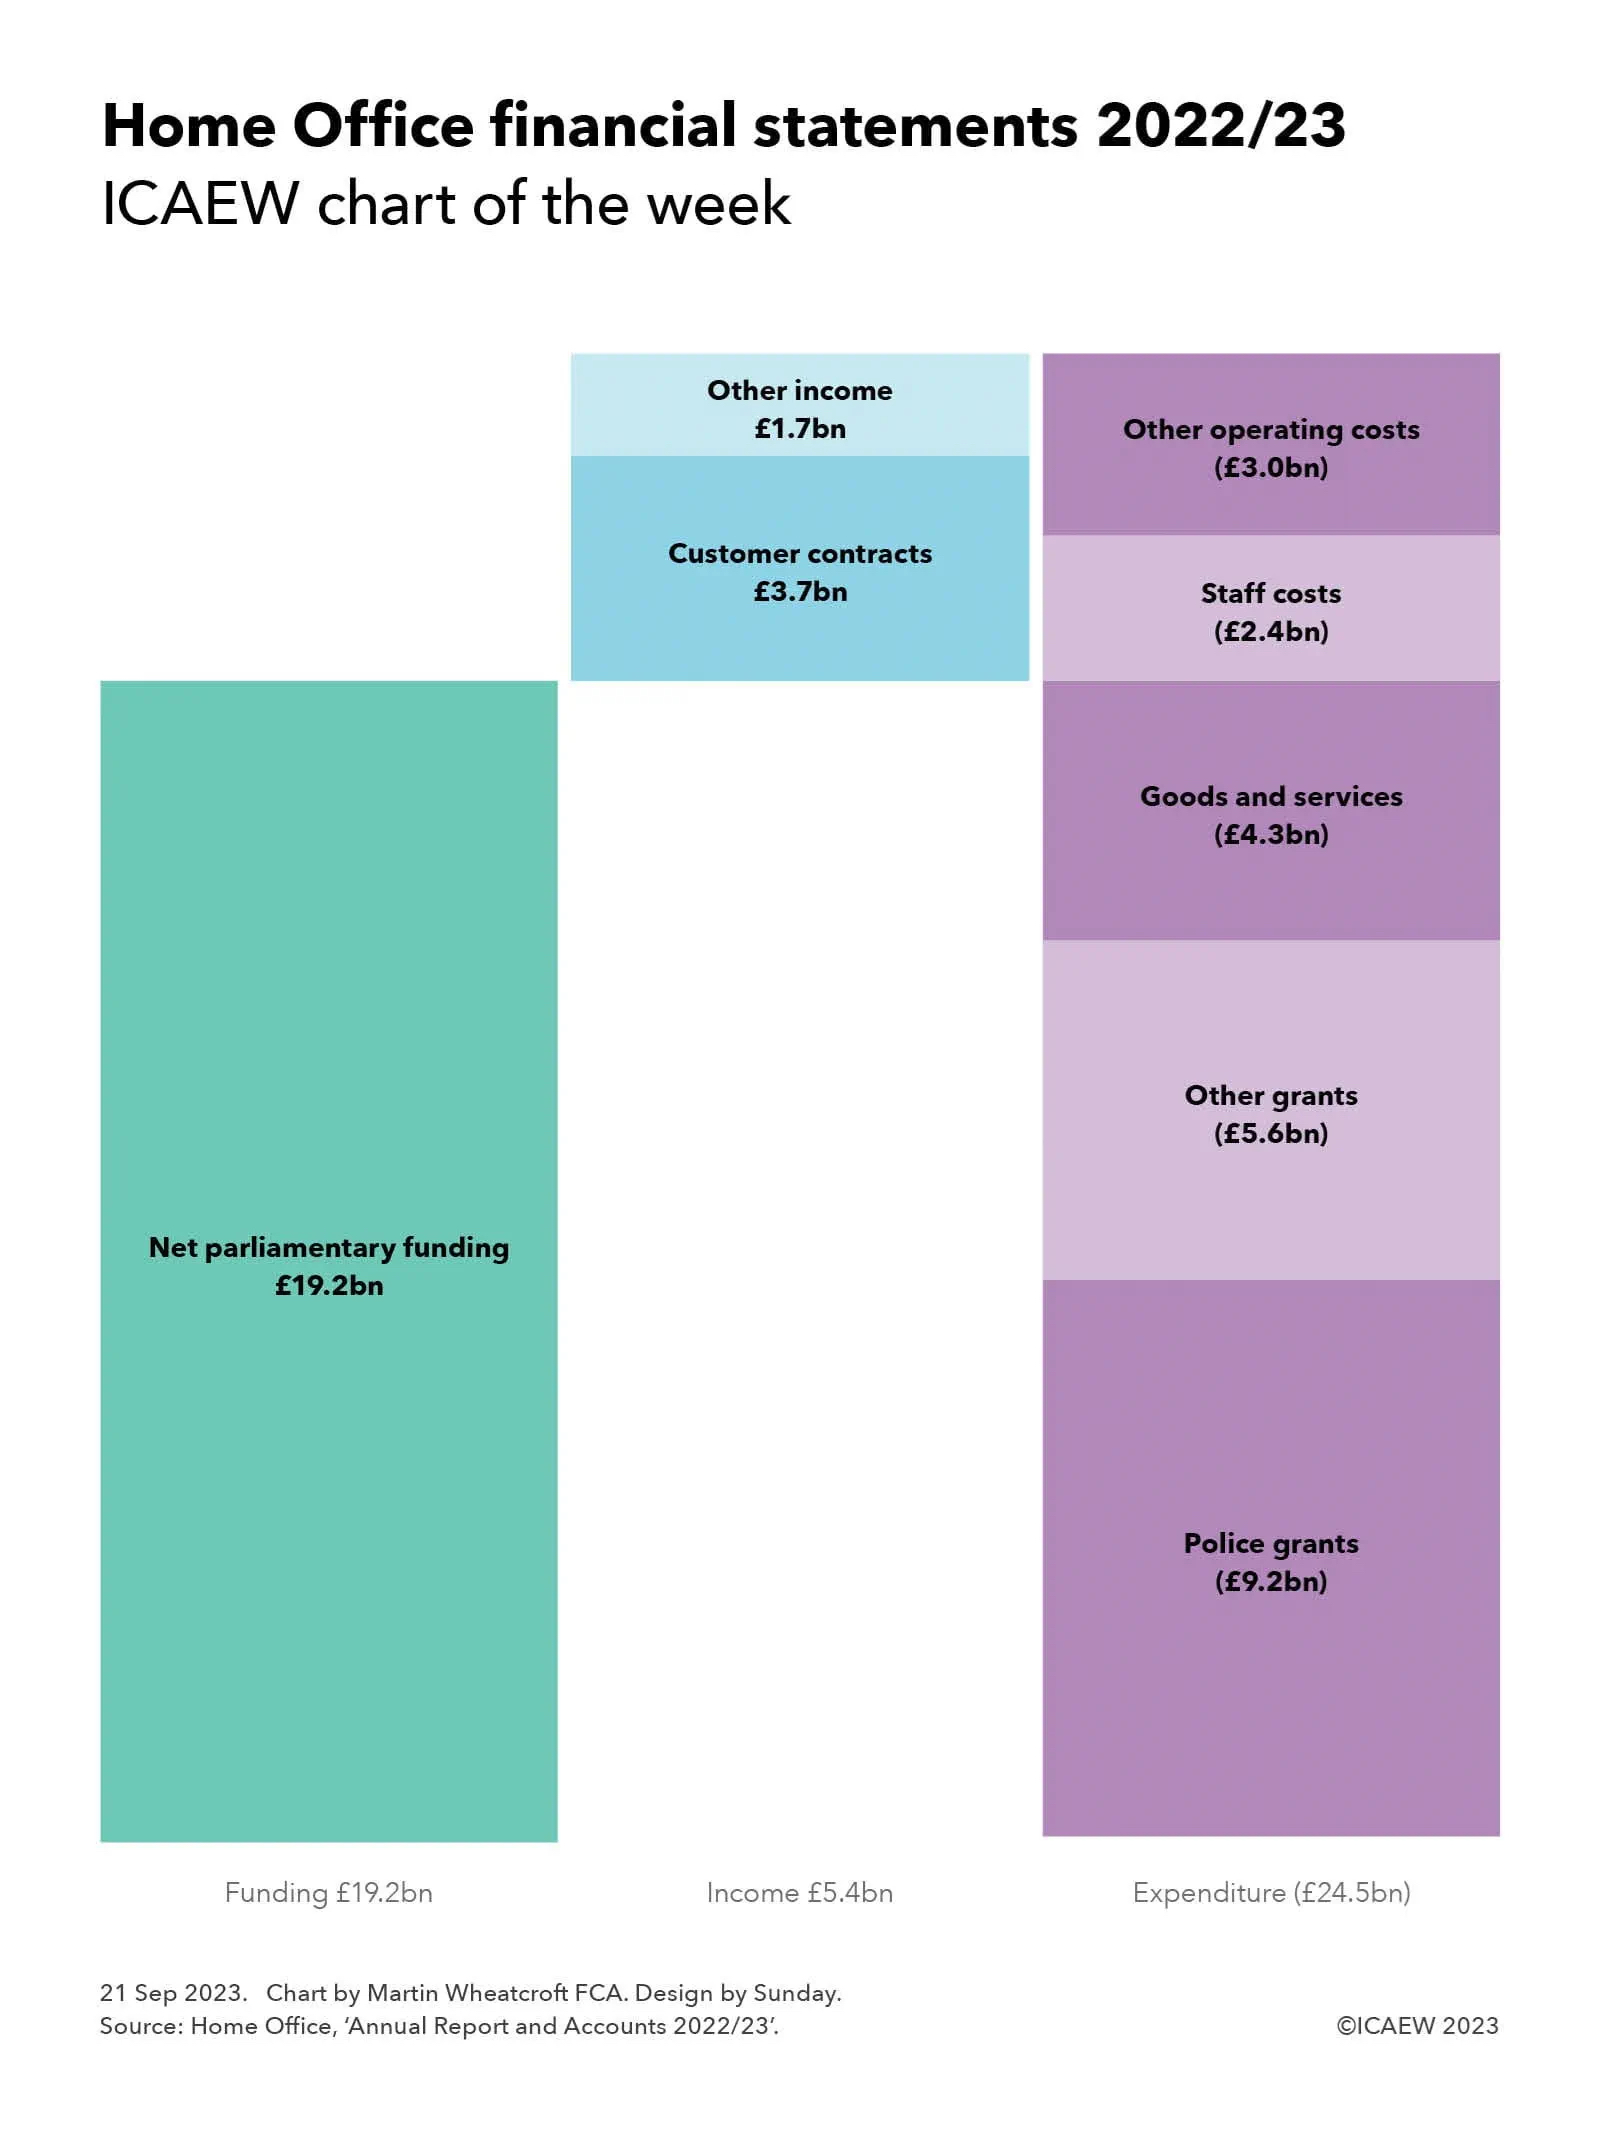
The Home Office spent £24.5bn in 2022/23 according to its recently published annual financial report, funded by £5.4bn in income and £19.2bn in net parliamentary funding.
The Home Office published its Annual Report and Accounts for the year ended 31 March 2023 on 19 September 2023.
Net expenditure in 2022/23 was £19.1bn, comprising expenditure of just over £24.5bn net of income of £5.4bn, while parliamentary funding net of other items amounted to £19.2bn.
The Home Office breaks down its income for the year of £5.4bn between revenue from contracts with customers of £3.7bn and other income of £1.7bn. The former includes £2.2bn from visa and immigration charges, £0.6bn in passport fees, £217m for the disclosure and barring service (DBS), and £0.7bn from other sources. Other income is primarily comprised of immigration health surcharges payable by foreign residents and visitors for the use of the National Health Service, a proportion of which is transferred to the Department of Health and Social Care and the devolved administrations.
As our chart this week illustrates, the majority of the Home Office’s spending is in the form of grants. The largest grants, totalling £9.2bn, are to local police forces across England to supplement the council tax precepts they raise locally. Other grants include £1.7bn to top up police pensions, £0.4bn to top up fire and rescue services pensions, £3.3bn in other operating grants (many of which also go to police forces, in addition to transfers to other government departments) and £209m in capital grants.
Purchases of goods and services of £4.3bn is dominated by the £3.1bn paid in relation to asylum and detention, together with £287m in facilities management and staff services, £229m on professional fees, £219m for media and IT, £169m for passport printing and stationery and £120m for visa and immigration commercial partners amongst other costs.
Staff costs of £2.4bn cover the costs of employing full-time equivalent averages of 41,607 permanent staff, seven ministers, seven special advisers, and 6,489 other staff during 2022/23. Wages and salaries amounted to £1.8bn, equivalent to an average full-time equivalent salary of £37,900.
At 31 March 2023 there were 345 senior civil servants on salaries in excess of £70,000, of which 251 were between £70,000 and £100,000, 86 between £100,000-£150,000 and eight between £150,000 and £190,000. The average of seven government ministers who served during the year (a total of 22 different individuals!) earned the equivalent of an average annual salary not including pension entitlements of around £49,000 in addition to their parliamentary salary or House of Lords attendance allowances.
Other operating costs of £3.0bn include £1.6bn on IT and accommodation-related service charges, £0.7bn for depreciation and amortisation of assets, and £113m in asset recovery costs together with other costs.
Parliamentary funding net of other items of £19.2bn is reported in the consolidated statement of taxpayers’ equity and comprised £19.4bn in drawn-down parliamentary funding, £0.3bn in deemed funding less £0.5bn in amounts repayable.
Not shown in the chart is the Home Office’s consolidated balance sheet, which comprised £2.6bn in non-current assets, trade and other receivables of £0.7bn and cash and cash equivalents of £0.6bn less trade and other payables of £3.7bn, £0.6bn in lease liabilities and £0.5bn in provisions to give net liabilities of £0.9bn.
Reported in the notes to the accounts are £0.8bn in capital additions, of which £374m was incurred on software and other intangible assets.
Deficit marginally better than had been expected according to the latest figures from the ONS, but costly public sector problems emerge.
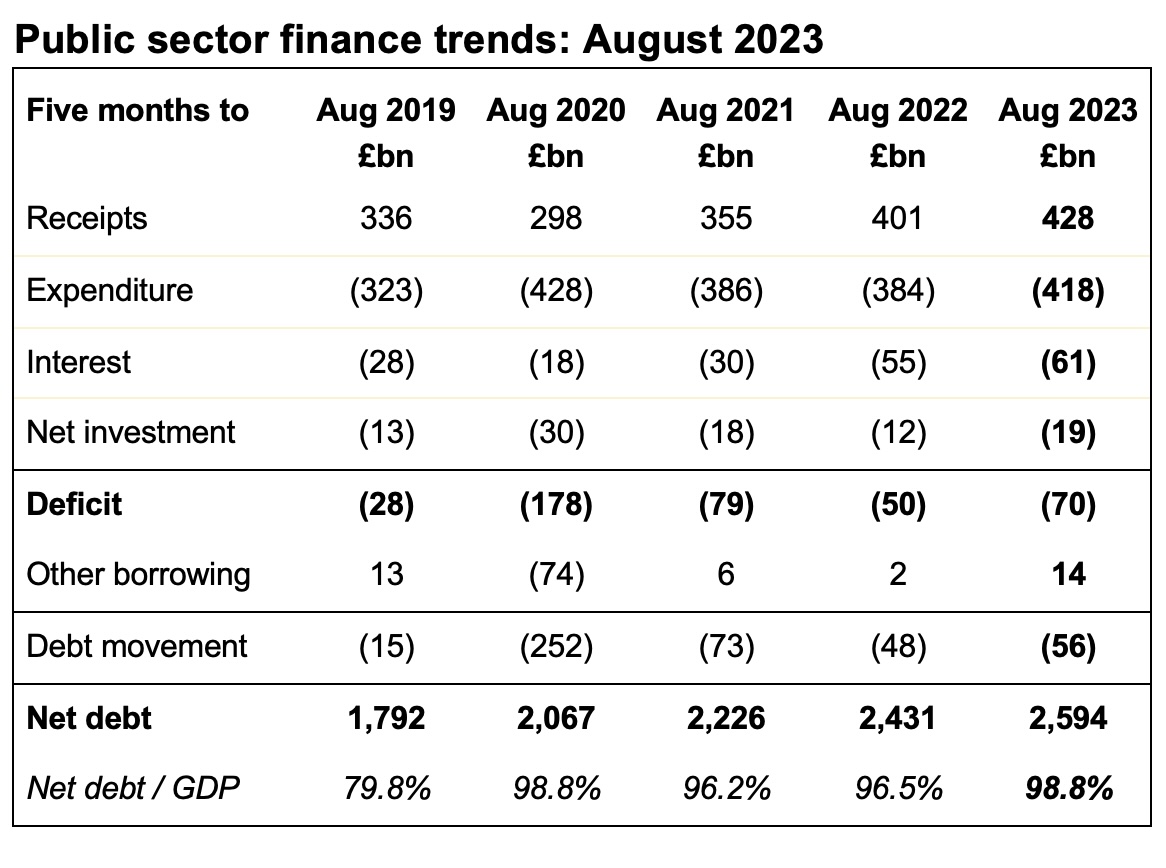
The monthly public sector finances for August 2023 were released by the Office for National Statistics (ONS) on Thursday 21 September 2023. These reported a provisional deficit for the fifth month of the 2023/24 financial year of £12bn, bringing the total deficit for the five months to £70bn, £19bn more than in the same period in the previous year.
Alison Ring OBE FCA, Public Sector and Taxation Director for ICAEW, said: “While August’s deficit was marginally better than expected, problems costly to the public sector continue to emerge, from crumbling concrete in public buildings to Birmingham Council’s recent bankruptcy, and are likely to weigh on the Chancellor’s mind as he considers November’s Autumn Statement.
“Both main parties are rightly cautious about making new public spending commitments in the current economic environment, including whether or not to extend the state pension triple lock into the next parliament. Whether they can hold this position as they enter into the party conference season remains to be seen.”
Month of August 2023
The provisional shortfall in taxes and other receipts compared with total managed expenditure for the month of August 2023 was just under £12bn, being tax and other receipts of £84bn less total managed expenditure of £96bn – up 5% and 8% respectively compared with August 2022.
This was the fourth highest August deficit on record since monthly records began in 1993, following the deficits of £14bn in August 2021 and £24bn in August 2020 during the pandemic and £12bn in August 2009 during the financial crisis.
Five months to August 2023
The provisional shortfall in taxes and other receipts compared with total managed expenditure for the five months to August 2023 was £70bn, £20bn more than the £50bn deficit reported for the first five months of 2022/23. This reflected a widening gap between tax and other receipts for the five months of £428bn and total managed expenditure of £498bn, up 7% and 10% respectively compared with April to August 2022.
Inflation benefited tax receipts for the first five months compared with the previous year, with income tax and VAT receipts both up 12% to £104bn and £84bn respectively. However, corporation tax was only up 13% to £37bn despite the increase in the corporation tax rate from 19% to 25% from 1 April 2023, and national insurance receipts were down by 3% to £71bn because of the abolition of the short-lived health and social care levy last year. Stamp duty on properties was down by £2bn or 29% to £6bn and the total for all other taxes was up just 3% to £82bn as economic activity slowed. Non-tax receipts were up 12% to £44bn, primarily driven by higher investment income.
Total managed expenditure of £428bn in the five months to August can be analysed between current expenditure excluding interest of £418bn (up £34bn or 9% over the same period in the previous year), interest of £61bn (up £6bn or 11%), and net investment of £19bn (up £7bn or 57%).
The increase of £34bn in current expenditure excluding interest compared with the prior year has been driven by a £14bn increase in benefit payments, £9bn in higher central government staff costs, £5bn in additional central government procurement spending and £5bn in energy support scheme costs, plus £1bn in net other changes.
The rise in interest costs of £6bn to £61bn reflects a £14bn increase in interest on non-inflation linked debt to £38bn as the Bank of England base rate rose, offset by an £8bn fall in the interest payable on index-linked debt to £23bn as inflation is running at a lower level than it was for the same period last year.
The £7bn increase in net investment spending to £15bn in the first five months of the current year reflects high construction cost inflation among other factors that saw an £8bn or 23% increase in gross investment to £44bn, less a £1bn increase in depreciation to £25bn.
Caution is needed with respect to the numbers published by the ONS, which are expected to be repeatedly revised as estimates are refined and gaps in the underlying data are filled.
The latest release saw the ONS revise the reported deficit for the four months to July 2023 up by £2bn as estimates of tax receipts and expenditure were updated for better data, and it also reduced the reported deficit for the 2022/23 financial year by £1bn to £128bn for methodology changes in addition to new data.
The methodology changes also saw small revisions in the reported deficits for previous periods back to 1999, most notably reductions of £1bn to the deficits in 2019/20 and 2020/21 and an increase of £2bn in the reported deficit for 2021/22.
Balance sheet metrics
Public sector net debt was £2,594bn at the end of August 2023, equivalent to 98.8% of GDP.
The debt movement since the start of the financial year was £56bn, comprising borrowing to fund the deficit for the five months of £70bn less £14bn in net cash inflows as loan repayments and positive working capital movements exceeded cash outflows for lending to students, business and others.
Public sector net debt is £779bn or 43% higher than it was on 31 March 2020, reflecting the huge sums borrowed since the start of the pandemic.
Public sector net worth, the new balance sheet metric launched by the Office for National Statistics this year, was -£618bn on 31 August 2023, comprising £1,604bn in non-financial assets, £1,038bn in non-liquid financial assets, £2,594bn of net debt (£339bn in liquid financial assets less public sector gross debt of £2,933bn) and other liabilities of £667bn. This is a £61bn deterioration from the -£557bn reported for 31 March 2023.
This new measure seeks to capture more assets and liabilities than the narrowly focused public sector net debt measure traditionally used to assess the financial position of the UK public sector. However, it excludes unfunded employee pension liabilities that amounted to over £2trn at 31 March 2021 according to the Whole of Government Accounts, although they are expected to be much lower today as discount rates have risen significantly since then.
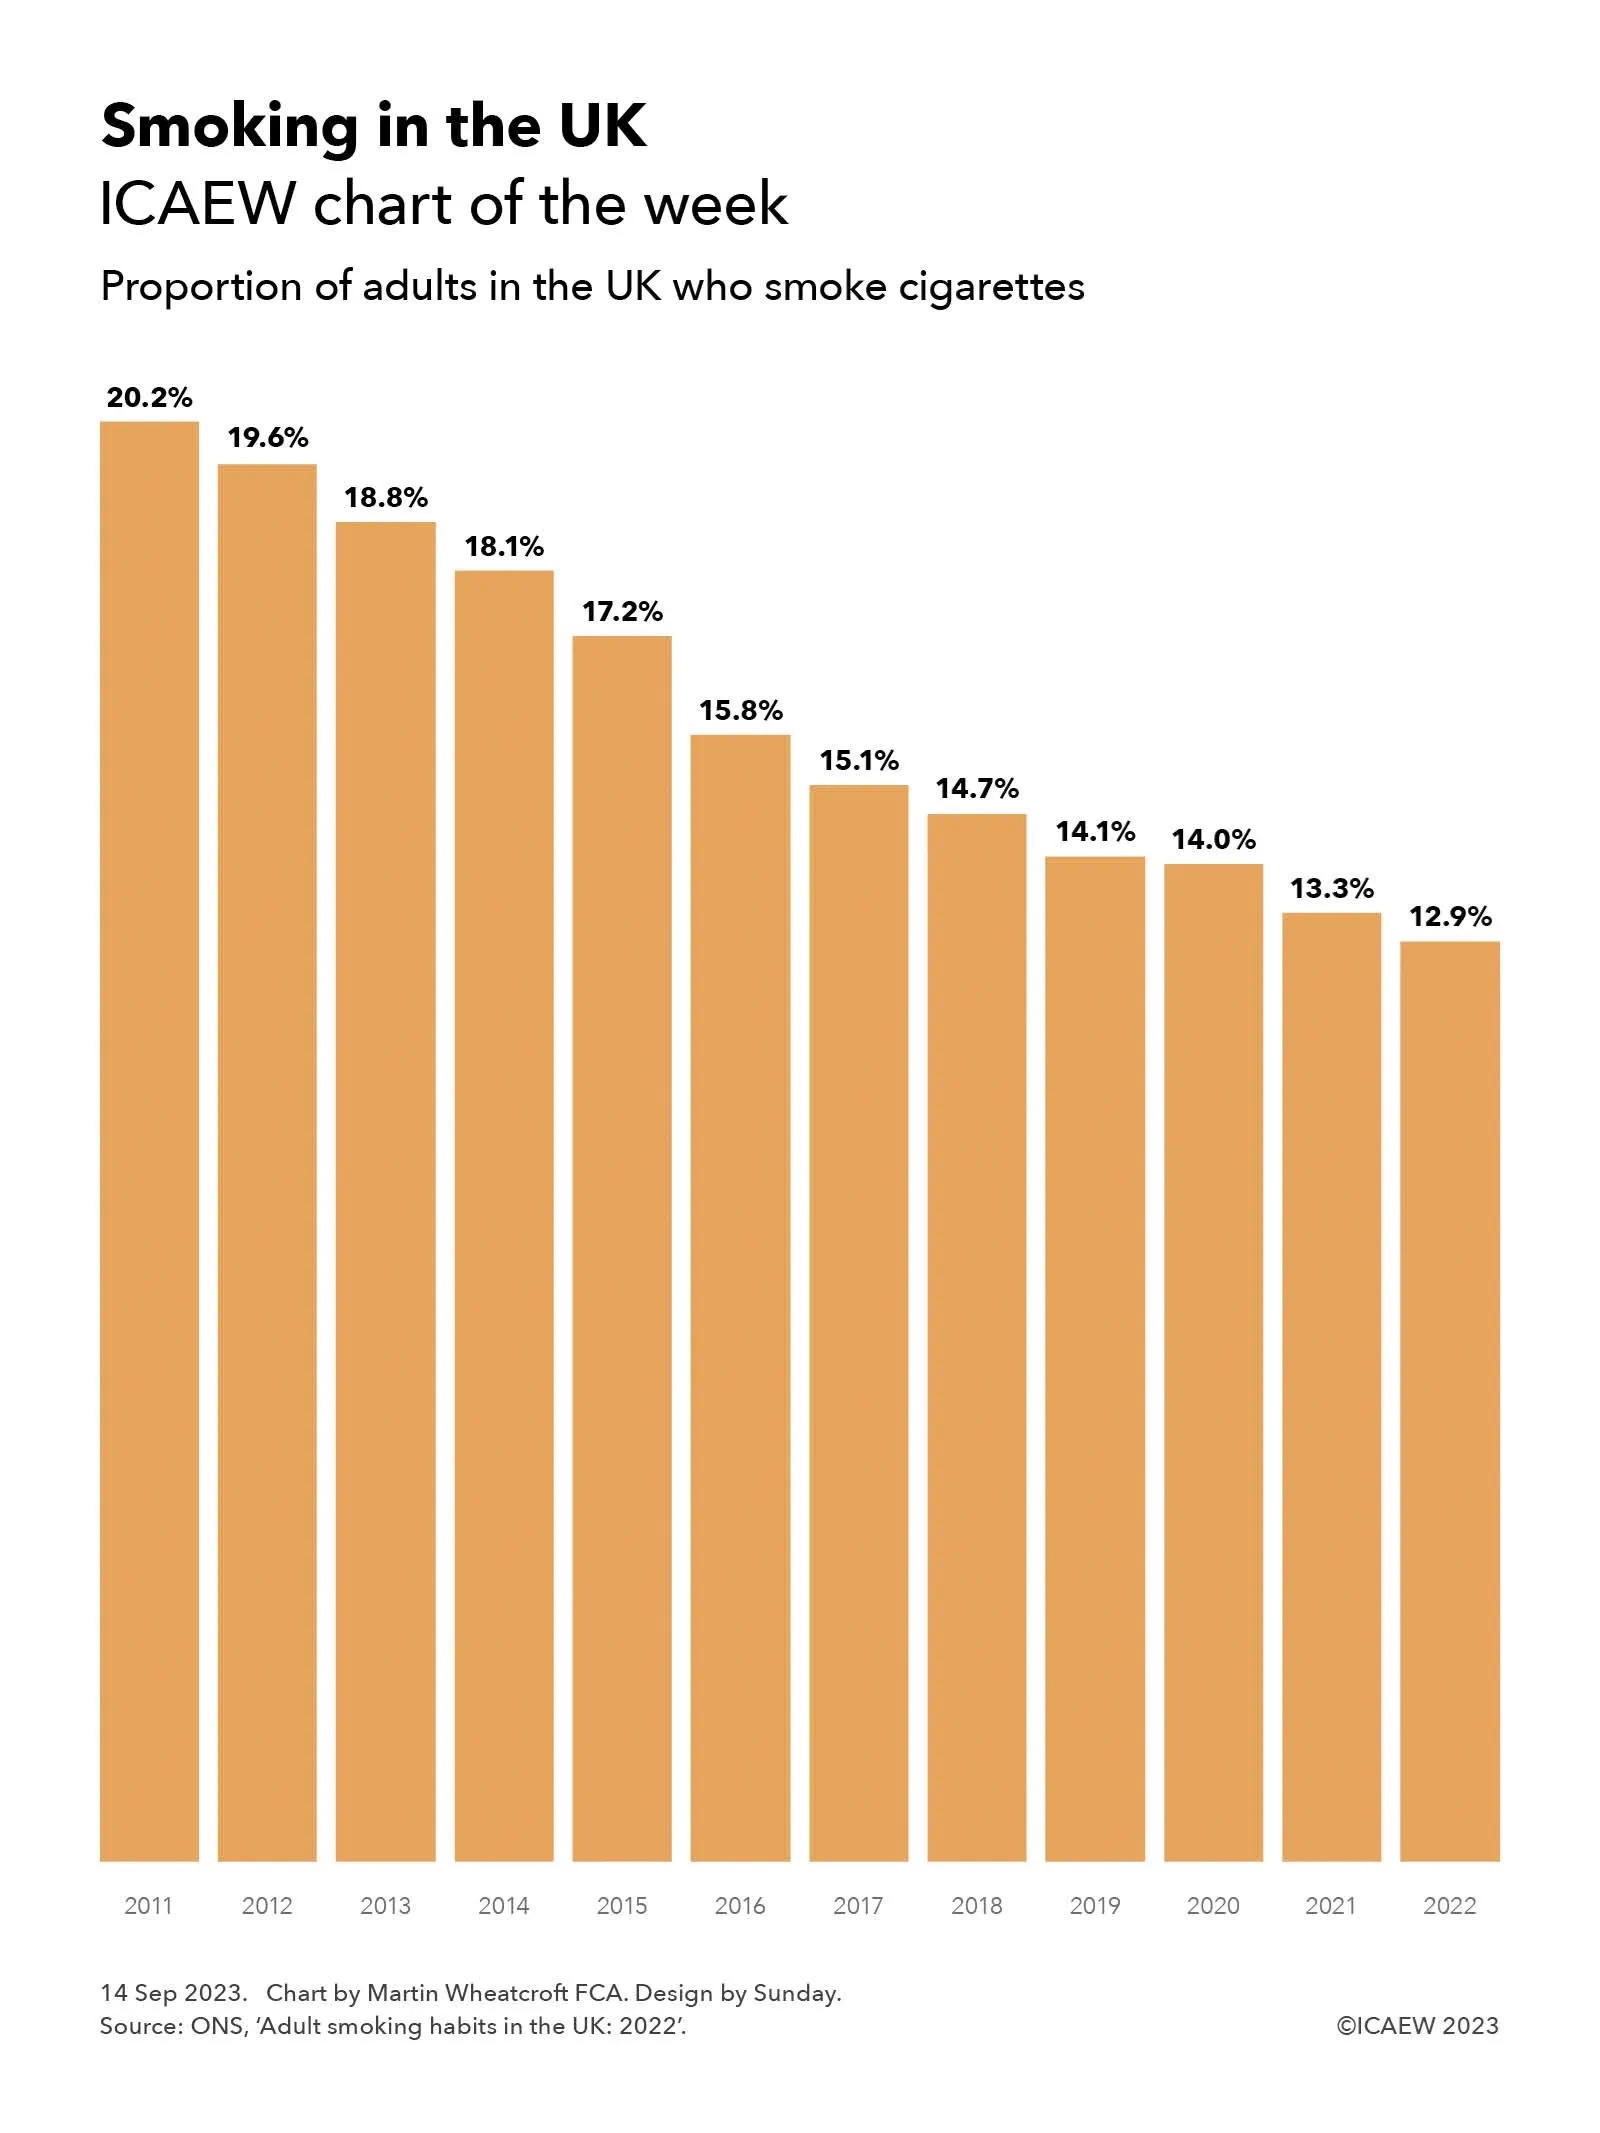
My chart of the week looks at how the prevalence of smoking in the UK population has continued to decline over the past decade.
The Office for National Statistics (ONS) has recently published its latest statistics on adult smoking habits in the UK, showing a continuing decline in the prevalence of smoking in the UK population over the past decade or so.
As my chart this week highlights, the proportion of those aged 18 or over in the UK who smoke cigarettes has fallen from 20.2% in 2011 to 19.6% (2012), 18.8% (2013), 18.1% (2014), 17.2% (2015), 15.8% (2016), 15.1% (2017), 14.7% (2018), 14.1% (2019), 14.0% (2020), 13.3% (2021) and 12.9% in 2022.
Over this period the decline is dramatic, with the respective proportion of men and women smoking down from 22.4% and 18.2% in 2011 to 14.6% and 11.2% in 2022.
The proportion of people smoking in all age groups has fallen over the past 11 years, with those aged 18-24, 25-34, 35-44, 45-54, 55-64 and 65+ who smoke declining from 25.7%, 25.8%, 23.3%, 21.6%, 18.5% and 10.2% in 2011 to 11.6%, 16.3%, 14.5%, 14.3%, 13.6% and 8.3% in 2022.
While the government and anti-smoking campaigners will be pleased by the continued progress in persuading people to give up smoking, they will be more concerned by the increase in the numbers vaping, particularly among those in their late teens and early 20s.
The proportion of those aged 16 or over in Great Britain who use e-cigarettes on a daily or occasional basis increased from 6.4% in 2020 to 8.7% in 2022. For those aged 16-24, 25-34, 35-49, 50-59 and 60+ the increase was from 7.0%, 8.6%, 7.5%, 7.9% and 3.5% in 2020 to 15.5%, 10.6%, 9.5%, 8.5%, 4.4% in 2022. (These percentages are not properly comparable with the smoking statistics as they are for a different comparator period, include those aged 16 and 17, are for different age bands, and exclude Northern Ireland.)
The continued decline in smoking has had a consequent impact on tobacco duty as despite a 70% rise in tobacco duty rates between 2011 and 2022, the amount collected has declined from £9.9bn in 2011/12 to £9.4bn in 2022/23, a drop in cash terms of 5% and in real terms of 26%.
This week’s chart takes a look at recent revisions to GDP that have caused some consternation in the world of statistics.
Each year the Office for National Statistics (ONS) publishes the ‘Blue Book’ on the national accounts, its definitive analysis of economic activity over the course of the previous year. This analysis supersedes the preliminary and revised monthly and quarterly estimates issued up until that point, based on extensive analysis by the official statisticians.
The 2023 edition of the Blue Book is scheduled to be published on 31 October 2023. It will be eagerly pored over by economists in and outside government who will be eager to understand how the UK economy performed during 2022, and how this ‘final’ version of the 2022 numbers line up with those preliminary and revised estimates, just as they did last year when looking at GDP for 2021.
However, in the world of statistics numbers are never final. On 1 September 2023, the ONS announced methodological and data improvements to last year’s Blue Book – the numbers for 2021 and earlier years. These prior-period adjustments partly reflected a methodology change in the way the three different methods of calculating GDP (output, income and expenditure) are reconciled, but much more significant were revisions to the data used to calculate some of the key statistics, causing much wailing and gnashing of teeth by some prominent economic commentators as the narrative around the UK’s emergence from the pandemic changed.
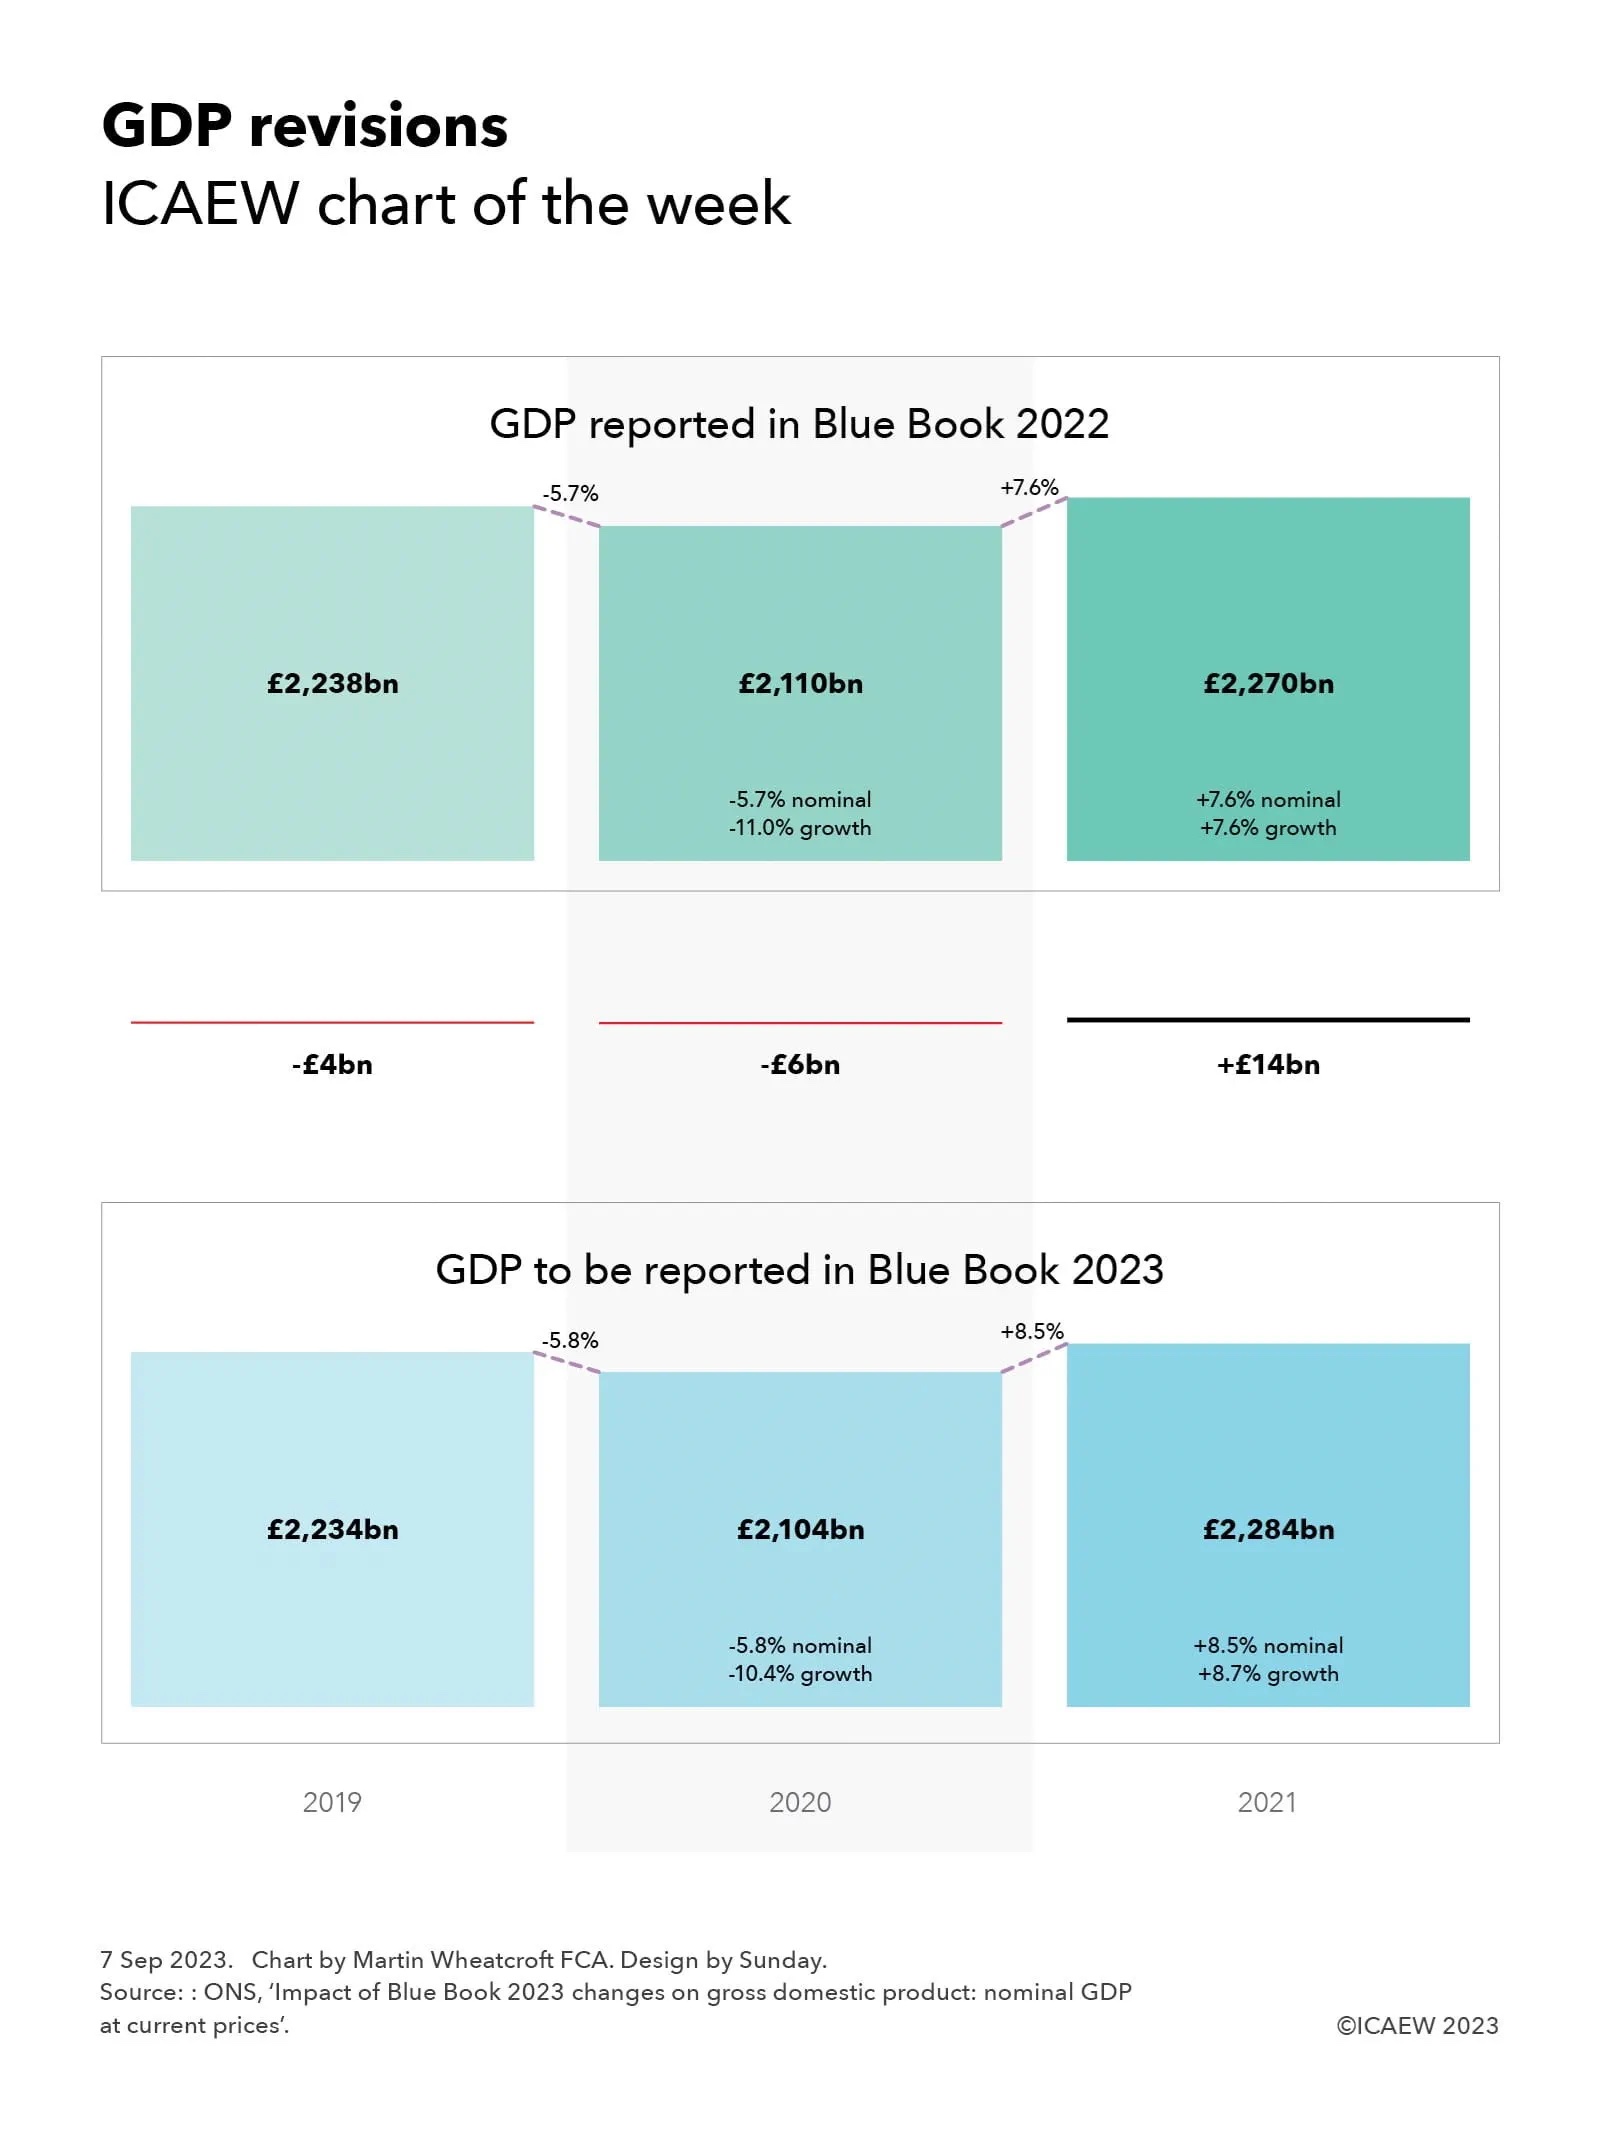
As our chart this week illustrates, the revisions to GDP do not at first sight appear to be that significant. GDP for 2019 has been revised down by £4bn from the previously reported £2,238bn to a new official number of £2,234bn; GDP for 2020 is £6bn down from £2,110bn to £2,104bn; and GDP for 2021 has been revised up by £14bn from £2,270bn to £2,284bn. These seem relatively small changes when looking at trillions of pounds of economic activity.
Where the change really has an impact is in looking at the trends, especially after adjusting for inflation. On a nominal basis, a 5.7% nominal decrease in 2020 followed by a 7.6% increase in 2021 has changed to a 5.8% decrease and an 8.5% increase, but in real terms the previously reported economic contraction of 11.0% in 2020 followed by a 7.6% recovery has changed to a smaller contraction of 10.4% followed by a stronger recovery of 8.7%.
Of course, the devil is in the detail and some of the revisions at an industry level have been much more dramatic, with wholesalers and retailers now believed to have grown more strongly than previously believed, while the iron and steel industry changed from growth to contraction.
Many economic commentators have focused on the change in quarterly GDP (not shown in the chart) where the arithmetical changes have been more pronounced. The movement from the fourth quarter of 2019 (previously £568bn, now £566bn) and the fourth quarter for 2021 (previously £593bn, now £597bn) has gone from a 4.4% increase over two years to a 5.5% increase; in real terms from a 1.2% contraction in the economy to growth of 0.7%. Still anaemic, but at least in positive territory.
Despite this small improvement in the economic story portrayed by the GDP statistics, we should not get too carried away. Economic growth remains well below the pre-financial crisis levels and the public finances are in a significantly worse state than they were back in 2008.
In the meantime, the Office for Statistics Regulation has commenced a review into how these small revisions with big implications for our understanding of the economy were not identified at the time.
My submission makes one major point about the UK government not comprehensively collecting and utilising financial data that is routinely produced by 10,000 or so public bodies in the UK, as well as other points around the availability of administrative data and the quality of spreadsheet design in communicating many statistics.
The ICAEW chart of the week returns from its summer holidays to look at the planned expansion of BRICS from five to 11 countries.
“The BRICs” was originally coined by Jim O’Neill in 2001 as an abbreviation for Brazil, Russia, India and China, four fast-growing economies that he predicted would come to dominate the world economy.
This investment shorthand evolved into something more substantive in 2006 when ministers from the four countries got together on the sidelines of a meeting at the UN. Leader summits started in 2009, followed by the addition of South Africa in 2011, which resulted in the capitalisation of the final ‘s’ to form BRICS.
BRICS has developed over time to become a counterweight to the G7, providing an alternative forum for leaders of these five major nations to discuss common concerns such as economic development, currency stability, climate change, and tackling drug trafficking and organised crime. BRICS has been increasingly important to Russia since its ejection from the G7 (then the G8) following its invasion of Crimea in 2014 and to China as relations with the G7 have deteriorated over the last decade.
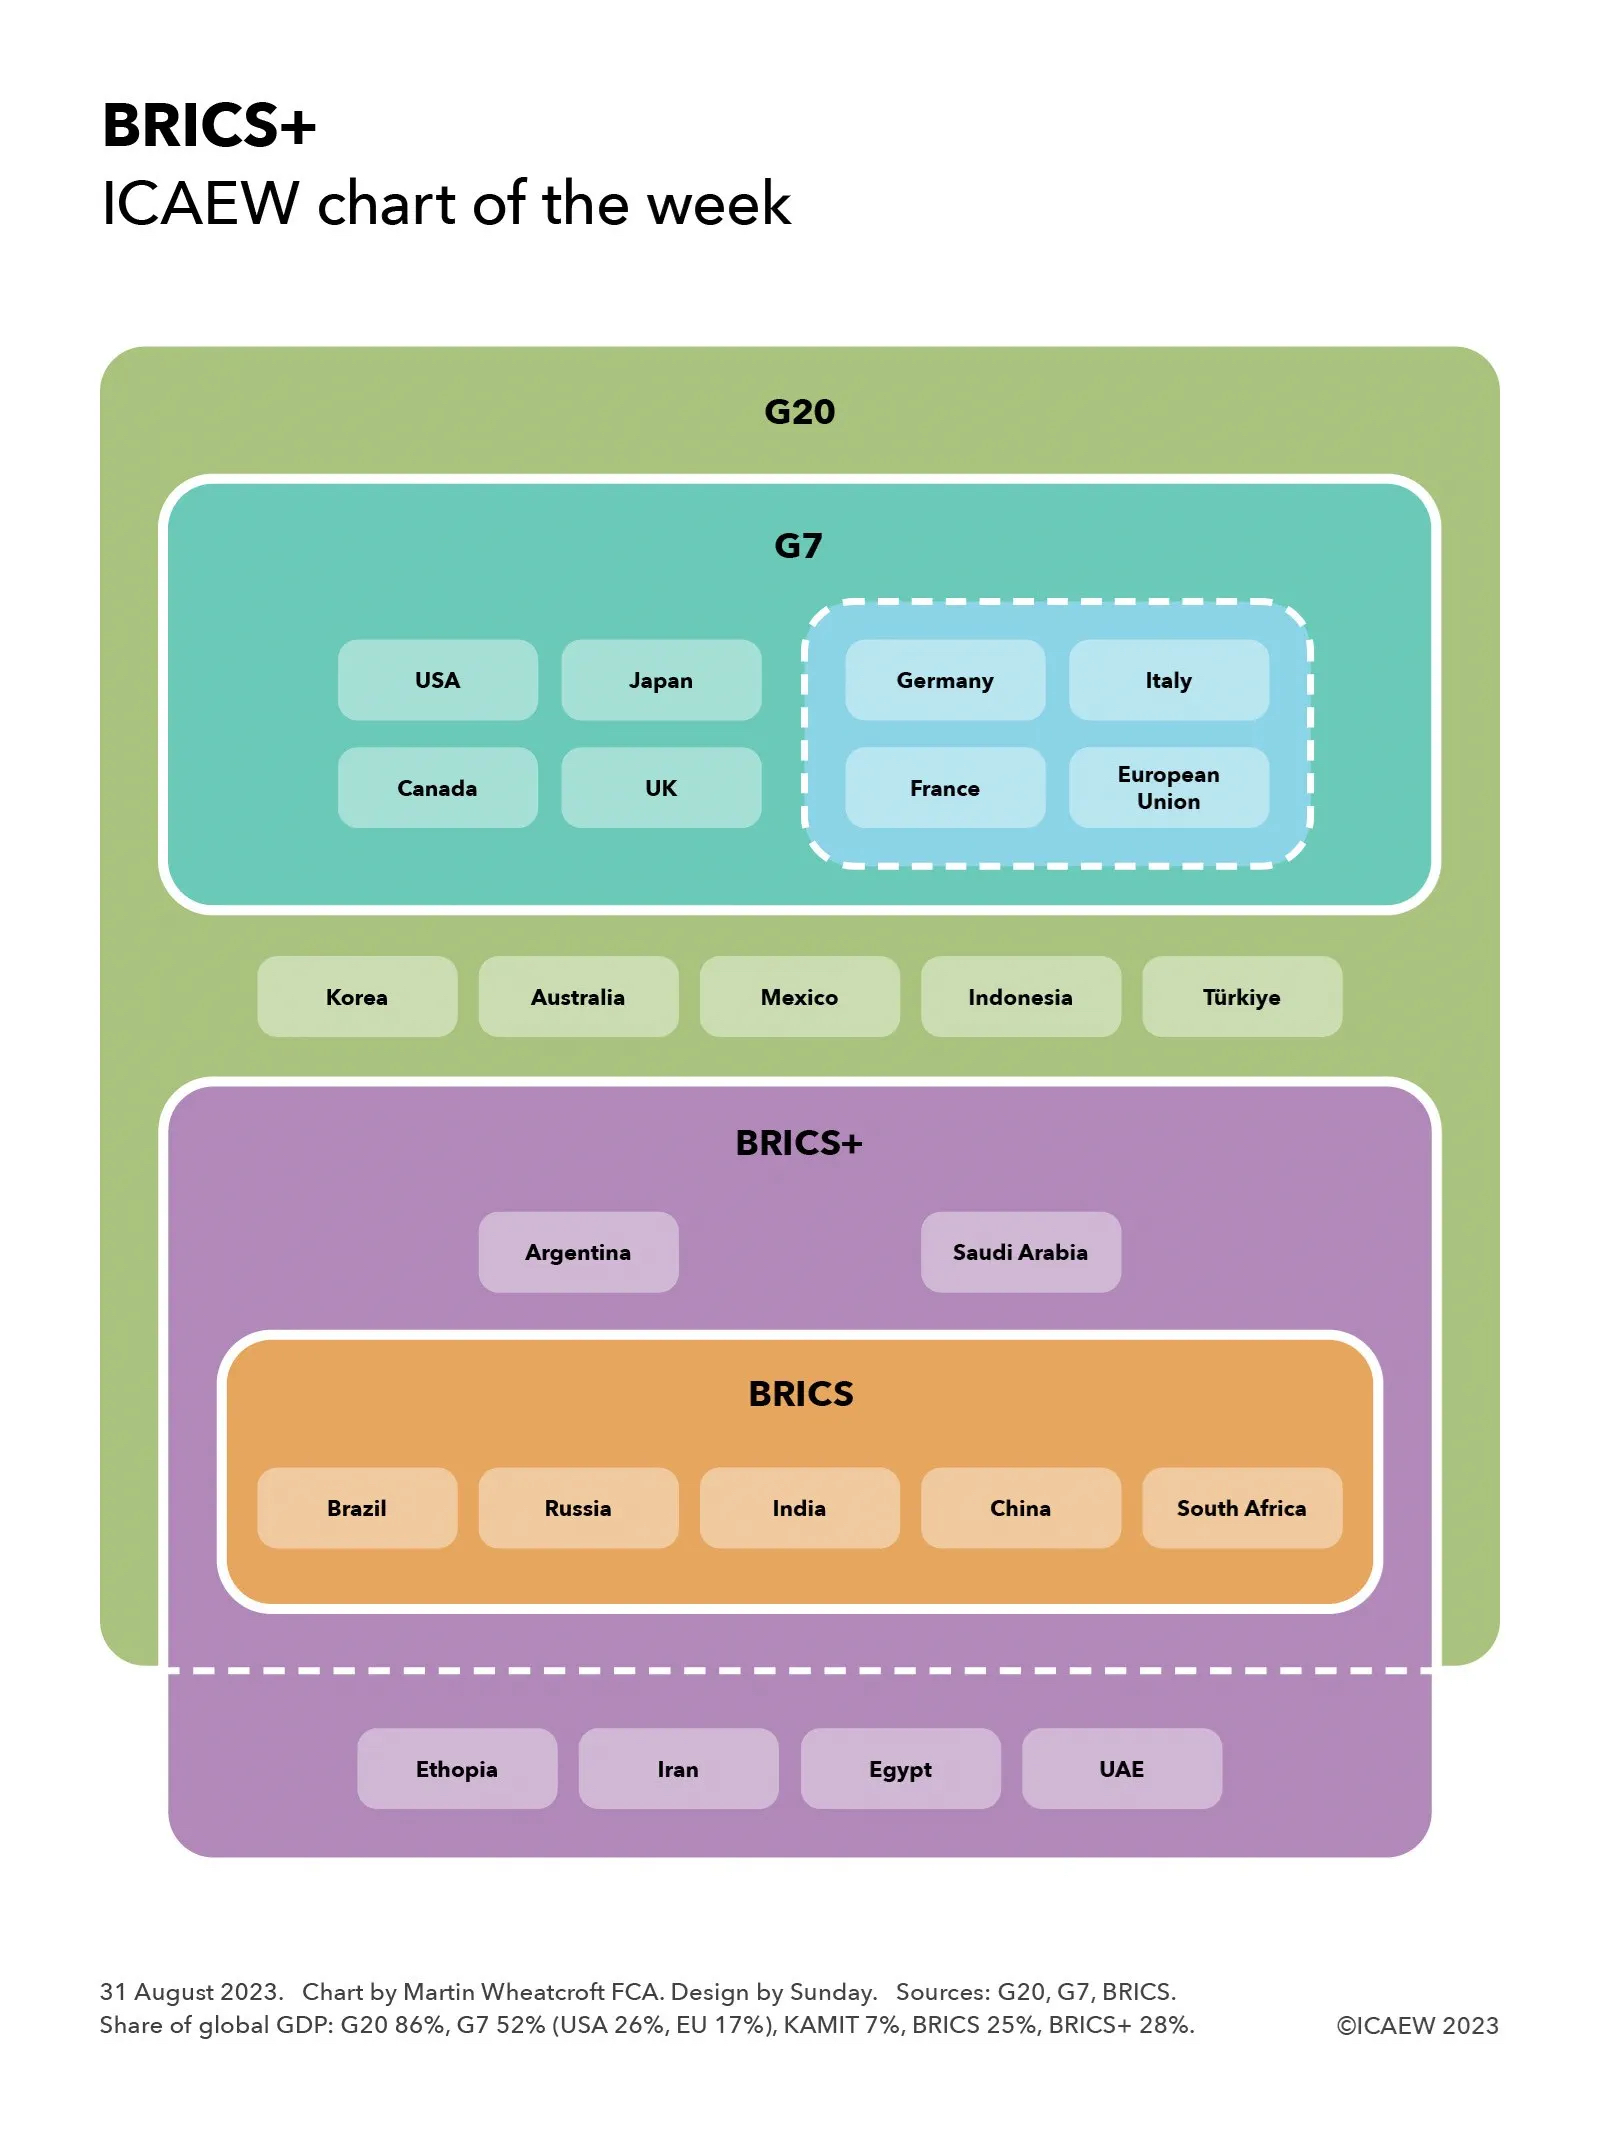
Our chart this week takes the form a Venn diagram to illustrate how BRICS, and the expanded “BRICS+” grouping (pending a new official name), fit with two other major intergovernmental organisations where leaders meet on a regular basis – the G7 and the G20.
It starts with the G20, a grouping of 19 nations and the European Union that together represent 86% of the global economy. Within this sit the eight members of the G7 group of advanced economies, representing 52% of the global economy: the USA (26%), Japan (4%), the UK (3%), Canada (2%), Germany (4%), France (3%), Italy (2%) and the European Union (17% including Germany, France and Italy). The five BRICS nations represent 25% of the global economy comprising: Brazil (2%), Russia (1.7%), India (4%), China (17%) and South Africa (0.4%).
The diagram is complicated by the expanded BRICS+ as although invitees Argentina (0.6%) and Saudi Arabia (1.0%) are also members of the G20, the other four new members – Ethiopia (0.2%), Iran (0.3%), Egypt (0.3%) and the United Arab Emirates (0.5%) – are outside the G20. These new members together represent 3% of the global economy, taking the expanded BRICS+ to 28%.
Squeezed between the G7 and BRICS+ are five G20 members that together make up around 7% of the global economy that are not in either grouping, being (South) Korea (1.6%), Australia (1.6%), Mexico (1.8%), Indonesia (1.4%) and Türkiye (0.8%). As yet there is no sign of an intergovernmental organisation for these “KAMIT” nations to complement the G7 and BRICS, although in practice they are often invited as guests to G7 summits in addition to their participation in meetings of the G20.
The attraction of intergovernmental forums such as the G7, BRICS and the G20 is that they enable national leaders to engage directly with their counterparts on a wide range of topics, in contrast to the often narrower focus and more formal diplomatic structures of treaty-based international organisations such as the Organisation for Economic and Co-operation Development (OECD), the World Bank or the Organisation of American States (OAS) for example.
Their informal nature gives national leaders more flexibility to (for example) change their memberships without lengthy treaty negotiations or to work together on pressing issues of mutual concern. However, that informality also makes it difficult to create binding resolutions, which is perhaps why the global alternative reserve currency proposed at the first BRICS summit in 2009 had still not been implemented by the time of the 15th summit this August.
Higher self-assessment tax receipts and end of energy support payments help improve what is otherwise a disappointing set of numbers.
The monthly public sector finances for July 2023 were released by the Office for National Statistics (ONS) on Tuesday 22 August 2023. These reported a provisional deficit for the fourth month of the 2023/24 financial year of £4bn, bringing the total deficit for the four months to £57bn, £14bn more than in the first third of the previous year.
Alison Ring OBE FCA, Public Sector and Taxation Director for ICAEW, said: “These numbers reflect a mixed set of results for the first four months of the financial year, as higher self assessment tax receipts and the end of energy price guarantee support payments led to an improved fiscal situation in July. But debt remains on track to hit £2.7trn by the end of the year, up from £1.8trn before the pandemic, adding to the scale of the challenge facing the government and taxpayers in repairing the public finances.
“Stubbornly high core inflation and the prospect of further interest rate rises will concern the Chancellor as he bears down on public spending in the hope of freeing up the money he needs to both pay for the state pension triple-lock and find room for pre-election tax cuts.”
Month of July 2023
The provisional shortfall in taxes and other receipts compared with total managed expenditure for the month of July 2023 was £4bn, being tax and other receipts of £93bn less total managed expenditure of £97bn, up 5% and 9% respectively compared with July 2022.
This was the fifth-highest July deficit on record since monthly records began in 1993, despite being a £3bn improvement over July 2022, driven by higher self assessment tax receipts and the end of payments under the energy price guarantee.
Four months to July 2023
The provisional shortfall in taxes and other receipts compared with total managed expenditure for the four months to July 2023 was £57bn, £14bn more than the £43bn deficit reported for the first third of the previous financial year (April to July 2022). This reflected a widening gap between tax and other receipts for the four months of £343bn and total managed expenditure of £400bn, up 7% and 10% respectively compared with April to July 2022.
Inflation benefited tax receipts for the four months, with income tax up 13% to £85bn and VAT up 9% to £65bn. The rise in corporation tax, up 17% to £30bn, reflected both inflation and the increase in the corporation tax rate to 25% from 1 April 2023. However, national insurance receipts were down by 3% to £57bn because of the abolition of the short-lived health and social care levy last year, while the total for all other taxes was down by 1% to £69bn as economic activity slowed. Other receipts were up 17% to £37bn, driven by higher investment income.
Total managed expenditure of £400bn in the four months to July can be analysed between current expenditure excluding interest of £334bn (up £26bn or 8% over the same period in the previous year), interest of £51bn (up £7bn or 16%), and net investment of £15bn (up £4bn or just over a third).
The increase of £26bn in current expenditure excluding interest compared with the prior year has been driven by £11bn from the uprating of benefit payments, £8bn in higher central government staff costs, £3bn in central government procurement and £5bn in energy support scheme costs, less £1bn in net other changes.
The rise in interest costs of £7bn to £51bn reflects a fall in the interest payable on index-linked debt of £6bn from £30bn to £24bn as inflation has moderated compared with the same period last year, combined with a £13bn increase in interest on non-inflation linked debt from £14bn to £27bn as the Bank of England base rate rose.
The £4bn increase in net investment spending to £15bn in the first four months of the current year reflects high construction cost inflation among other factors that saw a £5bn or 17% increase in gross investment to £35bn, less a £1bn increase in depreciation to £20bn.
Public sector finance trends: July 2023
Four months to
Jul 2019 (£bn)
Jul 2020 (£bn)
Jul 2021 (£bn)
Jul 2022 (£bn)
Jul 2023 (£bn)
Receipts
270
234
282
320
343
Expenditure
(259)
(348)
(310)
(308)
(334)
Interest
(24)
(15)
(23)
(44)
(51)
Net investment
(10)
(26)
(13)
(11)
(15)
Deficit
(23)
(155)
(64)
(43)
(57)
Other borrowing
4
(66)
(22)
5
10
Debt movement
(19)
(221)
(86)
(38)
(47)
Net debt
1,796
2,036
2,239
2,420
2,579
Net debt / GDP
80.1%
96.9%
97.7%
96.6%
98.5%
Source: ONS, ‘Public sector finances, July 2023’.
Caution is needed with respect to the numbers published by the ONS, which are expected to be repeatedly revised as estimates are refined and gaps in the underlying data are filled. The latest release saw the ONS revise the reported deficit for the three months to June 2023 down by £2bn as estimates of tax receipts and expenditure were updated for better data, as well as reduce the reported deficit for the 2022/23 financial year by £1bn from £132bn to £131bn for similar reasons. The ONS also revised its estimates of GDP for more recent economic data, resulting in a lower reported net debt / GDP ratio.
Balance sheet metrics
Public sector net debt was £2,579bn at the end of July 2023, equivalent to 98.5% of GDP.
The debt movement since the start of the financial year was £47bn, comprising borrowing to fund the deficit for the four months of £57bn plus £10bn in net cash inflows as loan repayments and positive working capital movements exceeded cash outflows for lending to students, business and others.
Public sector net debt is £764bn or 42% higher than it was on 31 March 2020, reflecting the huge sums borrowed since the start of the pandemic.
Public sector net worth, the new balance sheet metric launched by the Office for National Statistics this year, was -£631bn on 31 July 2023, comprising £1,604bn in non-financial assets, £1,011bn in non-liquid financial assets and £336bn in liquid financial assets less public sector gross debt of £2,915bn and other liabilities of £667bn. This is a £54bn deterioration from the -£577bn reported for 31 March 2023.
This new measure seeks to capture more assets and liabilities than the narrowly focused public sector net debt measure traditionally used to assess the financial position of the UK public sector. However, it excludes unfunded employee pension liabilities that amounted to more than £2trn at 31 March 2021 according to the Whole of Government Accounts, although they are expected to be much lower today as discount rates have risen significantly since then.
ICAEW welcomes proposed statutory guidance that establishes a corporate governance code for local authorities in England, but says councillors need better training and support if they are to be able to hold leaders to account.
Financial collapses and major stresses in local government finances have led the government to undertake a major rewrite of the applicable statutory guidance, in effect establishing a corporate governance code for local authorities in England.
The government is introducing the new guidance in response to a series of high-profile collapses of local authorities in England in which governance failures were identified as a common feature, as well as an increasing number of local authorities reporting that they are in financial difficulty or at risk of being so.
Local authorities in Thurrock, Woking and Croydon are together estimated to have lost local and national taxpayers in excess of £1bn, with their communities adversely affected by significant cuts to local public services and higher council tax bills. Central government has also stepped in to provide additional funding and loans, some of which are unlikely ever to be repaid.
The proposed guidance technically relates to the ‘best value duty’, a legal obligation placed on specified public sector bodies, including local authorities, to have arrangements in place to secure continual improvement in how they carry out their work. Relevant public bodies are required to have regard to any statutory guidance issued by the government in deciding how they comply with this duty.
As the proposed guidance acknowledges, meeting the best value duty will only be possible if councils have adequate governance arrangements in place. It goes on to set out a series of characteristics of well-functioning authorities, as well as indicators of potential failure, covering continuous improvement, leadership, governance arrangements, culture, use of resources, service delivery, and partnerships and community engagement.
Accountability is not accidental
ICAEW has suggested a need for accountability events. These should include a formal presentation on financial performance and position each year by leaders and officers to councillors within four months of the end of the financial year, and proper consideration and adoption by full council of the annual financial report once the external audit is completed. The latter should cover the financial statements and accompanying narrative reports on financial performance and position, audit reports, and statements on governance arrangements; regard for the statutory guidance on best value duty; and responsibilities for the preparation of the financial statements and internal financial control.
ICAEW has recommended a ‘comply or explain’ approach when local authorities report on how they have had regard to the guidance. This would provide clarity on how local authorities have set about applying the guidance, where they have chosen to diverge, and where they have been unable to comply.
A feature of recent failures has been inadequate accountability, with councillors not being properly equipped to hold leaders and officers to account for unwise debt-leveraged investment strategies, poor individual financial decisions, and inadequate governance arrangements. In most cases councillors were not fully aware or did not fully understand the scale of the risks that were being assumed and the consequent financial implications for their local communities. ICAEW’s response stresses that councillors need sufficient training, information and support to undertake this role.
The proposed guidance stresses the importance of good governance and strong financial management, providing a useful framework for local authorities in how they set about ensuring they have appropriate governance arrangements in place.
However, the proposed guidance does not make it clear that performance management should include monitoring and management of the balance sheet and financial risks, a feature that was missing in recent local authority failures that saw debt-leveraged investments significantly increase balance sheet risk.
ICAEW’s response also highlights the role that internal audit can play in assuring governance arrangements are in place, while noting that local councillor codes of conduct will need to be updated to reflect the new guidance.
The role of the audit committee is extremely important to an effective system of governance, and ICAEW calls for the government to legislate, as promised, to require independent members of local authority audit committees.
Alison Ring OBE FCA, ICAEW Director for Public Sector and Taxation, commented:
“We are very pleased that the government has recognised the need for a corporate governance code for local government in the form of new statutory guidance on the best value duty. This is particularly welcome in the light of recent financial collapses at Thurrock, Woking and Croydon that together have cost local and national taxpayers in excess of £1bn, as well as increasing levels of financial stress on local authorities across England.
“We believe that accountability does not happen by accident. There is a need for regular accountability events covering financial performance and the annual financial report as well as budgets, for a ‘comply or explain’ approach to reporting on how the best value duty guidance has been implemented, and for councillors to be properly equipped with the training, information and support they need to hold leaders and officers to account.
“Good governance is essential if local authorities in the UK are to ensure they obtain value for the more than £200bn of public money they spend each year on our behalf.”