26 February 2021: The Chancellor needs to build a bridge to economic recovery in his first Budget on Wednesday, focusing on jobs, exports and investment. But with the OBR’s official projections showing public debt to be on an unsustainable path, what vision will he set out for the public finances in the long-term?
The Spring Budget announcement on Wednesday will primarily be about the government’s fiscal budget for the financial year commencing 1 April 2021. The UK is still in the midst of a major health emergency and in a difficult economic situation, and the announcement is likely to provide for an extension of support measures for businesses and individuals affected by the pandemic, funding for under-pressure public services and stimulus measures to drive economic growth once restrictions are lifted, particularly in the second half of the financial year.
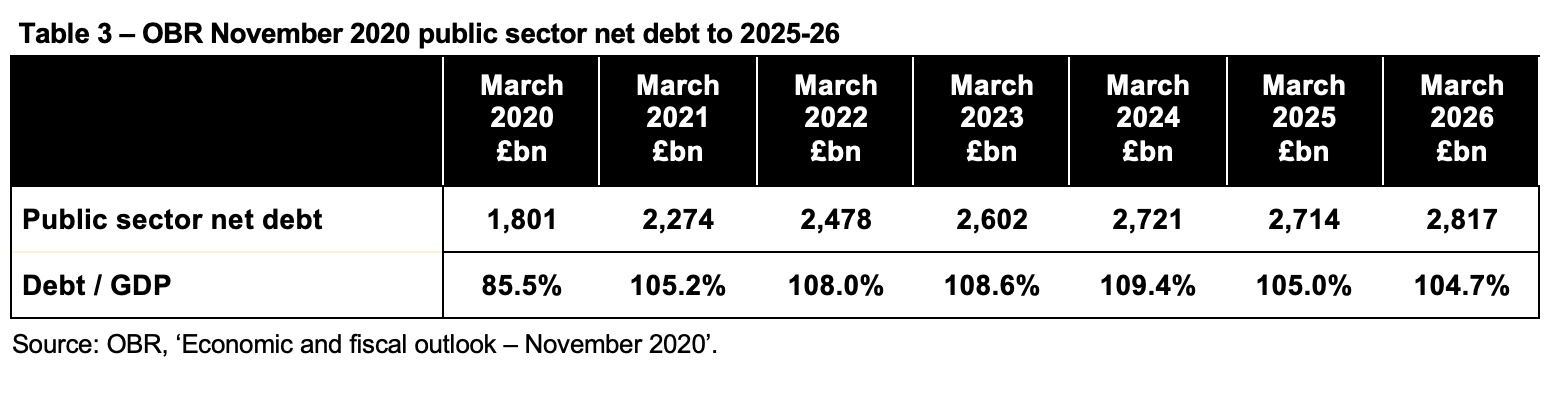
In the absence of a formal fiscal strategy event in the Parliamentary calendar, the Budget is also the main forum the Chancellor has to discuss the medium and long-term prospects for the public finances. This includes considering the five-year fiscal forecasts prepared by the Office for Budget Responsibility (OBR), as well as setting out any medium-term fiscal rules the government might want to use in determining its tax and spending plans and in demonstrating financial credibility with debt investors and citizens.
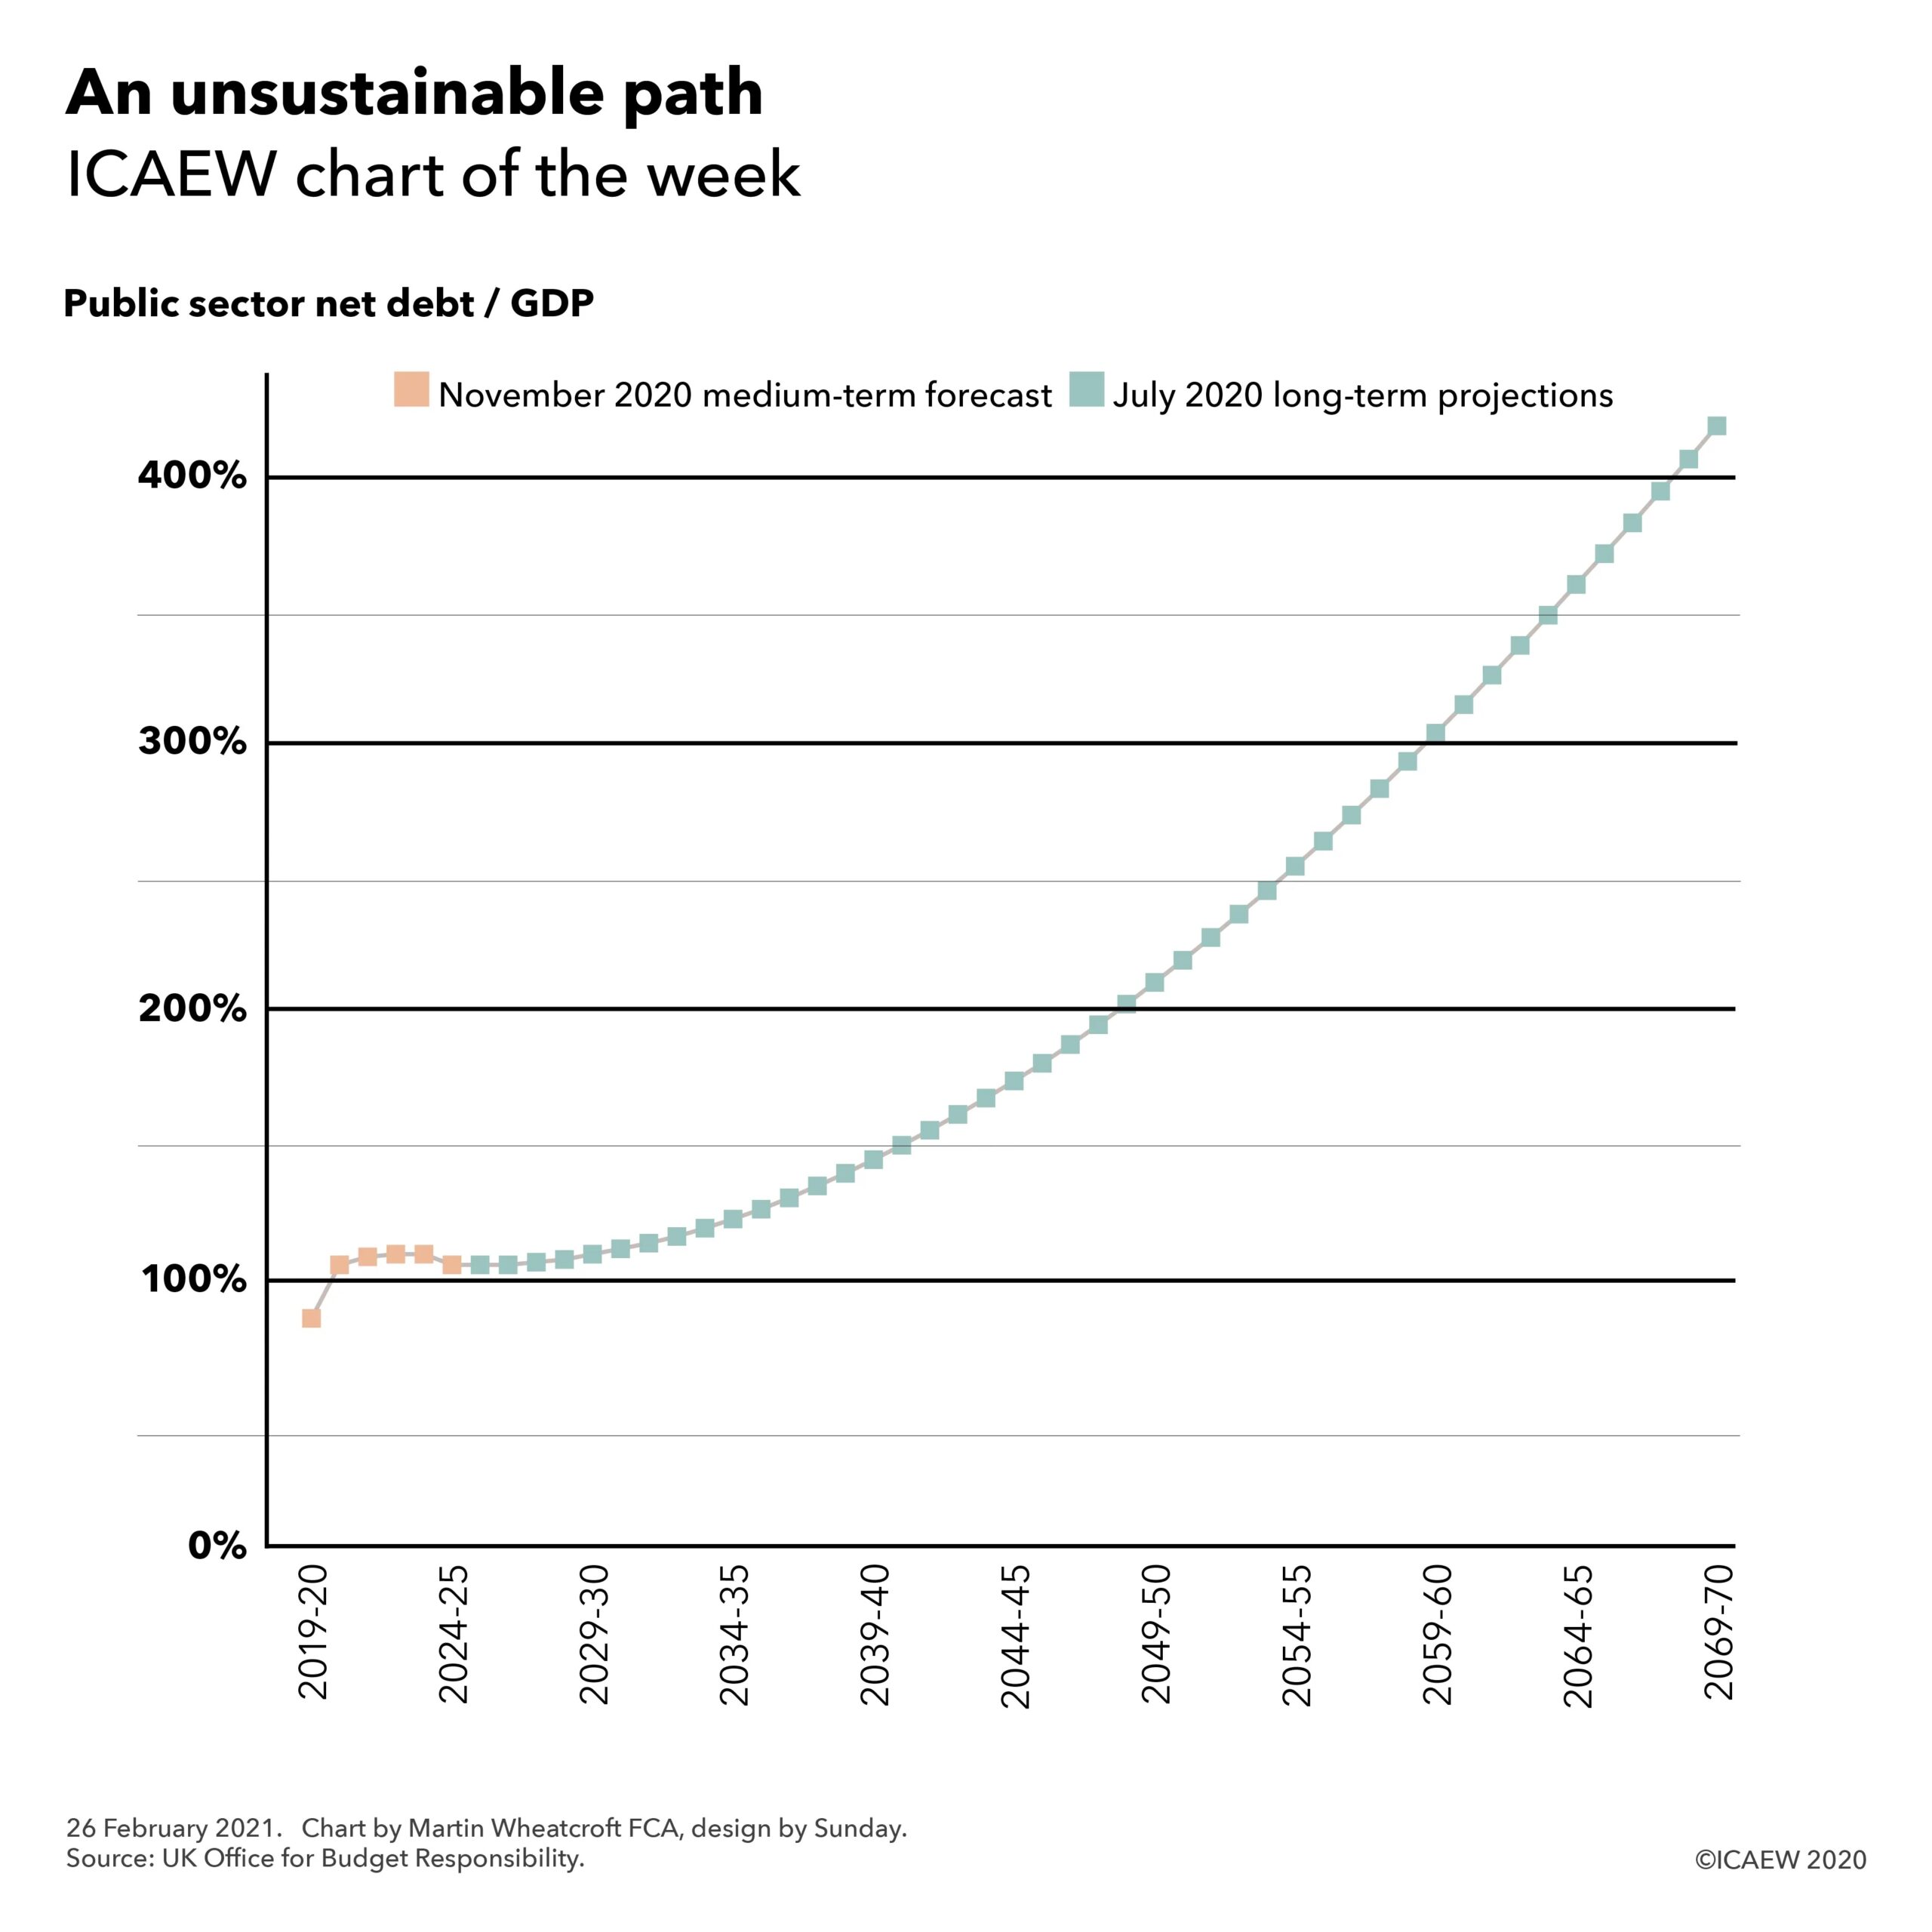
What is often less discussed is the long-term path for the public finances, which – as the #icaewchartoftheweek illustrates – is on an unsustainable path according to the official 50-year fiscal projections prepared by the OBR last July.
These projections indicate that, in the absence of government action, public debt will rise steadily over the next fifty years as public spending grows in line with anticipated demand, and increasing amounts of borrowing will be needed to cover the shortfall between that spending and the amount collected in taxes. It is important to understand that these projections were already on this path before the pandemic arrived and the principal difference between the OBR’s 2020 and 2018 projections is that the initial level of debt has increased from in the order of 80% to just over 100% of GDP. The starting point may be higher, but the fundamental issues haven’t changed.
This financial backdrop permeates every Budget and is the reason the Chancellor finds himself constrained in the choices he can make, despite ultra-low interest rates that currently permit him to borrow huge sums for one-off expenditures at almost no cost. He doesn’t have the same freedom when it comes to permanent increases in spending, whether that be on health, social care, welfare, education, defence or other public services, especially if he wants to minimise the scale of any potential tax increases. Of course, higher economic growth would help – but as successive Chancellors have found that is not so easy to deliver.
So while much of the focus on the Budget on Wednesday will be on the short-term extension of the life support package for individuals and businesses while restrictions remain in place and the economic stimulus thereafter, the Chancellor’s words will also be scrutinised for his vision on the direction of travel for the public finances beyond the end of the next financial year.