ICAEW chart of the week: Council tax in England 2026/27

My chart for ICAEW this week celebrates the start of a new financial year by looking at the average level of council tax across England.
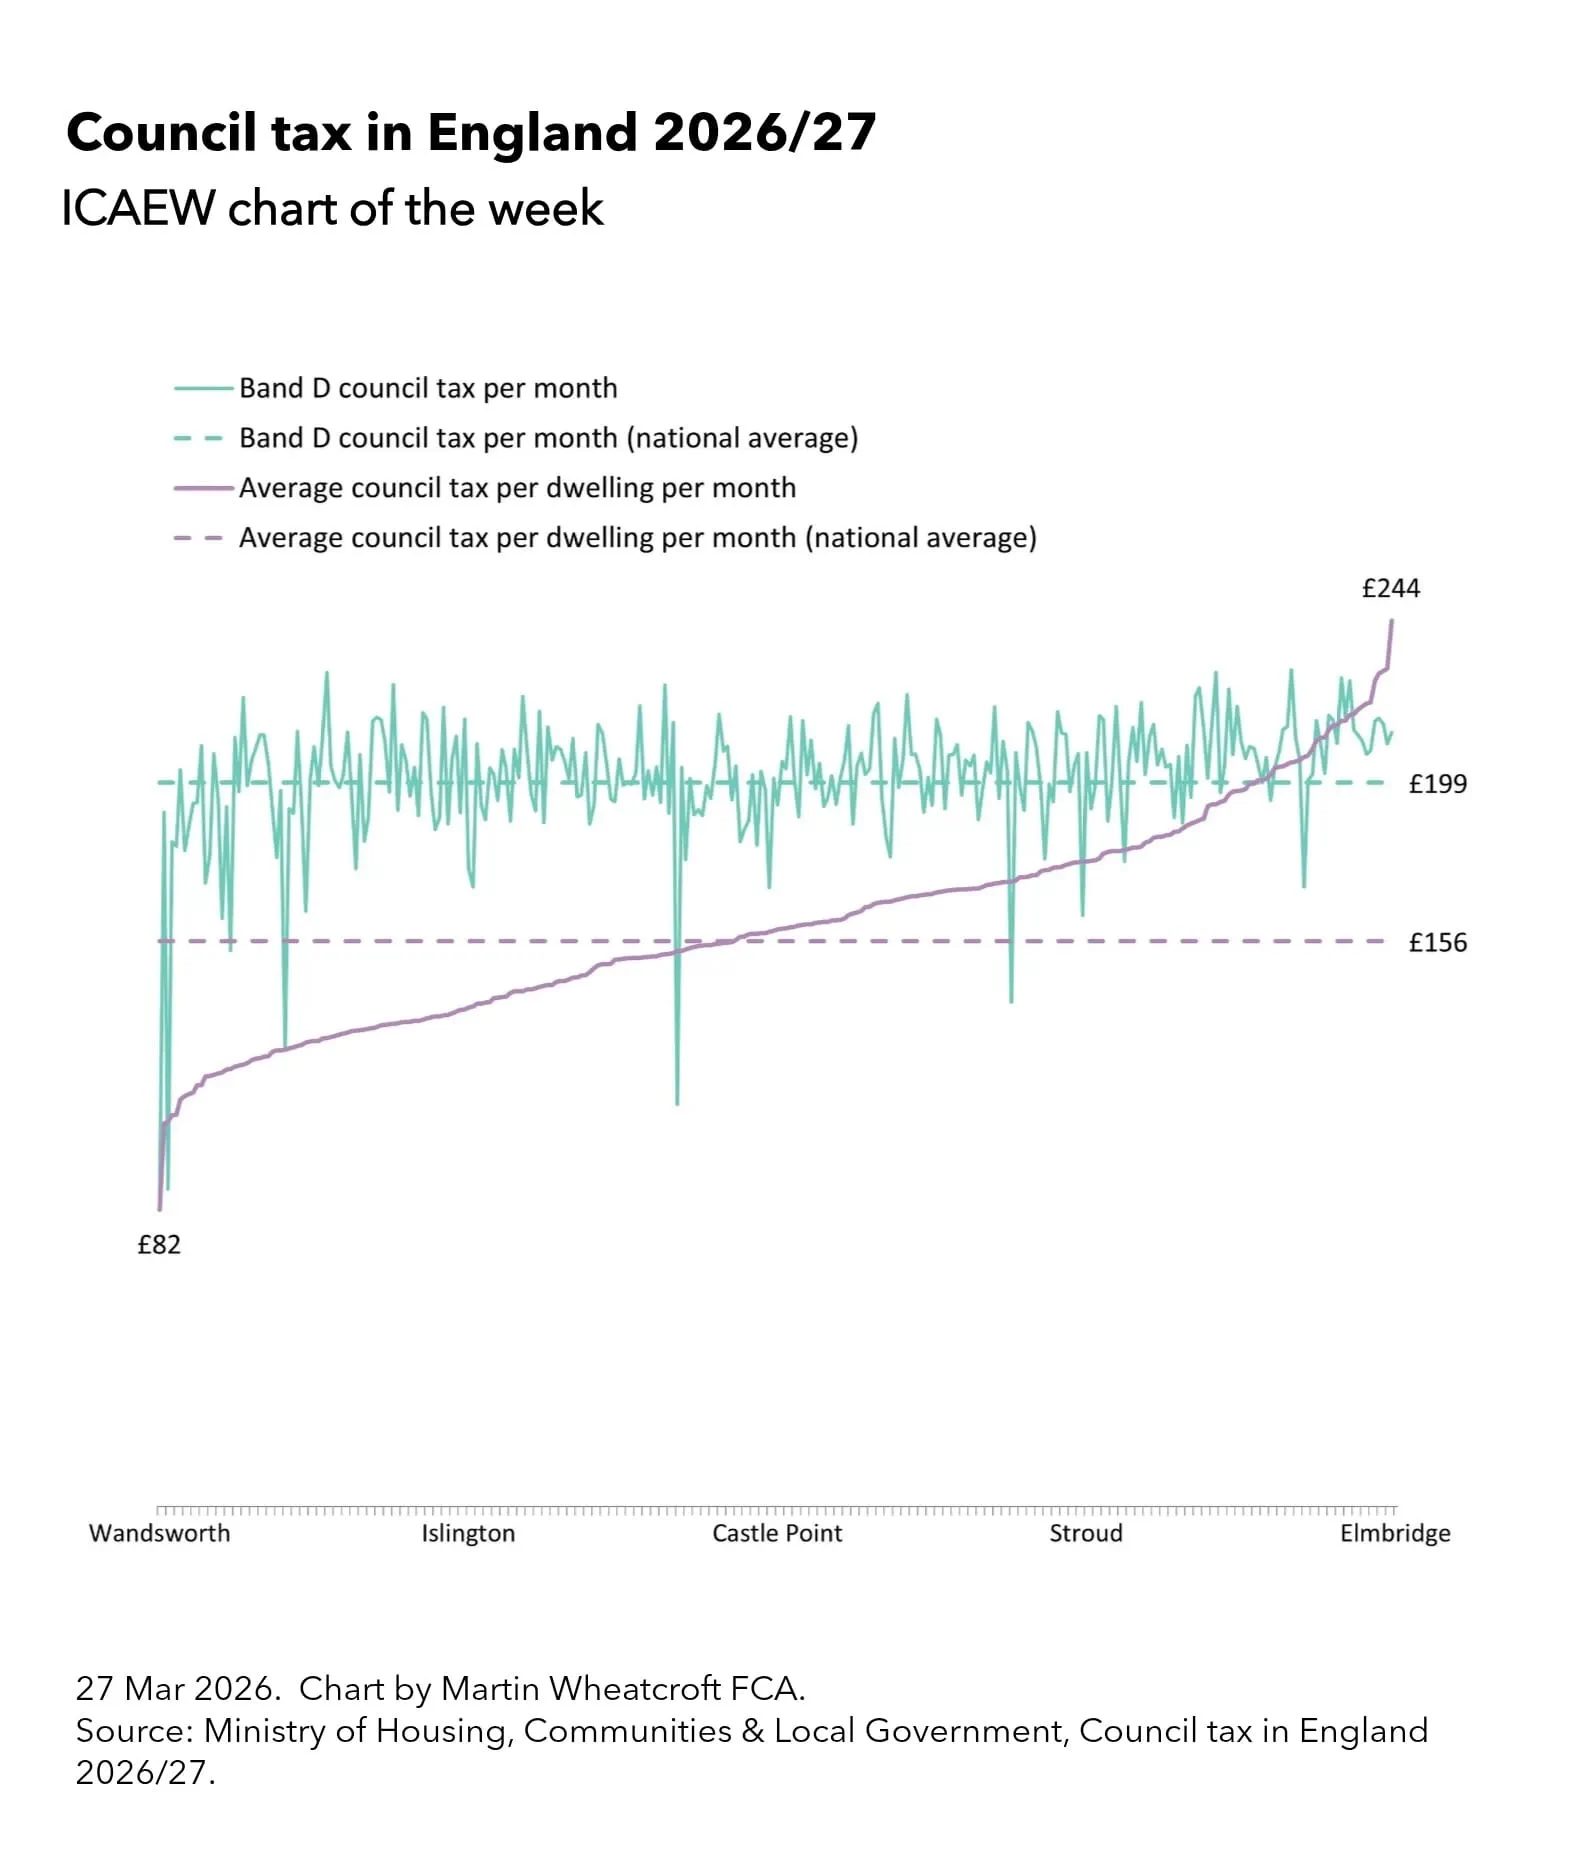
ICAEW chart of the week: Council tax in England 2026/27. 

A line chart showing council tax rates in England across 296 local billing authorities. 

Average council tax per dwelling per month (national average) - a horizontal dotted purple line of £156 per month. 

Average council tax per dwelling per month - a solid purple line marked with £82 for Wandsworth curving up very quickly and then fairly straight through Islington to cross the national average council tax per dwelling line to the left of Castle Point before curving up again from Stroud onwards to hit £244 for Elmbridge. 

Band D council tax per month (national average) - a dotted teal line of £199 per month. 

Band D council tax per month - a solid teal line jumping up and down centred on the national average, with five points where it goes below the £156 per dwelling average. 

27 March 2026. Chart by Martin Wheatcroft FCA. Source: Ministry of Housing, Communities & Local Government, Council tax in England 2026/27.

My chart for ICAEW this week illustrates the average council tax payable per dwelling by local billing authority in 2026/27, ranging from £82 per month in Wandsworth, £137 per month in Islington, £159 per month in Castle Point in Essex, £178 per month in Stroud, Gloucestershire, and £244 per month (£2,927 for the year) in Elmbridge in Surrey.

These compare with an average council tax per dwelling across England in 2026/27 of £156 per month, a 5.5% increase over 2025/26. This is based on a total amount of council tax of £46.8bn to be raised by 296 local billing authorities divided by approximately 25.1m residential dwellings in England.

Our chart also illustrates how the relationship between the average council tax per dwelling in each local authority area and the amount payable on a Band D property can vary significantly based on the proportions of residential properties in each band (based on 1991 property values). In some areas there are more Band E, F, G and H properties, which pay 22%, 44%, 67% and twice the amount payable on a Band D property respectively, while in others there are more Band A, B and C properties that pay 33%, 22% and 11% less respectively.

Overall, the national average per dwelling amount is 22% less than the headline rate of council tax on a Band D property of £199 per month, reflecting the approximately two-thirds of properties that are in Bands A to C nationally.

In the five highlighted local authorities, the average council tax per dwelling is 5% less, 22% less, 18% less, 14% less and £15% more respectively than their Band D rates of £86 per month in Wandsworth, £176 in Islington, £193 in Castle Point, £208 in Stroud, and £213 per month in Elmbridge.

The 296 billing authorities comprise 32 London boroughs and the City of London, 36 metropolitan boroughs, 62 unitary authorities and the Isle of Scilly, and 164 district councils. They raise council tax on behalf of themselves and (as appropriate) the Greater London Authority, 37 territorial police forces outside London, 29 fire and rescue authorities outside London, 12 regional combined authorities, and 21 county councils. They also raise precepts for just under 9,000 town and parish councils, mostly in rural areas.

Council tax in Wales

Not included in the chart are council tax bills for 2026/27 in Wales, where the average council tax per dwelling is £173 per month for its 22 principal councils, which raise £3.0bn in council tax from 1.4m dwellings for themselves, the four Welsh territorial police forces and around 730 community councils.

The average council tax per dwelling ranges from £137 per month in Caerphilly to £175 per month in Wrexham and £226 per month in Monmouthshire, respectively 21% less, 9% less and 12% more than the Band D rates in those councils of £174, £192 and £201 per month respectively. The national average of £173 per month is 9% less than the average Band D rate across Wales of £190 per month.

The variations reflect the differing proportions of residential properties in each band in each principal council area (based on 2003 property values), as well as the Welsh additional Band I that pays 17% more than a Band H property.

Changes ahead for councils

Back in England, the big development is the planned abolition over the next three years of the remaining county and district councils. The replacement of these two tiers with unitary authorities should establish a single principal tier of local government across the whole of England, while the gradual extension of regional combined authorities to cover more of the country should enable further devolution of responsibilities from Whitehall to the regions.

Although the rise in council bills will be unwelcome to many, the reality is that many if not most local authorities in both England and Wales are struggling financially, with the growing cost of local welfare provision (especially adult social care, child social care and homelessness) combined with limits on funding from central government continuing to squeeze budgets for local public services.

Whether the Chancellor’s proposed devolution of a share of income tax receipts to the English regions will make a significant difference to the financial health of local government remains to be seen.

For further information on council tax by local authority in England and Wales in 2026/27 visit the MHCLG council tax webpage and the Welsh government council tax webpage respectively.

This chart was originally published by ICAEW.

COVID tips Croydon Council over the edge into bankruptcy

17 November 2020: Croydon Council has gone into section 114 ‘bankruptcy’ following years of overspending, losses on commercial investments and the effects of the coronavirus pandemic. What went wrong?

Croydon Council issued a section 114 notice on Wednesday 11 November 2020, the first local authority to do so since Northamptonshire County Council went bust in 2018.

The move by Lisa Taylor, Croydon’s finance director and section 151 officer, followed pre-pandemic losses of £163m in 2019-20 and £221m in 2018-19 and the publication last month of a highly critical public interest report by external auditor Grant Thornton. A central government commissioned governance review is underway.

The public interest report was highly critical of how Croydon Council has run its finances over the last few years, with findings including the use of capital funding to cover operating losses, £545m borrowed over a three-year period – much of which was used to invest in commercial properties – and serious failings in governance in addressing the financial situation facing the council. Grant Thornton reported that General Fund and Earmarked General Fund reserves had reduced from £58.2m at 31 March 2016 to £16.6m at 31 March 2020, and conclude with the following statement:

“Had the Council implemented strong financial governance, responded promptly to our previous recommendations and built up reserves and addressed the overspends in children’s and adult social care, it would have been in a stronger position to withstand the financial pressures as a result of the COVID-19 pandemic. The Council needs to urgently address the underlying pressures on service spends and build a more resilient financial position whilst also addressing the long-term financial implications of the capital spending and financing strategy together with the oversight of the Council’s group companies.”

The section 114 notice places a stop on non-statutory expenditures, resulting in the potential closure of some local services, redundancies to save costs and increasingly strained calls to the Ministry for Housing, Communities & Local Government (MHCLG) asking for a bailout. It highlights a budget gap of at least £30m and additional risks of £37m or more.

Croydon is not alone in suffering from significant cuts in funding over the last decade and cost pressures in adult and child social care provision in particular. However, weak financial governance, a failure to address cost pressures, inadequate reserve levels and increased balance sheet risk from debt-financed commercial property investments have all made it more vulnerable to a crisis.

Although it is perhaps not surprising that Croydon has failed, given the issues highlighted by its external auditors, more section 114 notices are likely over the coming months as even well-run councils struggle to cover income shortfalls. 

The government will also be concerned about the number of councils planning to cut local services and investment in their local economies over the next few years, just as it is hoping to rebuild the economy and deliver on its levelling up agenda.

This article was originally published on the ICAEW website.

ICAEW chart of the week: Local government in England

9 October 2020: The complex structure of regional and local authorities in England is just begging for reform, but will the rumoured plan to abolish county and district councils fix it for good?

Chart with three rings: regional tier, county or unitary tier and then district council tier, showing lots and lots of councils in England.

Local government in England, as illustrated by the #icaewchartoftheweek, is pretty complex with eight different types of regional or principal authority and a patchwork quilt of different tiers of government across the country.

This complex system comprises areas without a regional tier of government involving unitary authorities or county & district councils, and those with combined authorities atop unitary authorities or metropolitan boroughs (and one county and its districts) and the Greater London Authority atop 32 London boroughs and the City of London. (This excludes the 9,000 or so town, village and other forms of parish councils in England, mostly outside the major urban areas).

This complexity makes it very difficult for the Government to interact with local authorities in the absence of a consistent model of local government or a country-wide regional tier of government to act as intermediary. This contrasts (for example) with the federal system in Germany, where Chancellor Angela Merkel regularly speaks to the leaders of the 16 German states, who in turn deal with the local authorities in their areas. Similarly (although not formally federal), France has 13 mainland and 5 overseas regional administrations that President Emmanuel Macron and Prime Minister Jean Castex can talk to and who will deal with their constituent provinces.

The UK Government can and does communicate with London Mayor Sadiq Khan, Greater Manchester Mayor Andy Burnham, West Midlands Mayor Andy Street, West Yorkshire Chair Susan Hinchcliffe, Liverpool City Region Mayor Steve Rotherham, Sheffield City Region Mayor Dan Jarvis, North East Chair Iain Malcolm, West of England Mayor Tim Bowles, Cambridgeshire & Peterborough Mayor James Palmer, North of Tyne Mayor Jamie Driscoll and Tees Valley Mayor Ben Houchen, each of whom can represent their constituent local authorities. But, they only represent 44% of the English population, with a further 24 county council leaders and 46 unitary authority leaders to speak to cover the remaining 56%. That is a pretty big Zoom call, assuming borough and unitary leaders within the regional authority areas don’t also insist on joining in.

The delayed announcement of a plan to abolish the 25 county and 188 district councils and replace them with between 25 and 40 new unitary authorities (perhaps with some mergers with existing unitary authorities) will go some way to rationalising the existing system by going to a single tier of principal local authorities. This would bring local public services together under one roof and save money, albeit there are some concerns about whether some of the new authorities would be too remote from the local citizenry.

However, this is still likely to leave English local government reform unfinished with over half the country without a regional tier of government. Will the Government want to continue with its existing organic approach of combined authority formation or go for a more comprehensive programme to establish regional authorities across the whole country, similar to the French reforms of the 1980s?

This chart was originally published by ICAEW.