This week’s chart for ICAEW is on manifesto costings, illustrating the scale of each party’s promises and how they expect to fund them.
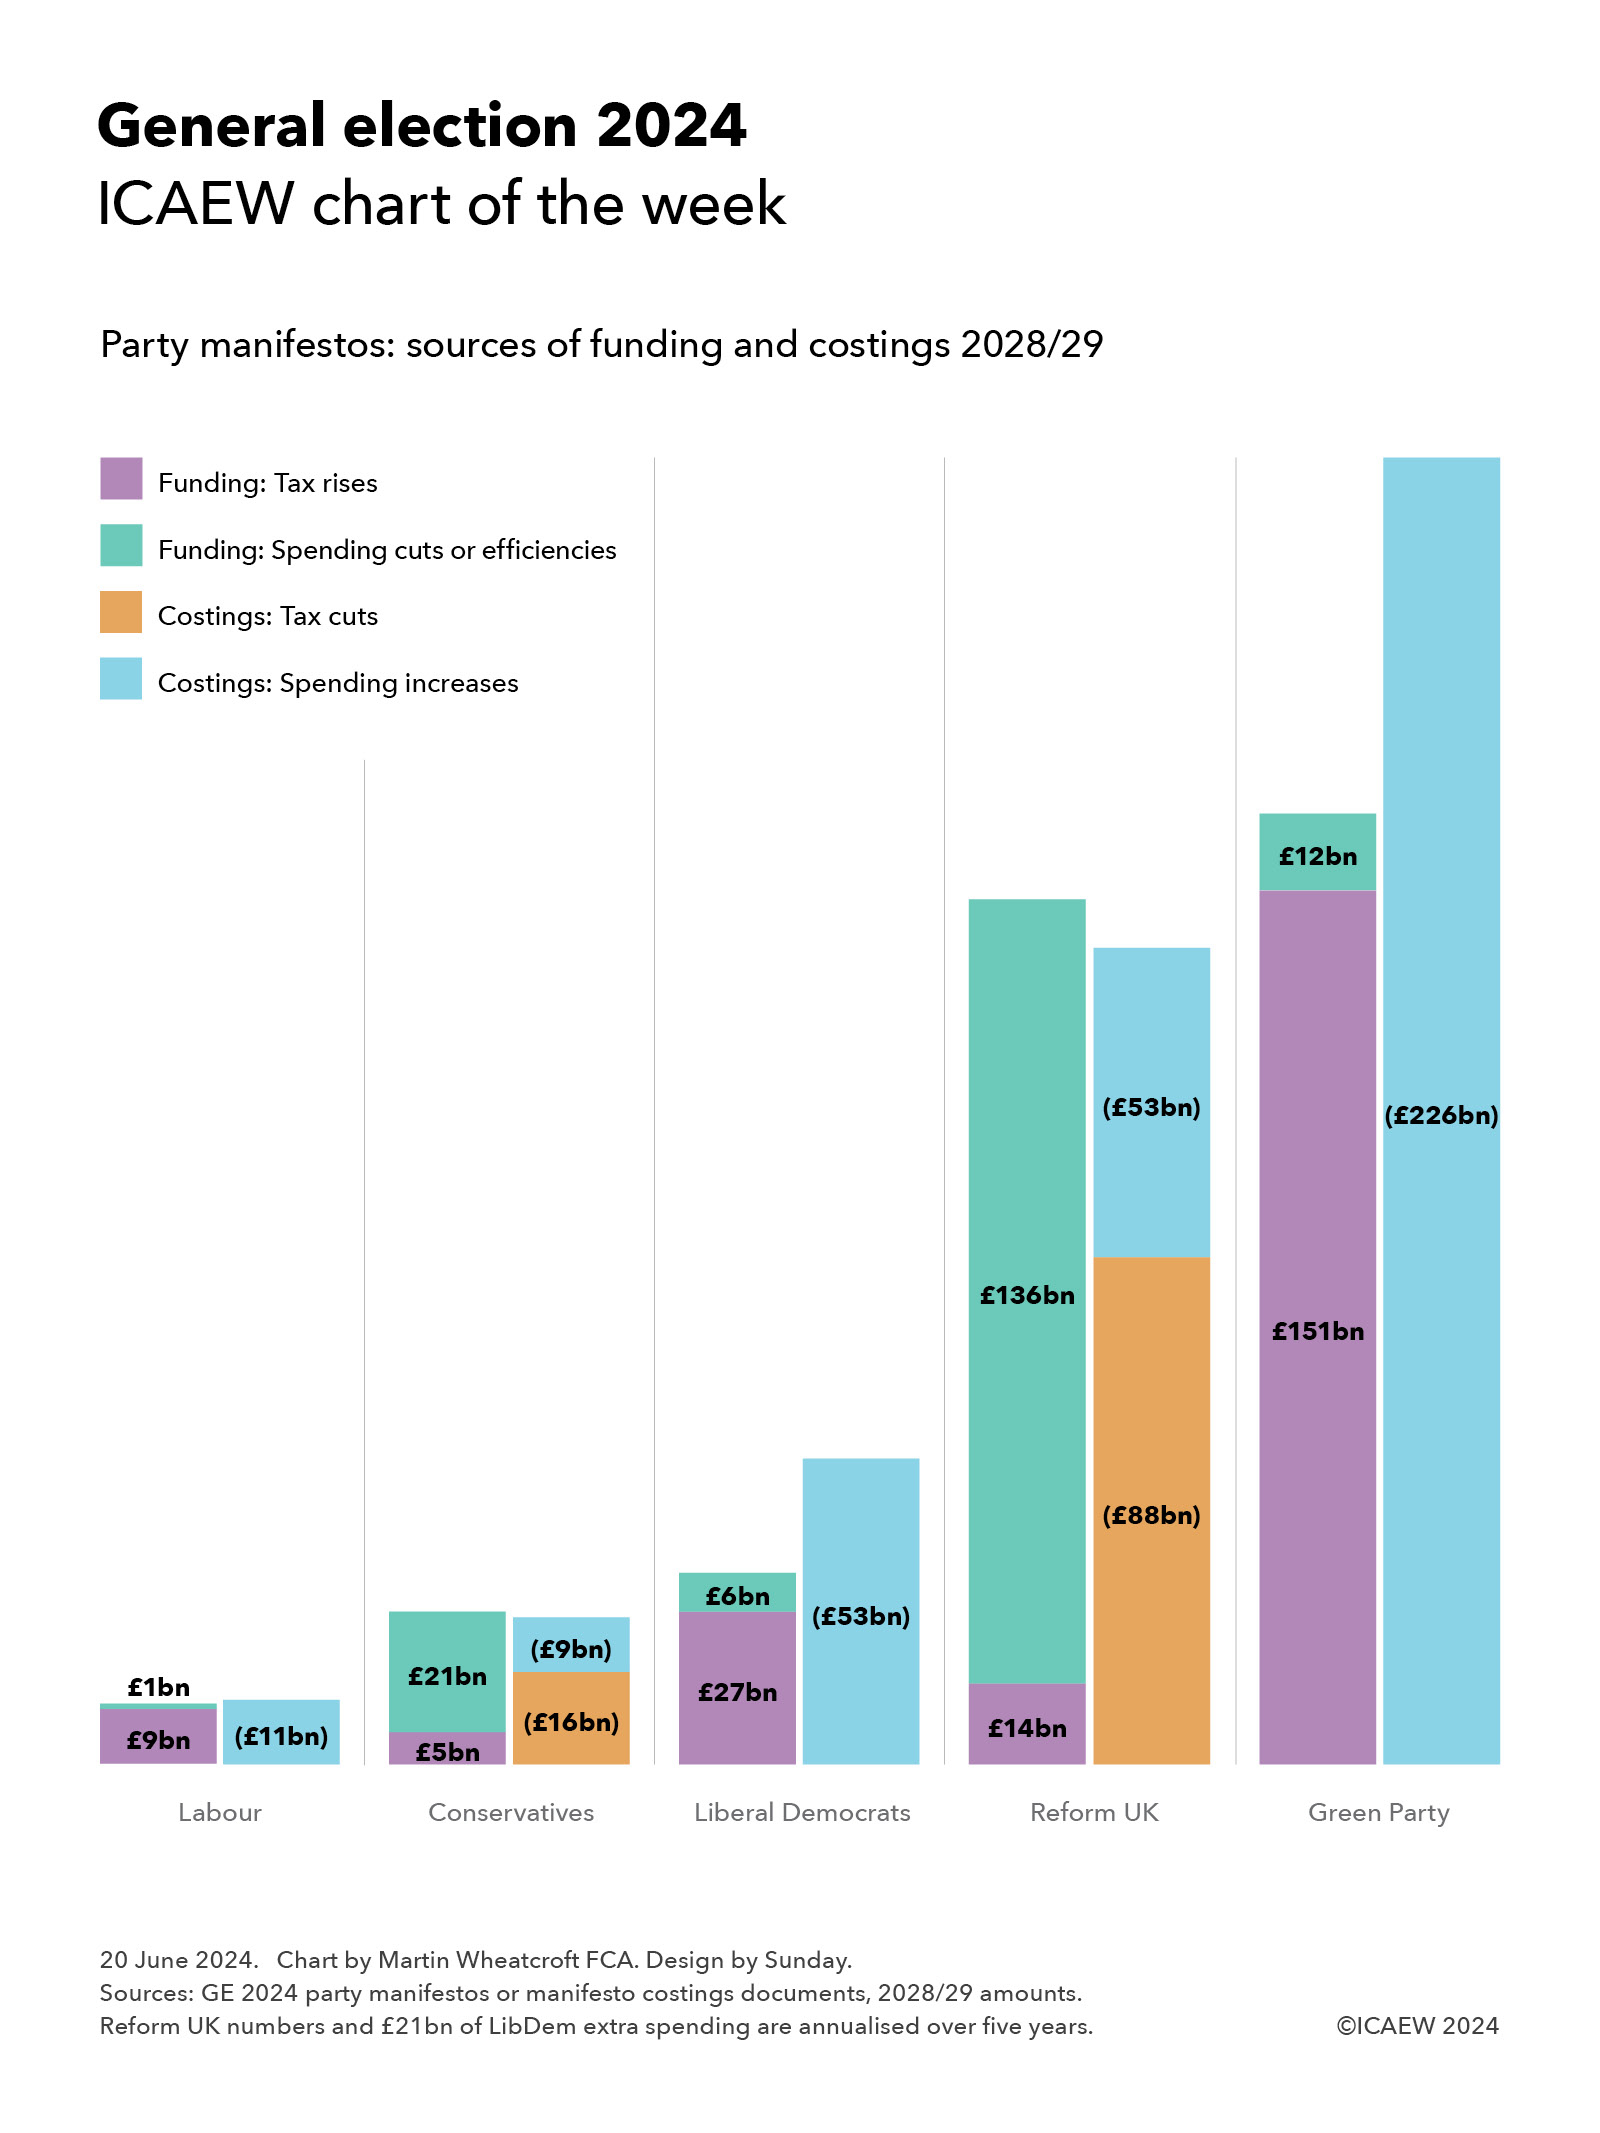
My chart for ICAEW this week summarises the financial commitments in the manifestos of the five UK-wide political parties, together with how they propose to fund their plans.
The Labour Party
The Labour Party manifesto costings are the most cautious financially, with plans to find £9bn in 2028/29 from a combination of tax rises and tackling tax avoidance and evasion and £1bn or so in spending reductions to provide most of the funding for its spending commitments of £11bn.
The additional tax revenue proposed by Labour includes £5.2bn from increasing taxes on non-doms and tackling tax avoidance and evasion, £1.5bn from VAT and business rates on private schools, £1.2bn from extending windfall tax on oil and gas, and £0.6bn from increasing the tax rate on private equity carried interest. Spending reductions include £0.7bn from cutting spending on consultants, £0.4bn from increased collaboration between police forces, and £0.2bn from scrapping the Rwanda plan and ending the use of hotels for asylum seekers.
Labour’s proposals for new spending comprise approximately £6bn for public services and £5bn a year in capital investment. The former includes £1.8bn for the NHS, £1.0bn for schools and young people (including £0.3bn for primary school breakfast clubs), £0.9bn for HMRC to tackle tax avoidance and evasion, £0.7bn for improving public service delivery and capability, £0.4bn for 13,000 neighbourhood and community PCSOs, and £0.2bn for asylum and border control. The latter includes £1.7bn for Great British Energy, £1.5bn for green investment programmes, £1.1bn for home insulation, and £0.3bn in incentives for green energy suppliers.
Labour’s proposals add up to £1bn in extra borrowing in 2028/29, although Labour suggest that they could add £3.5bn to borrowing in 2028/29, implying a further £2.5bn could be available for other priorities.
The Conservative Party
The Conservative Party’s plans are more ambitious, with plans to raise £5bn a year by 2028/29 from tackling tax avoidance and evasion and £21bn from spending cuts and efficiency savings, which they intend to use to fund tax cuts of £16bn and extra spending of £9bn.
Proposed spending cuts by the Tories comprise £11bn from cutting planned spending on welfare (principally disability benefits), £5bn from other cuts (£1.6bn R&D, £1.5bn regional development, £0.9bn from cutting ‘low value’ degrees, £0.4bn from visa changes, and £0.6bn in other measures), and £5bn from efficiency savings (£2.9bn civil service headcount, £1.1bn from quangos, £0.6bn consultancy and £0.4bn NHS managers).
Proposed tax cuts include £10bn per year by 2028/29 to halve employee national insurance, £1.7bn to abolish self-employed national insurance, £2.2bn to increase pensioner tax allowances, £1.2bn to reform the high-income child benefit charge, and £0.6bn to reduce stamp duty for first time buyers.
Unlike Labour, there is no additional investment in HMRC to help achieve the planned reduction in the tax gap, but there is £4.5bn in 2028/29 to increase defence spending to 2.44% of GDP (on its way to 2.5% by 2030/31), £2.0bn for national / community service, £1.4bn for the NHS, £0.8bn for 8,000 more police officers, and £0.7bn for apprenticeships.
The Liberal Democrats
The Liberal Democrats are more hopeful in that they believe they can find £7.2bn from tackling tax avoidance and evasion to supplement proposed tax rises of £19.7bn (£5.2bn capital gains tax, £4.3bn bank levies, £4.0bn aviation taxes, £2.1bn oil and gas, £2.1bn digital services tax, £1.4bn on share buybacks and £0.6bn other). The party also plans to find £5.8bn from spending cuts (£4.3bn asylum, £0.9bn free schools, and £0.6bn consultants).
The Lib Dems plan use this additional funding to spend an extra £32bn on public services in 2028/29 (£9.8bn NHS and social care, £6.7bn on defence, borders and international aid, £6.6bn on education and childcare, £4.1bn to tackle child poverty, £2.9bn for the devolved administrations, £1.0bn for farmers and the environment and £0.6bn for transport.
The balance of £20.7bn a year on average over five years for capital investment is expected to be funded mainly by additional borrowing, including £8.4bn to tackle climate change and protect the environment, £6.2bn for social housing, £1.9bn on school buildings, £1.9bn for the devolved administrations, £1.2bn on transport infrastructure, and £1.1bn for hospitals and other health facilities.
The Reform Party
The Reform UK costings in the ‘Our Contract with You’ are on a much bigger scale than everyone apart from the Green Party, with proposals to raise taxes by £14bn and cut spending by £136bn (10% of total public spending, or more once costs such as the state pensions are excluded) in order to fund an £88bn programme of tax cuts and £53bn a year in spending commitments.
The proposed spending cuts include a blanket £50bn a year in efficiency savings from cutting public service spending by 5% “without touching front line services”, £35bn from ceasing to pay interest to commercial banks on central bank deposits, £20bn from scrapping net zero, £15bn from cutting welfare benefits, £6bn from foreign aid, £5bn from reducing immigration and £5bn from stopping HS2 completely. The tax rises comprise a £10bn tax on renewable electricity generators and a £4bn immigration surcharge on employers, together with unquantified amounts from a 4% online delivery tax and a cut in entrepreneur’s relief to 5% that are netted off within the numbers below.
Reform UK plans to use these sums to cut personal taxes by £70bn (raise income tax threshold to £20,000, abolish VAT on energy bills, cut stamp duty, allow VAT reclaims for tourists, halve inheritance tax rate to 20% and raise threshold to £2m), cut business taxes by £18bn (reduce corporation tax to 15% and to zero for profits under £100,000, increase the VAT threshold to £150,000, abolish business rates for high street SMEs and create SME enterprise zones with zero tax when creating jobs).
Spending commitments include £17bn health and social care (a three-year basic rate tax holiday for NHS and social care staff, 20% tax relief on private healthcare and insurance, write-off medical student fees over 10 years and private treatment vouchers), £14bn for defence and veterans (2.5% of GDP with an aspiration to meet 3% after 2030), £8bn for children and families (including £5,000 transferrable marriage allowance and front loading of child benefit for ages 1-4), £5bn for police and courts (recruiting 40,000 new officers over five years), £5bn for education (including 20% tax relief on private school fees – and no VAT), and £4bn for agriculture, fishing and coastal communities
The Green Party
The Green Party has the most ambitious set of proposals, with tax rises of £151bn and cost savings of £12bn together with £63bn in additional borrowing to fund incremental spending of £226bn in 2028/29. It has an expansive agenda that involves nationalising water and the Big 5 energy companies, investing large sums in the green transition, and spending a significant amount more on health and welfare.
Its proposed tax increases comprise £72bn in higher personal and wealth taxes, £70bn from a carbon tax and around £9bn from business taxation, with £12bn in savings from cancelling the Trident replacement and roadbuilding programmes. Its proposals include aligning capital gain tax rates and investment income with income tax, increasing national insurance above the upper earnings limit from 2% to 10%, restricting pension tax relief to the basic rate, reforming inheritance tax, and introducing a 1% wealth tax on individuals with assets above £10m and 2% above £1bn. It also wants to replace council tax and business rates with land value taxes.
If achieved, this would allow it to pay for £145bn in additional current spending of £145bn in 2028/29 and £81bn in extra capital investment. The former includes £46.4bn for health and social care, £27.2bn welfare, £20.1bn overseas aid, £13.2bn education, £11.9bn transport, £4.5bn nature, food and farming, and £21.7bn for other priorities. The latter includes £56.7bn for green investment, £10.5bn for social housing, £6.6bn for health and education, and £6.8bn for other capital expenditures.
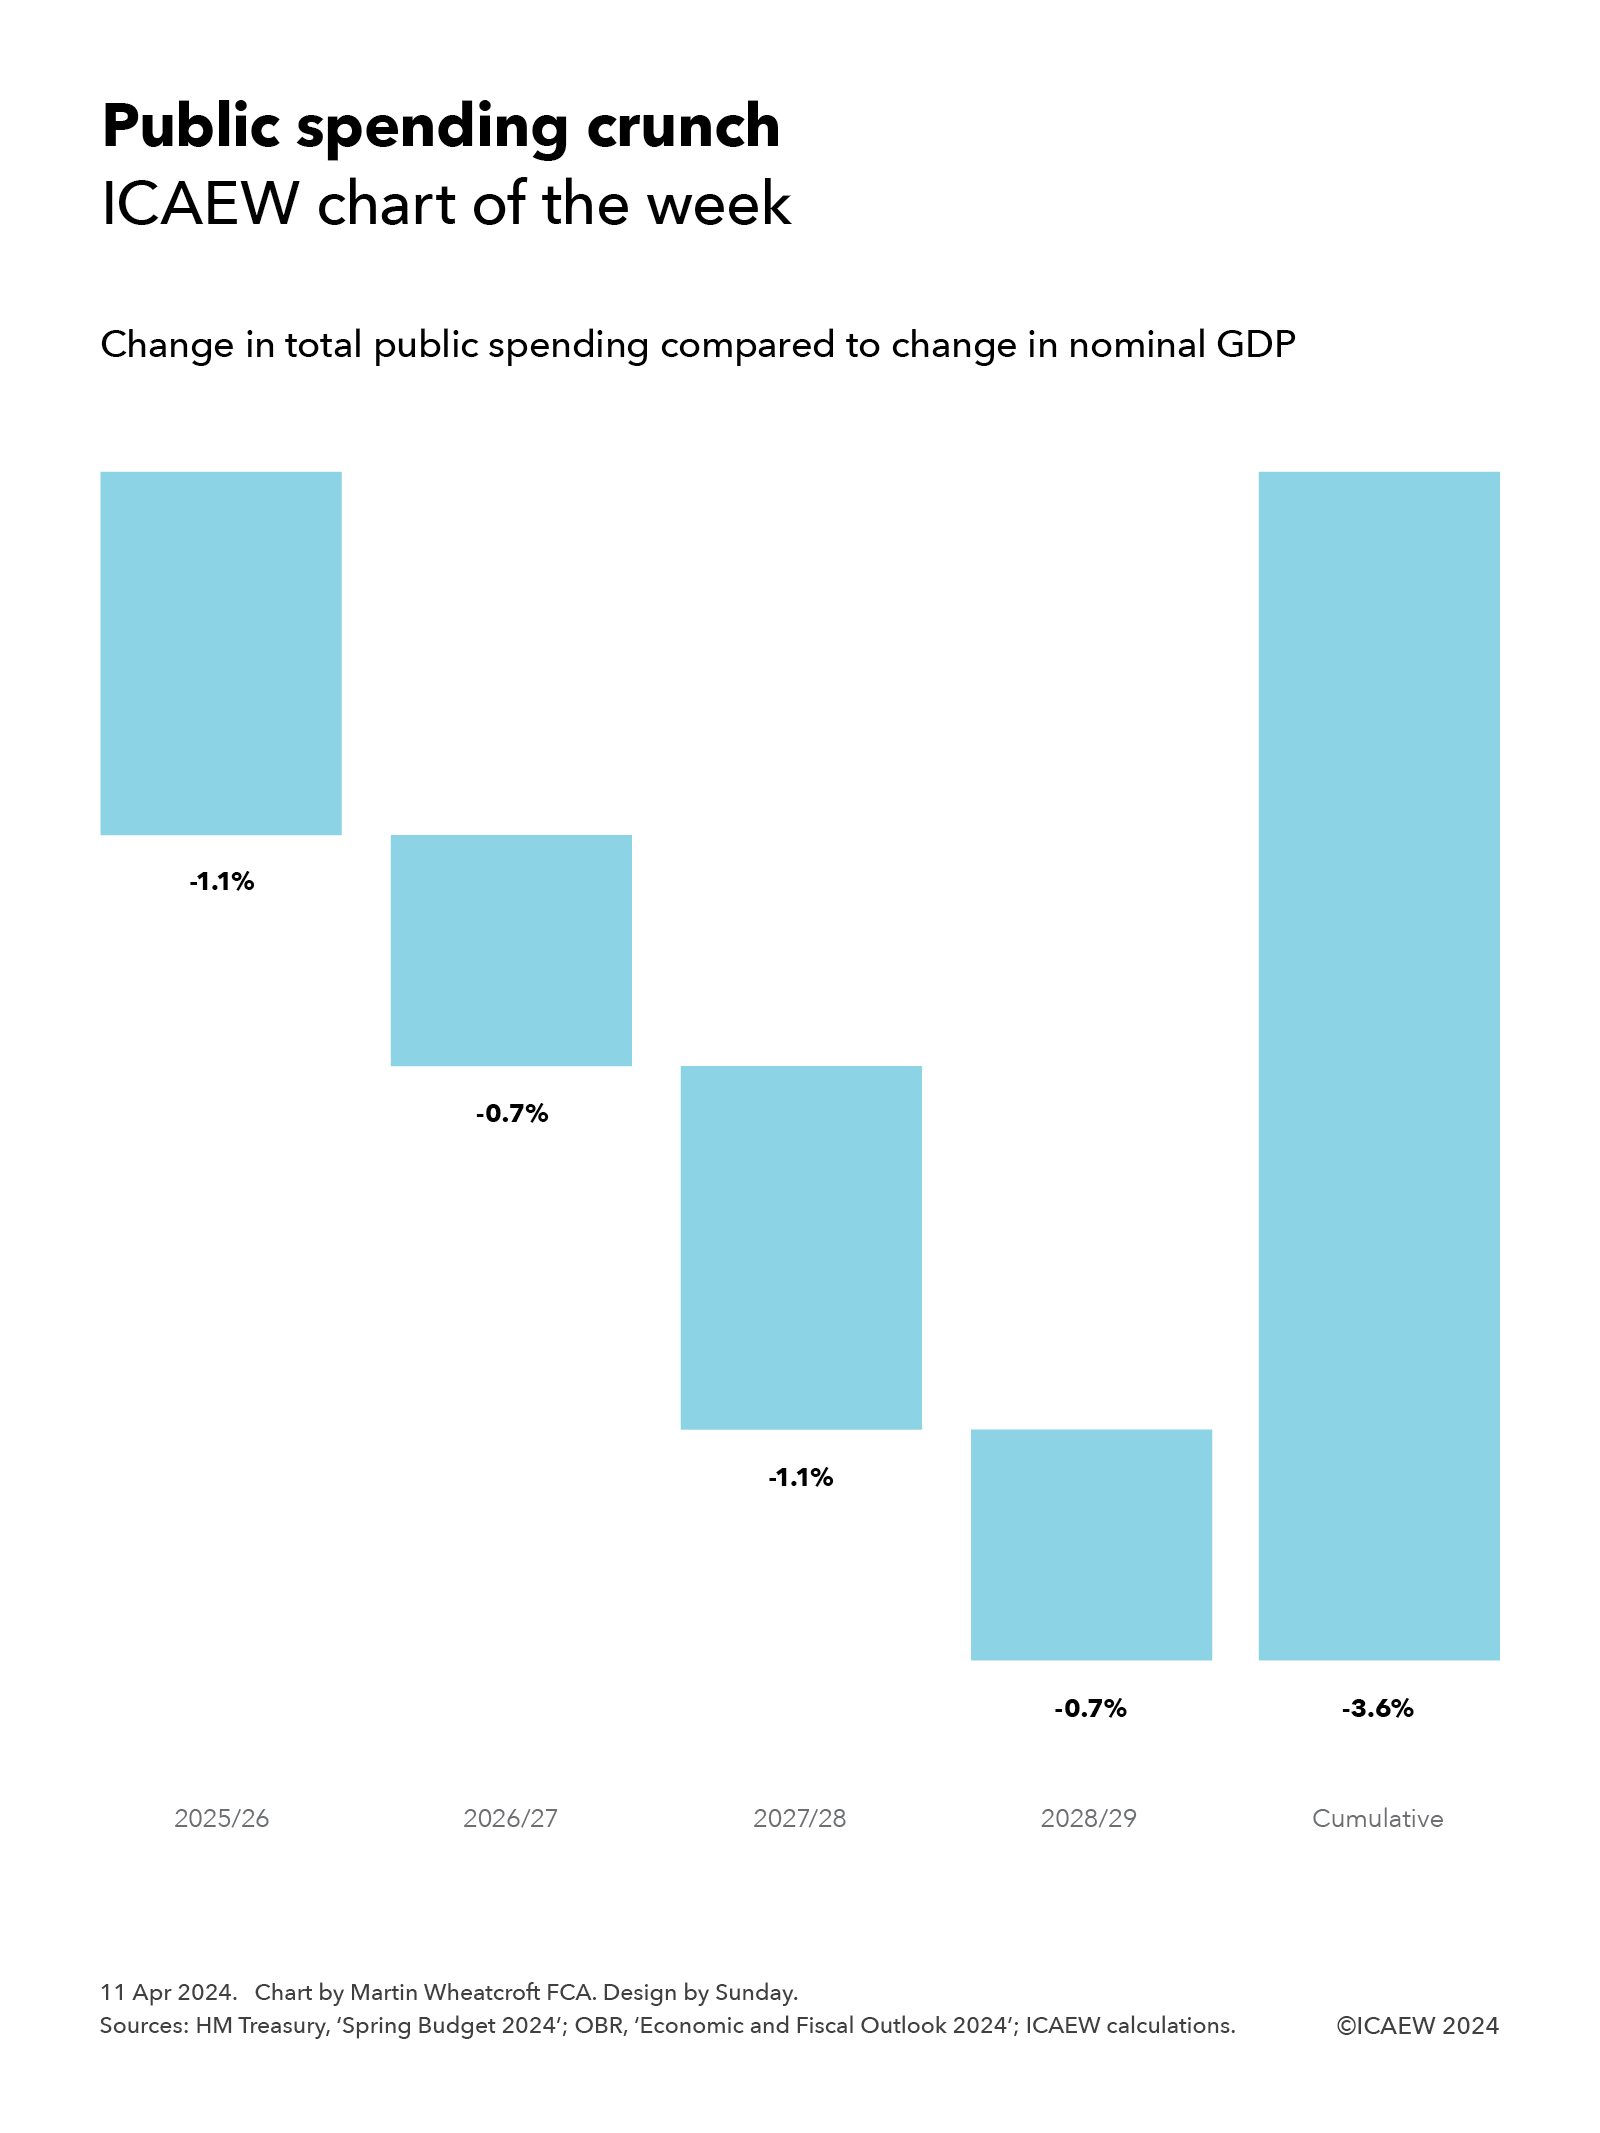
Upcoming Spending Review does not feature
None of the parties addresses the ‘elephant in the room’ represented by the upcoming three-year Spending Review for 2025/26 to 2027/28 that is expected by the Institute for Fiscal Studies and others to identify up to £20bn per year of additional funding requirements to maintain public services at their current level.
Overcoming the current weak state of the public finances is likely to be first order of business for whichever party wins the election.