My chart for ICAEW this week looks at what we all do for a living and how the government wants to move more of us from economically inactive categories into the workforce.
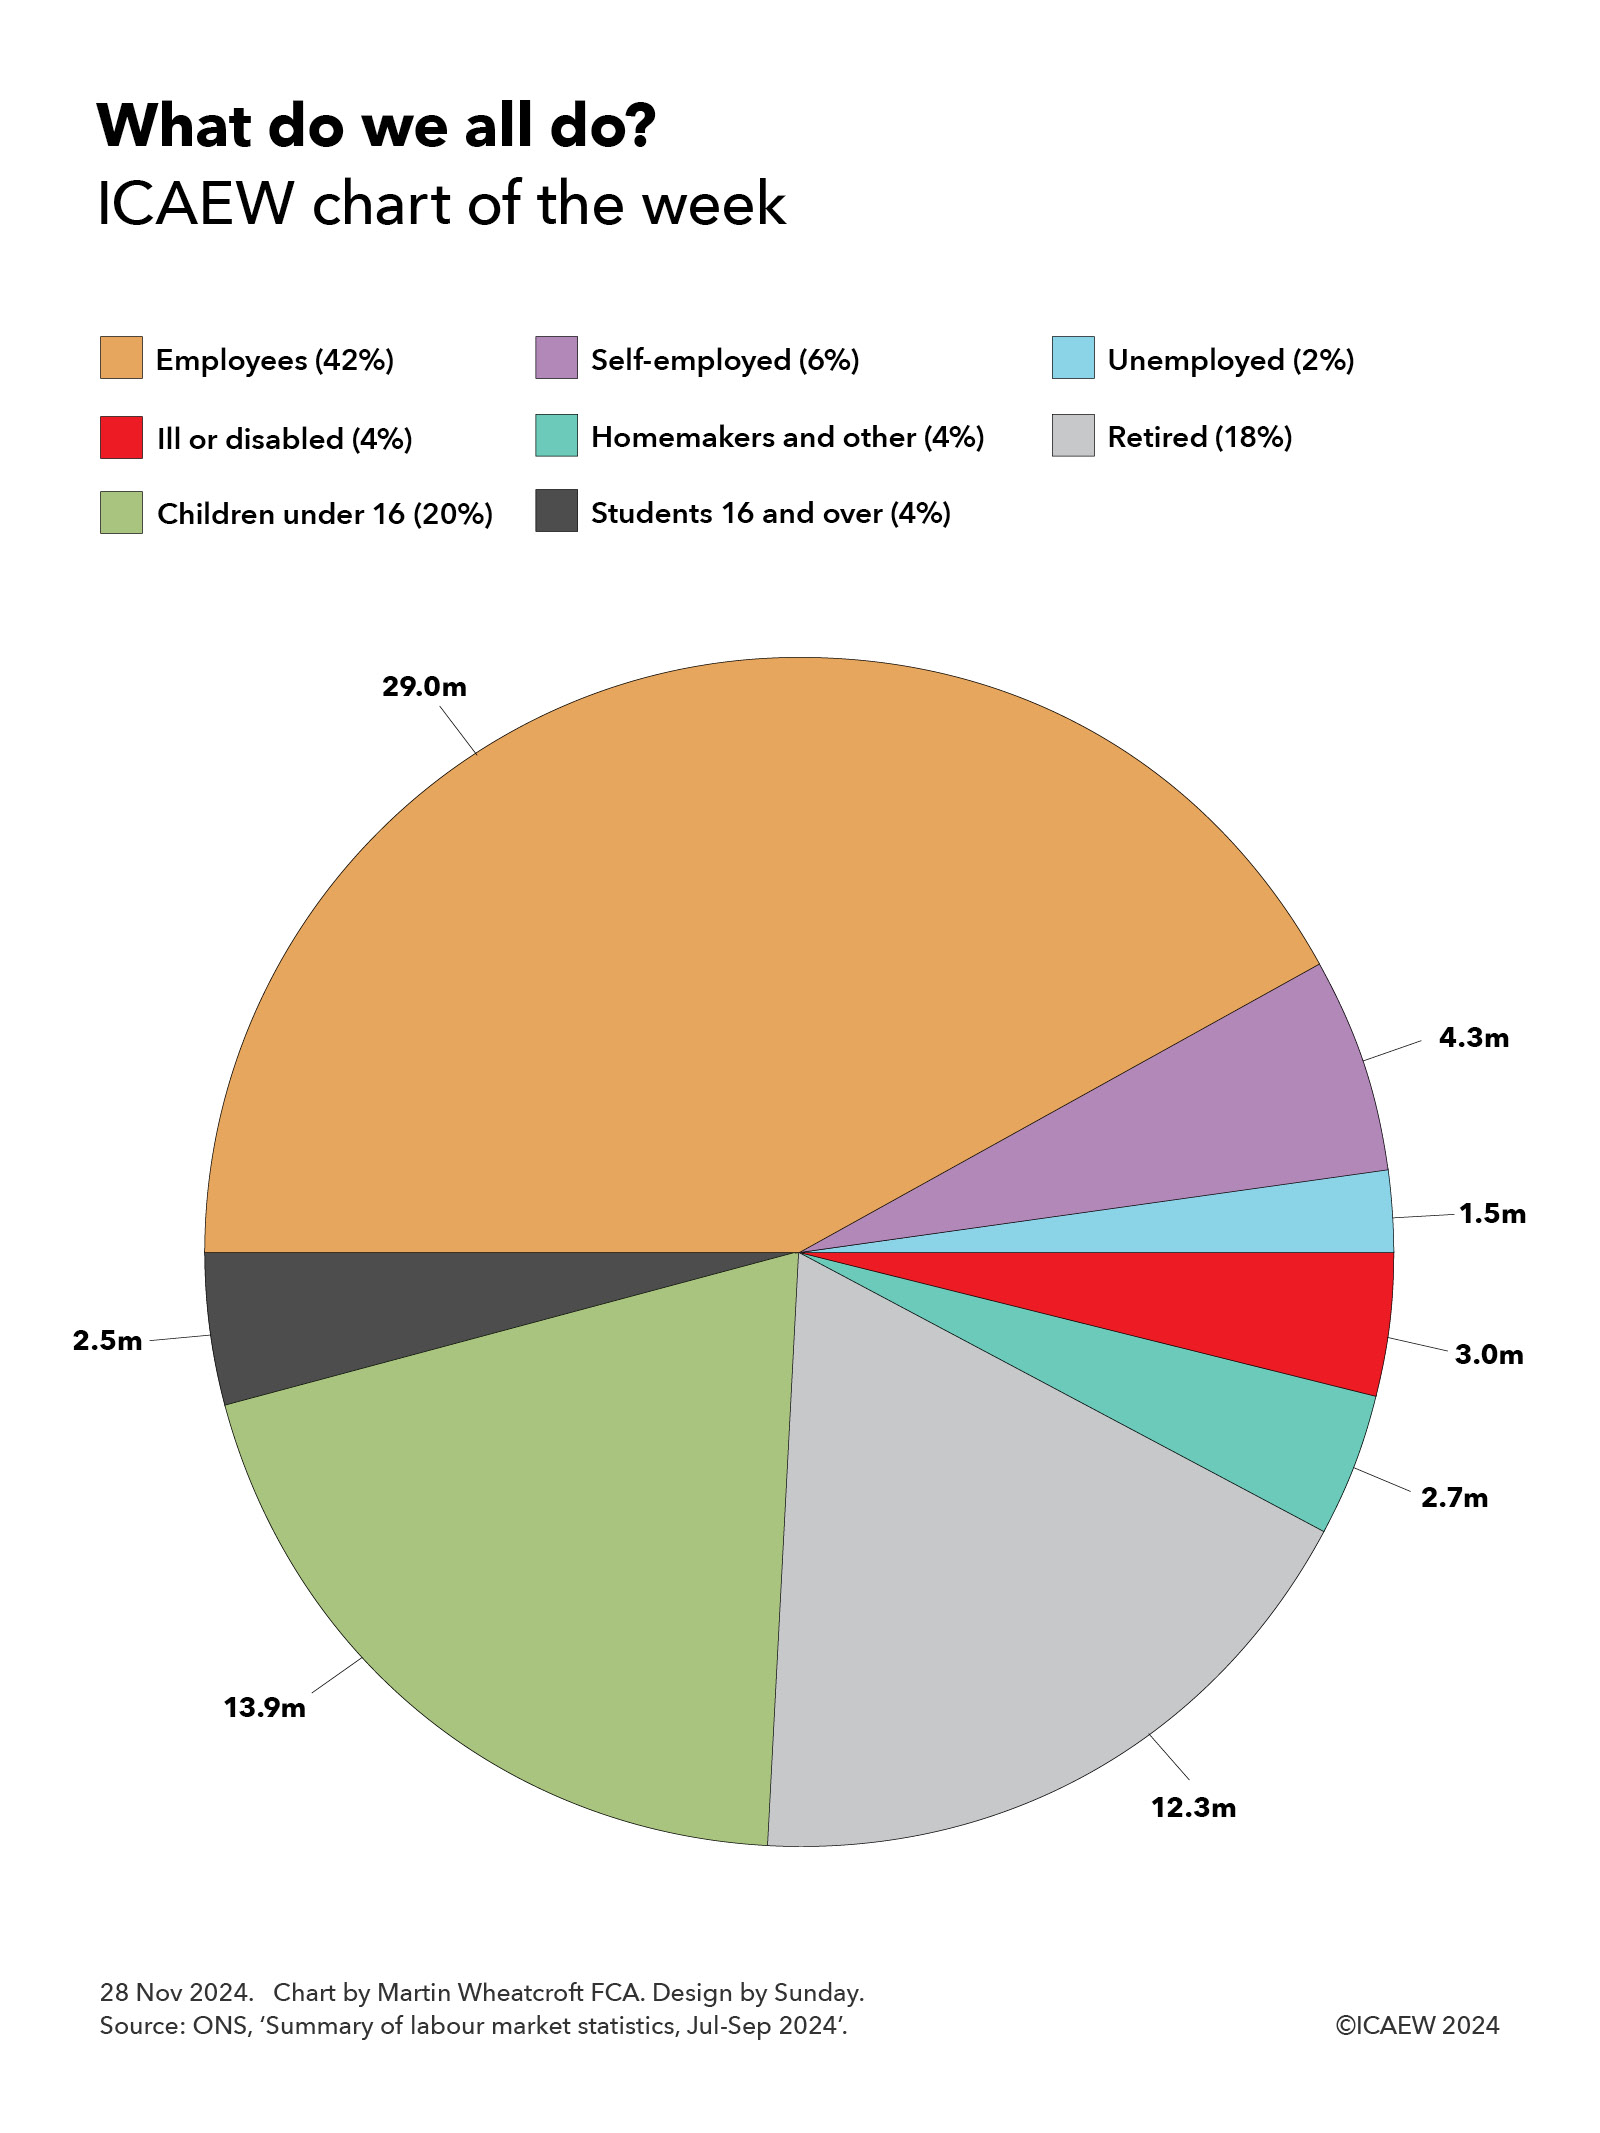
My chart of the week for ICAEW looks at what we do for a living, according to the latest labour market statistics from the Office for National Statistics (ONS) for the third quarter between July and September, when the estimated population was 69.2m.
According to the ONS, 29m people (42% of the total population) were in employment, 4.3m (6%) were self-employed and 1.5m (2%) were unemployed seeking work. In total this is fractionally just over half of the population (50.3%).
The other (almost) half of the population were not in work. They comprised 3m (4%) not working because of illness or disability, 2.7m (4%) homemakers or not working for other reasons, 12.3m (18%) people in retirement, 13.9m (20%) children under the age of 16, and 2.5m (4%) students aged 16 or over who were not also working.
The 33.3m who were employed or self-employed include 1.5m people aged 65 or more and 1.1m students in full-time education who also work. Around 5.9m work in the public sector. Overall, there are 24.9m people working full-time and 8.4m working part-time, while some 1.2m workers have more than one job.
The 1.5m unemployed include 0.2m students in full-time education who are actively seeking work. Meanwhile, the 12.3m in retirement include 1.1m people who are under the age of 65.
The ONS also reports that 1.9m of those who are economically inactive between the ages of 16 and 64 would like a job, including 0.7m of those who are not working because of illness or disability.
The government is very keen to get as many as possible of the 1.5m people who are unemployed, and the 3.0m not working because of illness or disability, into work. This would benefit the public finances twice over by not only reducing the cost to the exchequer of welfare payments paid out, but also by increasing the amount of tax receipts coming in.
Recent statements from government ministers have suggested that their strategy includes tightening the eligibility criteria for illness and disability benefits, in addition to providing additional support to help people back into the workforce.
The government is also looking at how it can encourage some of the 1.1m retirees below the age of 65 back into work, as well as persuading more of us to work beyond the statutory retirement age of 66.