My chart for ICAEW this week highlights how the BBC is struggling financially after incurring an operating loss of £0.3bn on the provision of public service broadcasting and the failure of commercial activities to contribute to the bottom line.
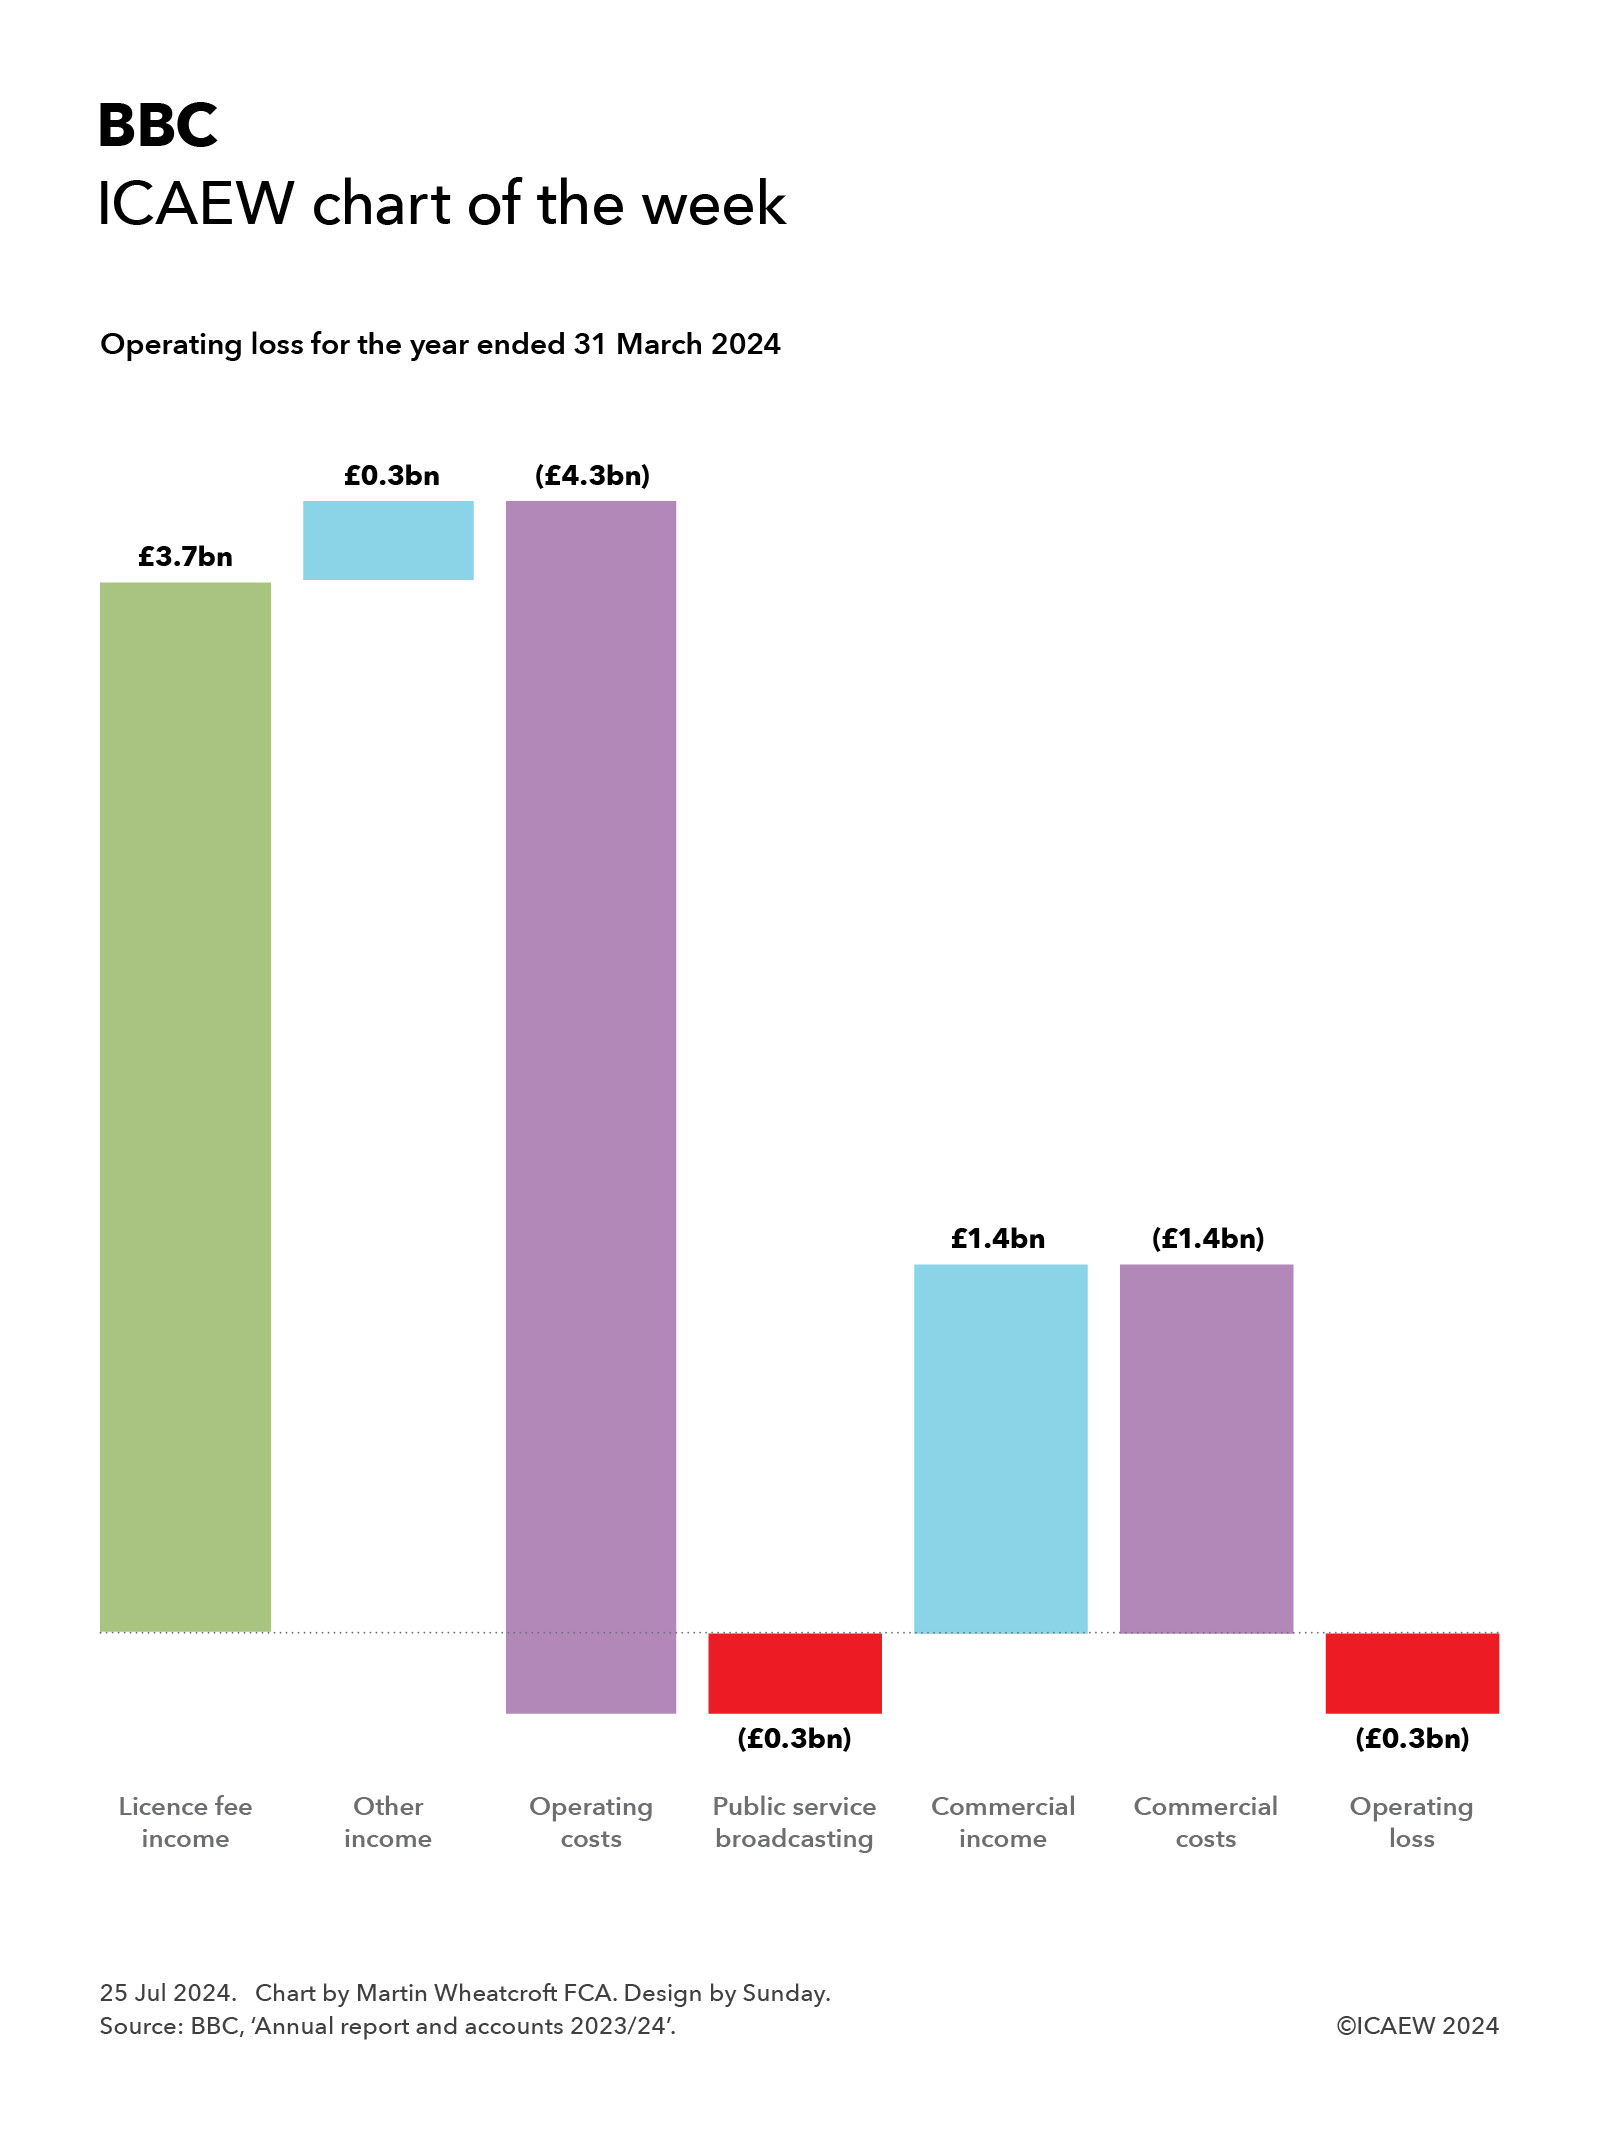
The British Broadcasting Corporation (BBC) recently published its annual report and accounts for the year ended 31 March 2024 (2023/24) and my chart highlights how the BBC is struggling financially with a reported operating loss of £0.3bn and no operating profit contribution from commercial activities.
Licence fee income was £3.7bn in 2023/24, which combined with other income of £0.3bn resulted in public services broadcasting revenue of £4.0bn. After deducting operating costs of £4.3bn, this meant the BBC lost £0.3bn on its eight national and seven regional TV channels, 10 national and 46 regional and local radio stations, BBC World Service radio in 42 languages, BBC iPlayer, BBC Sounds, BBC Education, news, sport and weather internet sites, orchestras and other activities, including funding of the independent S4C TV channel in Wales.
External income generated by the BBC’s commercial operations amounted to £1.4bn but this was offset by £1.4bn in operating costs, leaving the overall group operating loss broadly unchanged from the public service broadcasting total.
Licence fee income of £3.7bn was just under £0.1bn or 2% lower than the year before as the number of households paying the full licence fee reduced from 23.2m to 22.7m at the end of March 2024 on a fee frozen at £159 per year (equivalent to £13.25 per month). There were approximately 4,000 households with monochrome licences and 0.2m households on concessionary fees, with a further 1.0m with free licences (principally given to those aged 75 or more receiving pension credit).
Other income includes £0.2bn from contract income and £0.1bn in grants from the Foreign Office towards the cost of the World Service.
Public services broadcasting expenditure of £4.3bn was £149m lower than the year before and can be analysed between spending on content of £3.0bn, distribution and support costs of £0.9bn, and other activities of £0.4bn. Content spending can be further broken down into £1.7bn on TV channels, £0.5bn on radio, £0.3bn on the World Service, £0.2bn on online services including BBC iPlayer, and £0.3bn on other content.
While external commercial income was broadly matched by costs once intra-group transactions are taken account of, the BBC’s commercial businesses contributed £325m in 2023/24 towards the BBC’s overheads, down from £368bn in the previous year. They principally comprise BBC Studioworks, which supplies studio time and post-production services to the major TV networks and most production companies in the UK, and BBC Studios, which produces TV shows and films on behalf of the BBC and other broadcasters, as well as distributing BBC content around the world. BBC Studios also operates the UKTV network of four ad-supported TV channels, four ad-supported streaming channels and three pay TV channels in the UK, several international TV channels (including BBC America and BBC News international services), and the BritBox International streaming service outside the UK (now 100% owned by the BBC).
Not shown in the chart is £0.5bn in non-operating gains, most of which were one-off items, including £0.2bn in gains on disposals in the year and £0.2bn from tax adjustments in respect of prior years. This resulted in an overall net surplus of £0.2bn for the year ended 31 March 2024.
Real-term cuts in the value of the licence fee and falling returns from commercial activities have put significant financial pressure on the BBC in recent years, causing it to cut back on content and some services, consolidate operations such as domestic and international news gathering, and undergo a series of restructurings to improve efficiency.
The 8.7% increase in the licence fee to £169.50 from 1 April 2024 (equivalent to £14.13 per month) and inflation-linked increases planned over the next three years should help ease some of the pressure in the current financial year, although returning to operating profitability is likely to still require the BBC to look for further savings in its public service broadcasting operations.
Unfortunately, the BBC has not been able to replicate its commercial success in the years before streaming when it was able to generate significant returns from the sale of DVDs and international content licensing. While there are plans to build up its international streaming services (from a relatively low base), the BBC’s commercial businesses are unlikely to generate enough money to affect the dilemma facing the new government on what to do with the licence fee when the BBC’s current financial settlement ends on 31 December 2027.
The temptation will be for the government to defer reform of how the BBC is funded yet again, just as its predecessors have done over the last couple of decades. However, the erosion of income from younger households choosing to not watch broadcast television to stop paying the licence fee, and the likely consolidation of streaming services into a handful of global online ‘broadcasters’ that will dominate the market, is likely to make avoiding this conundrum that much more difficult this time around.
For more information, read the BBC annual report and accounts 2023/24 and the December 2022 House of Lords Communications and Digital Committee report on future funding of the BBC.