My chart for ICAEW this week divides some very big numbers for the public finances by an estimated 69.2m people living in the UK to highlight how UK public spending is now in excess of £1,500 per person per month.
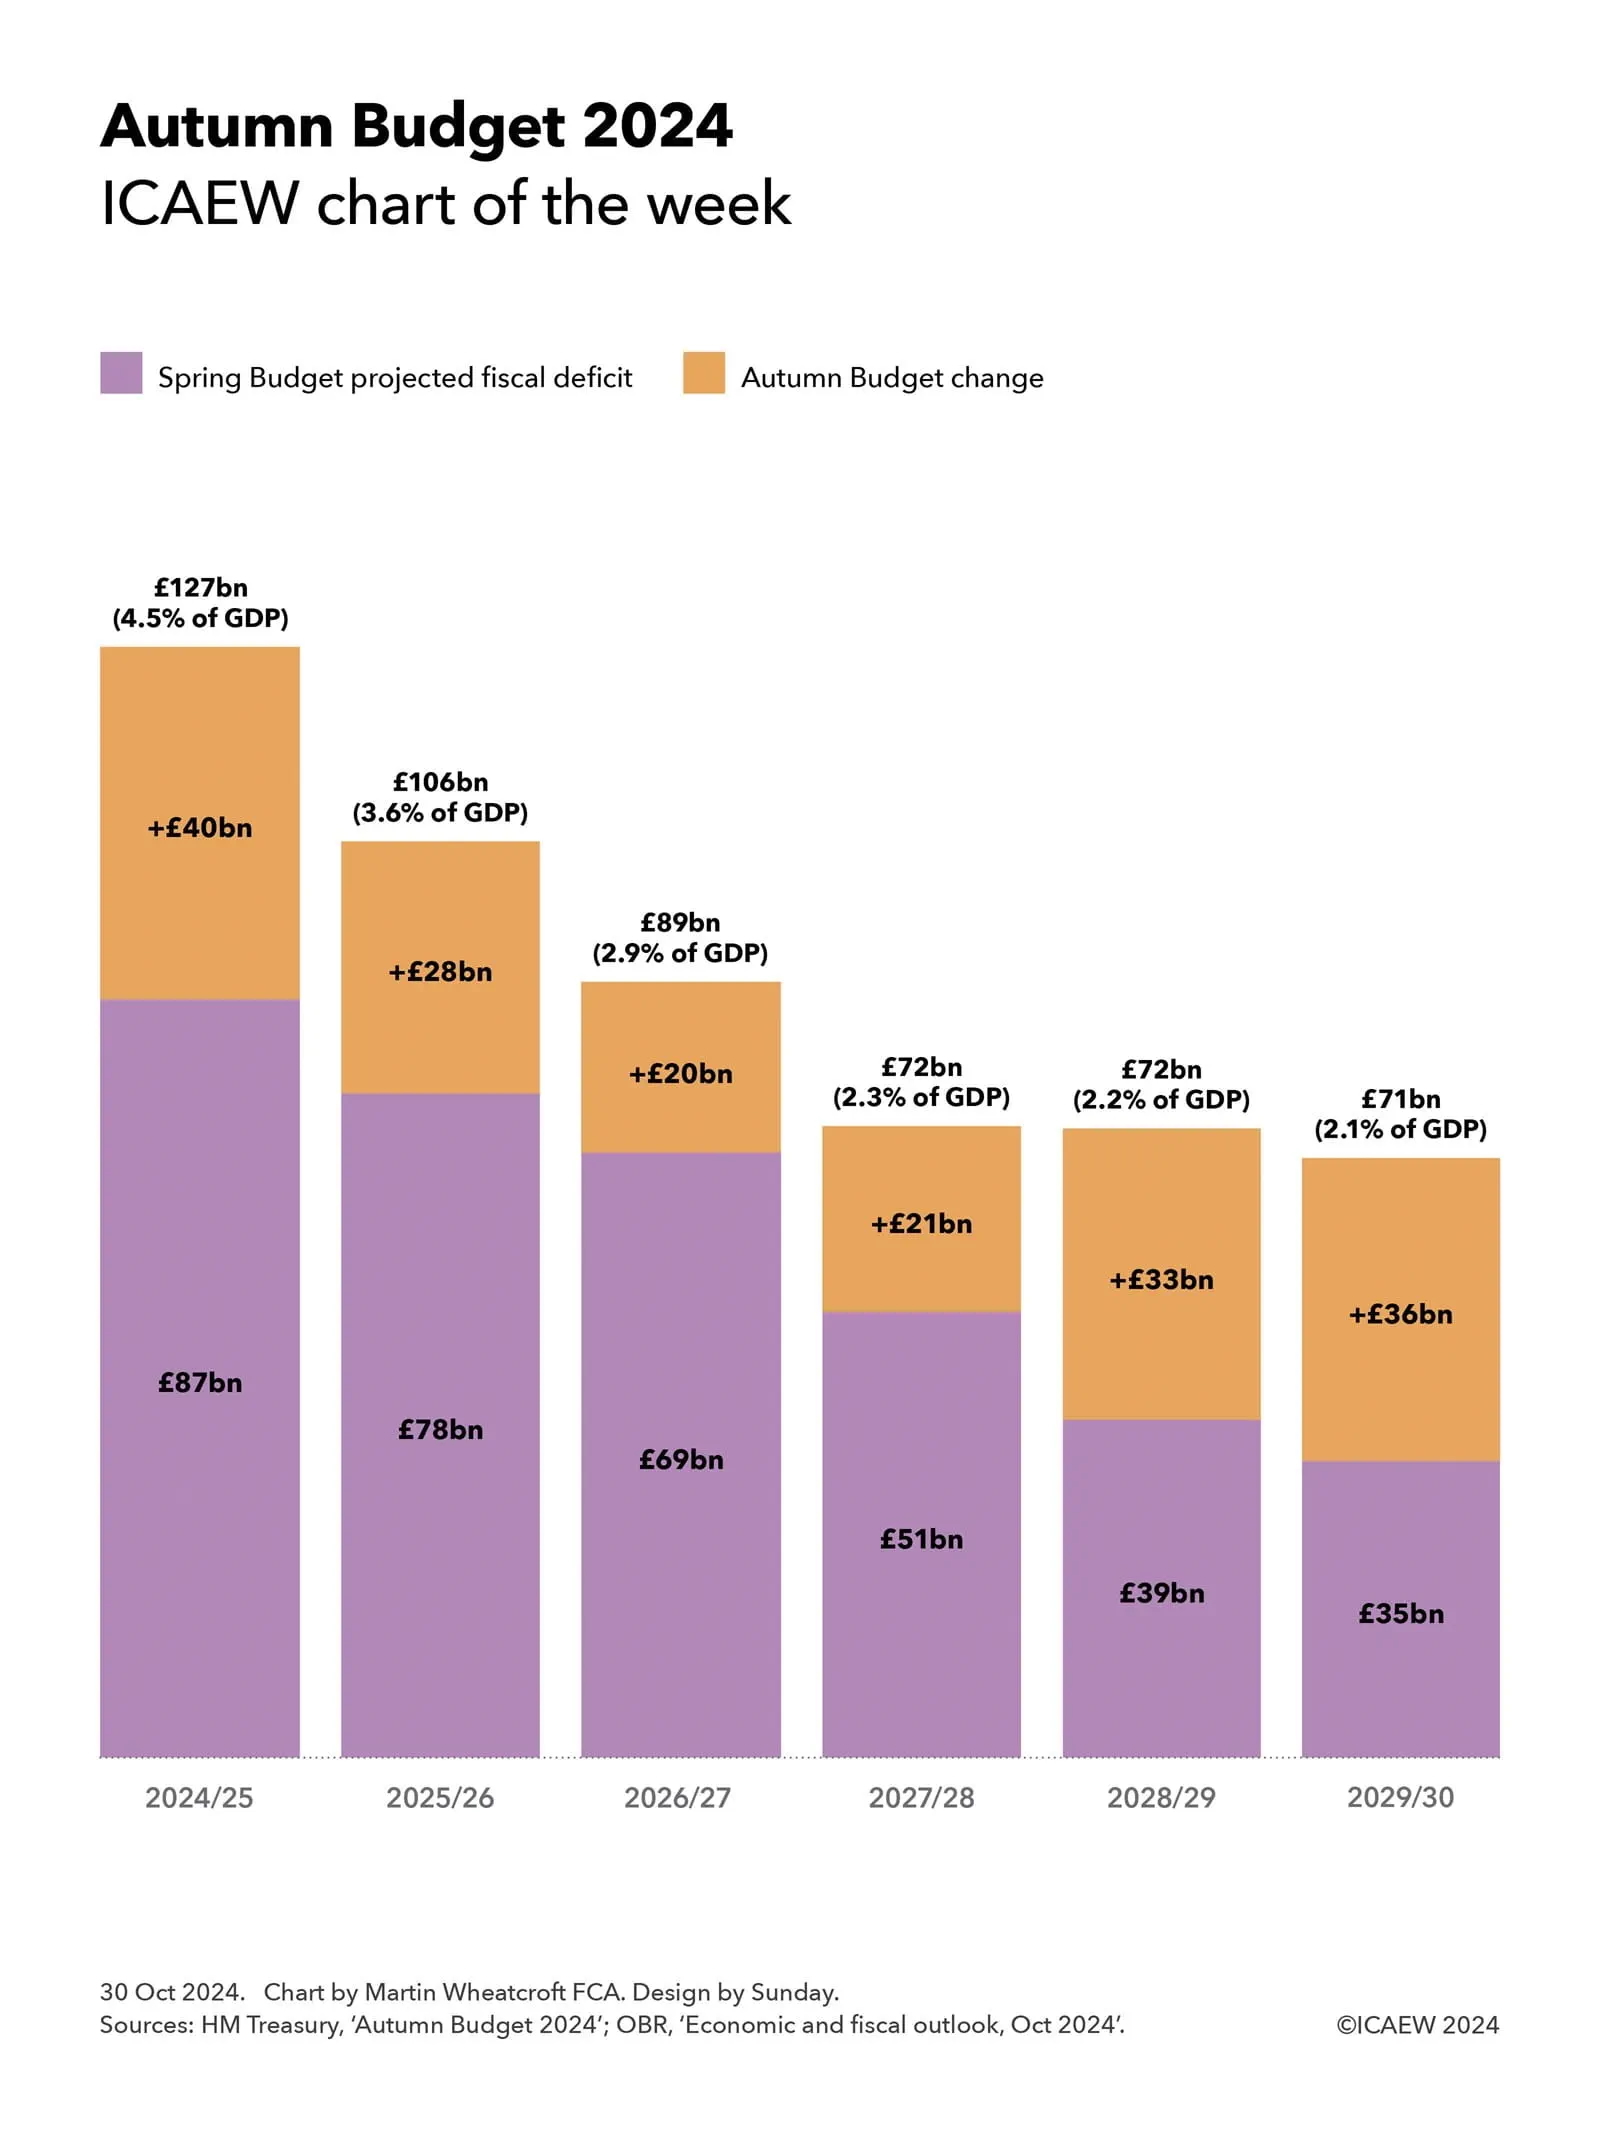
According to the Autumn Budget 2024, the UK public sector expects to bring in £1,149bn and spend £1,276bn in the financial year ended 31 March 2025 (2024/25). At more than a trillion pounds a year in each case, these are very big numbers that can be difficult to comprehend.
My chart of the week attempts to make these numbers more understandable by averaging them over an estimated UK population of 69.2m for the current financial year and dividing them by 12 to arrive at per person per month equivalents (rounded to the nearest £5).
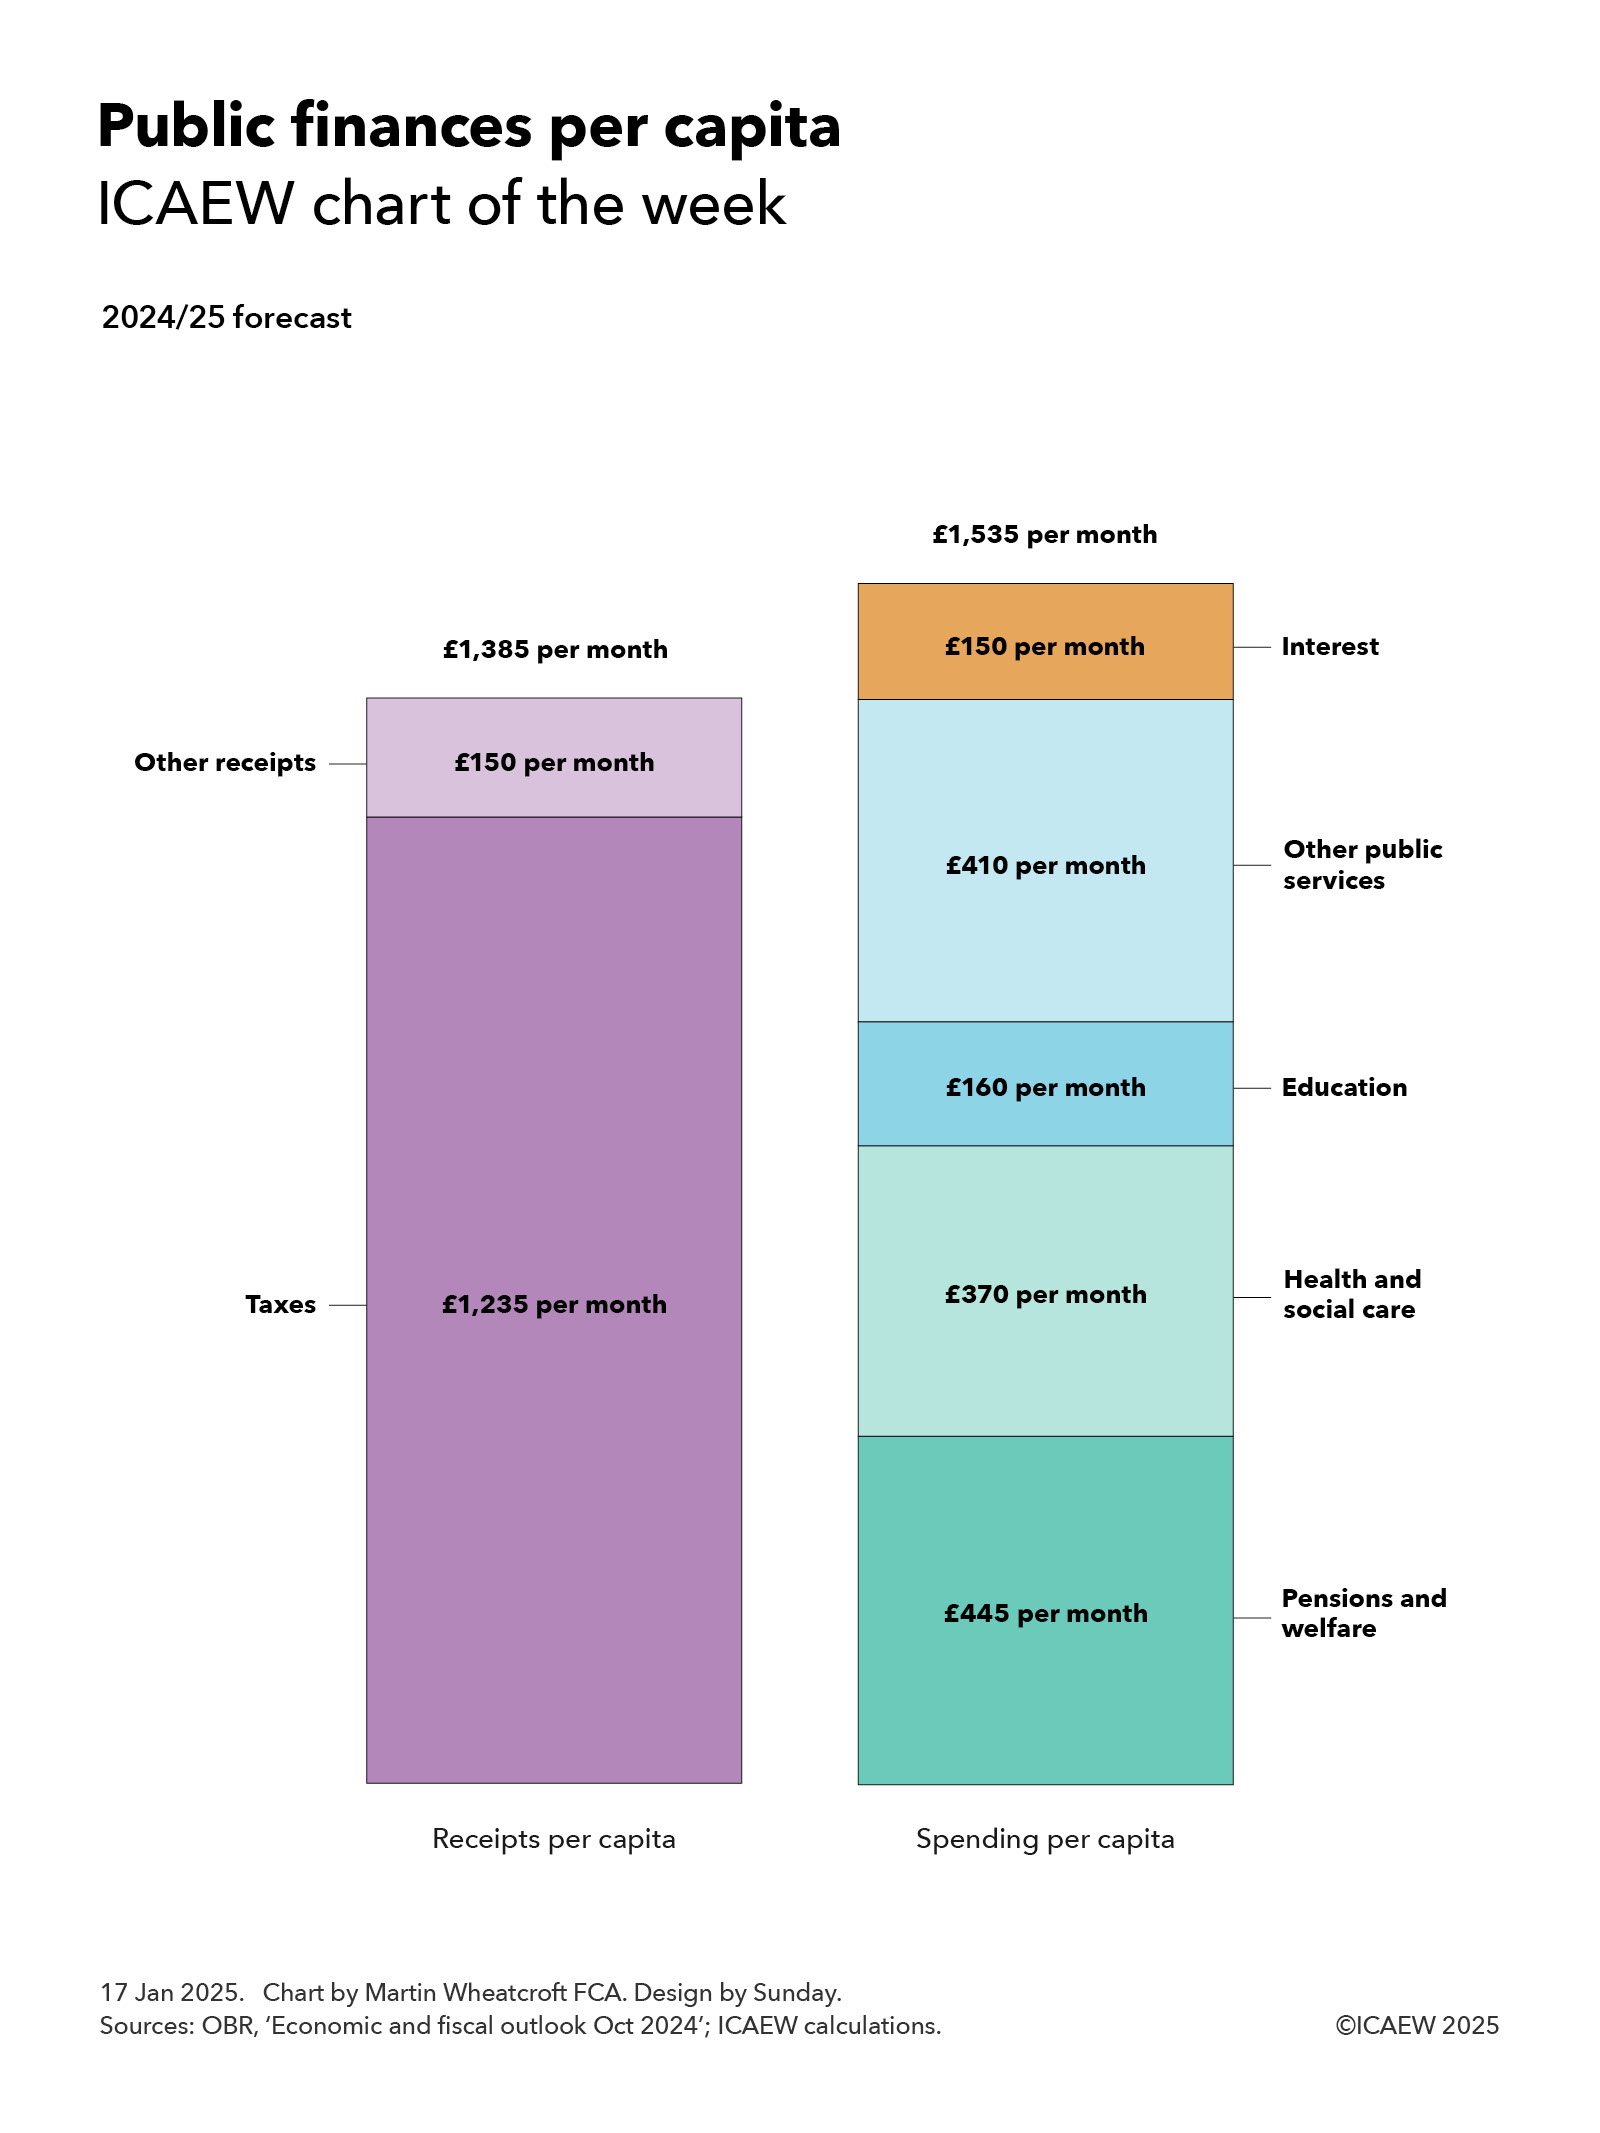
On this basis, total receipts are expected to average £1,385 per month for each person living in the UK in 2024/25, comprising £1,235 a month from tax receipts (£1,025bn in total) and £150 a month in other receipts (£124bn).
Not shown in the chart is the approximately £940 per person per month on average – just over two-thirds of total receipts – that comes from the top five taxes: income tax £375 per month, VAT £245 per month, employer national insurance £135 per month, corporation tax £120 per month, and employee national insurance £65 per month.
Public spending is expected to average £1,535 per person per month in 2024/25, comprising approximately £445 per month on pensions and welfare, £370 per month on health and social care, £160 per month on education, £410 per month on other public services, and £150 per month on debt interest, based on forecast total spending in 2024/25 of £370bn, £307bn, £134bn, £340bn, and £125bn respectively.
Spending on welfare
Welfare spending includes (but is not limited to) approximately £170 per person per month to cover the cost of paying the state pension, around £105 per month to pay for universal credit (including housing benefit), and in the order of £75 per month to fund disability and illness benefits.
Per capita spending on health and social care comprises close to £290 per person per month on the NHS, £55 on social care and £25 on public health, health research and other health-related spending.
Education costs each of us an average of £160 per month, of which approximately £115 per month pays for schools, £35 funds university and higher education (including just over £10 for student loans that are not expected to be repaid) and around £10 per month goes on further education, training and other.
The £410 per month cost of other public services includes in the region of £85 per month on defence and security, approximately £75 per month on roads and railways, £65 on industry and agriculture, nearly £60 per month on public order and safety, £15 per month on dealing with waste, and around £10 per month on international development and aid. This leaves approximately £100 per month to pay for all the other services that central and local government provide, including 11p per person per month for the Royal Family and palaces.
These numbers are averages and of course the amounts individuals pay in taxes and receive either in pensions and welfare benefits or in public services will vary significantly. For example, while health and social care spend is £370 per month when spread over the whole population, average spending on teenagers and those in their 70s are estimated to be significantly different from each other at £130 per month and £700 per month respectively.
Forecast per capita taxes and other receipts of £1,385 per month fall short of planned public spending of £1,535 per month to give rise to an expected deficit of approximately £150 per month funded by borrowing, being £127bn in total in 2024/25, divided by the estimated population of 69.2m. As a consequence, public debt now exceeds £2.8tn, equivalent to just under £41,000 for each person living in the UK, or somewhere in the region of £98,000 per household.
Navigating the public finances can be difficult at the best of times, but it is often helpful to translate the huge numbers you hear on the news into per capita equivalents to make sense of them. £1bn when spread across the UK population works at being equivalent to just over £1.20 per month.