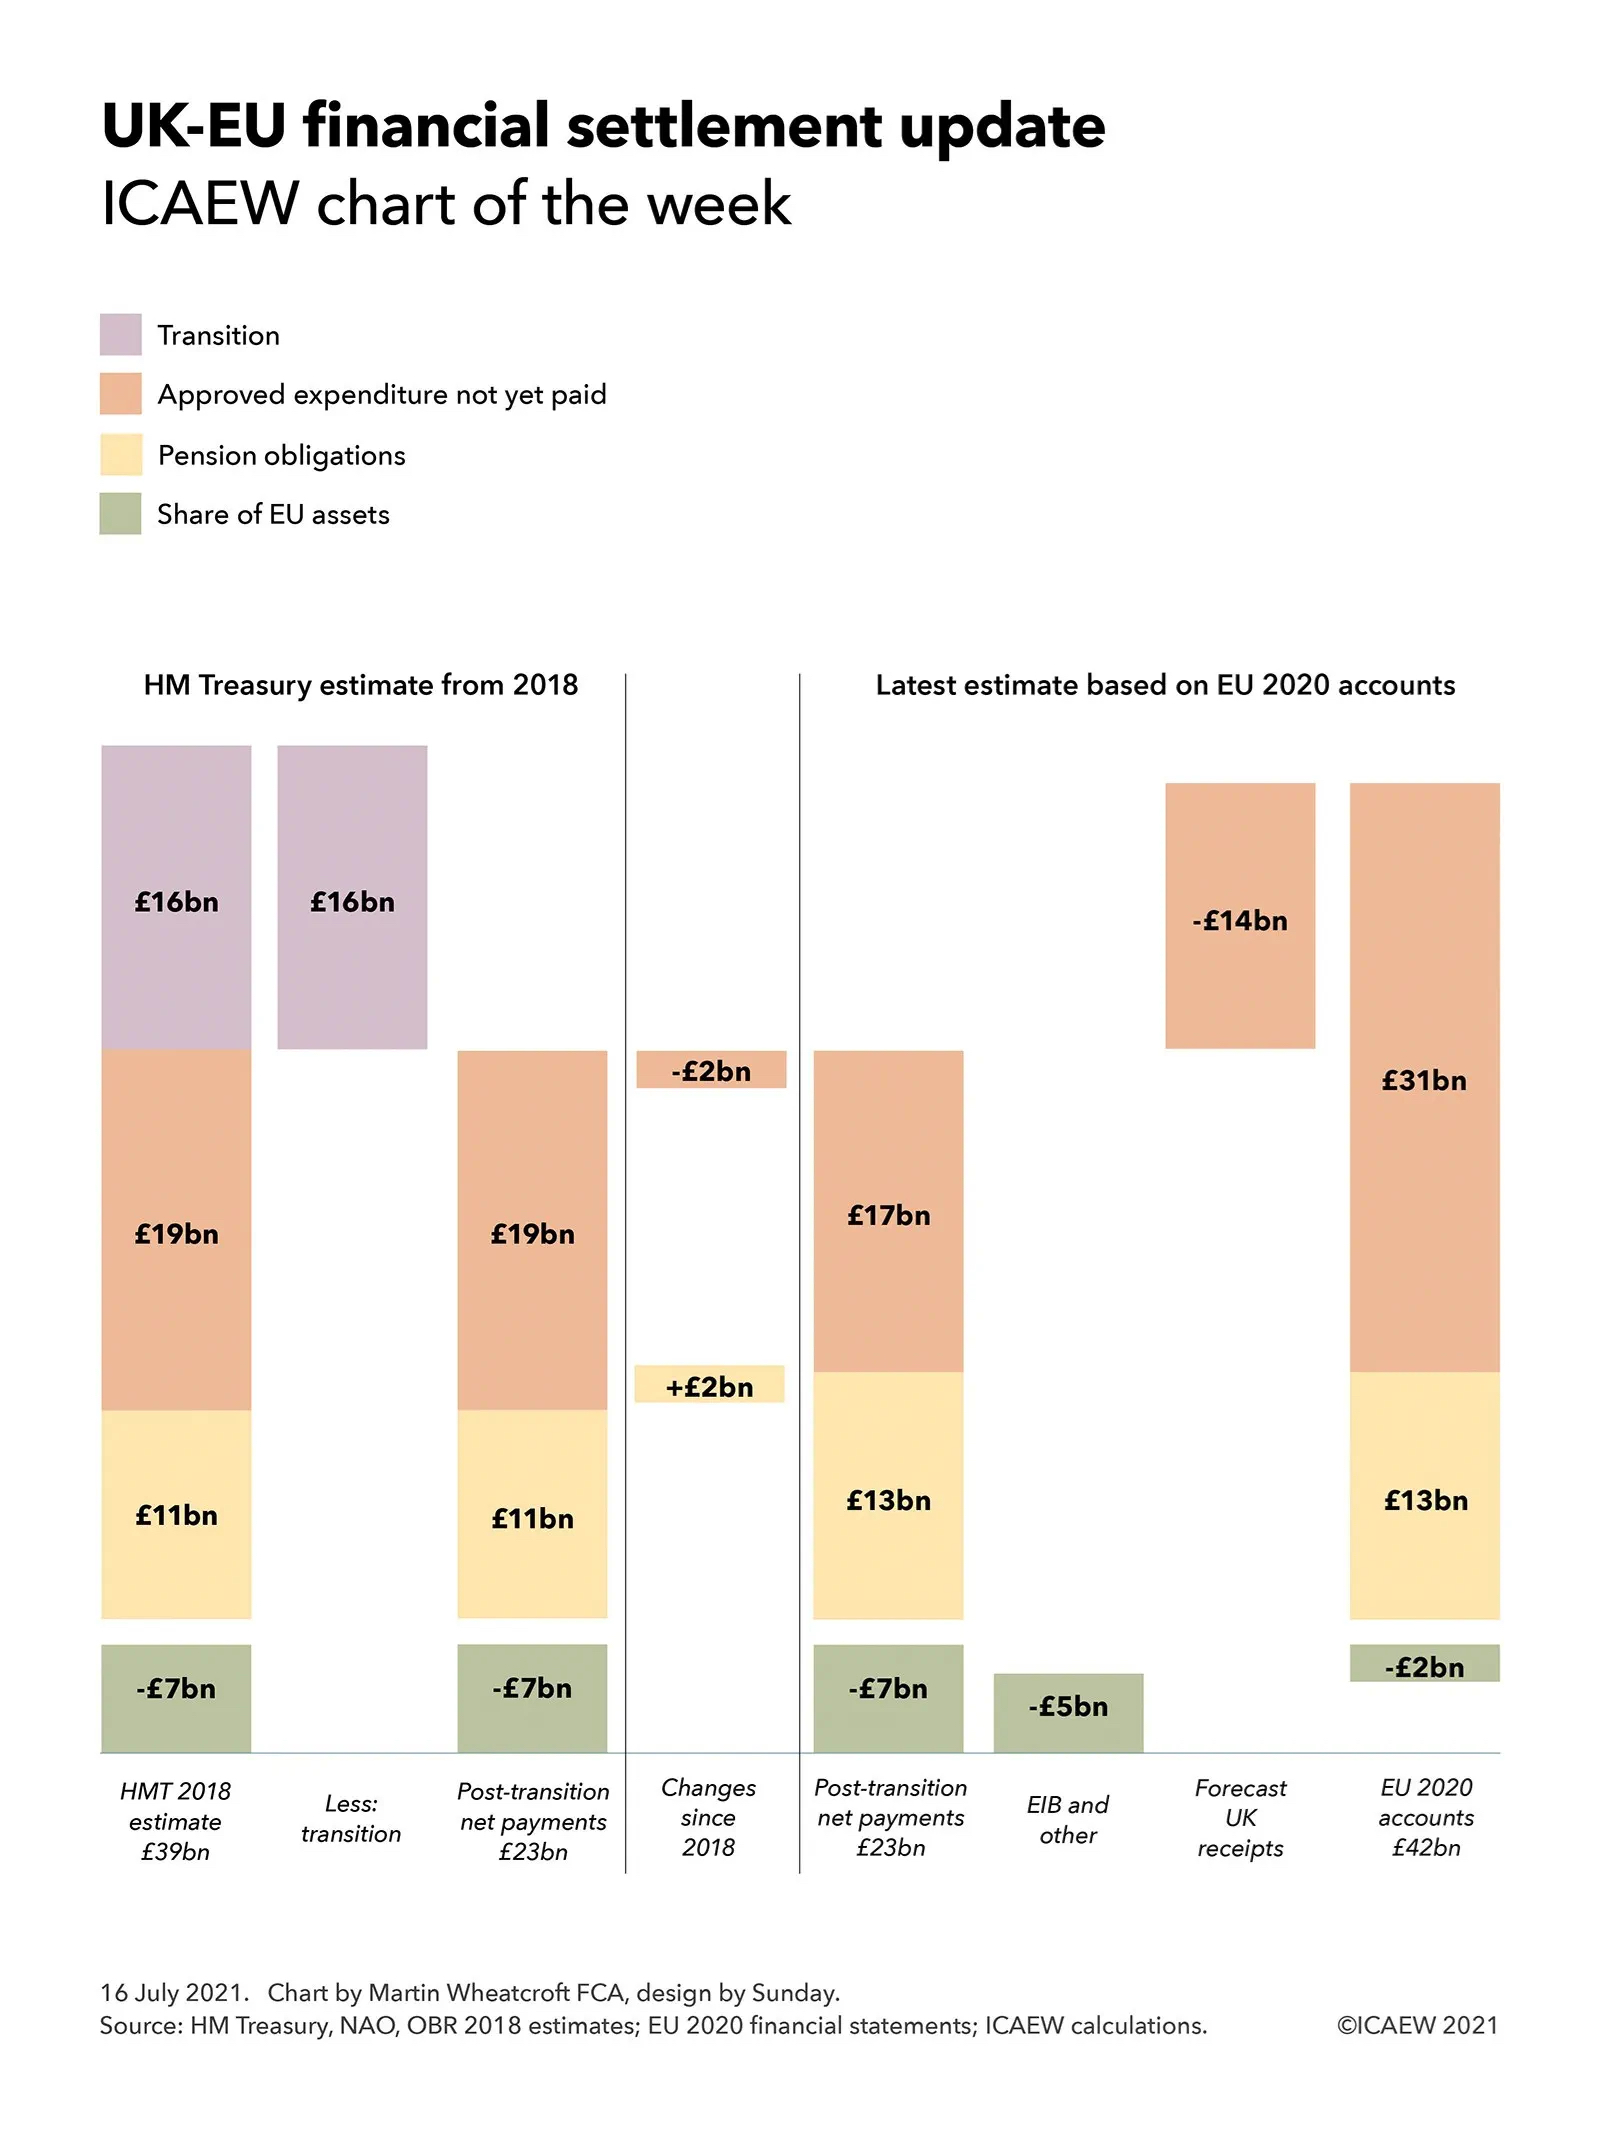
ICAEW chart of the week: US federal budget baseline projections

19 February 2021: Congressional Budget Office expects a decade of trillion-dollar deficits as the US public finances are hit by the pandemic.

The US Congressional Budget Office (CBO) recently updated its ten-year fiscal projections for the federal budget, providing the subject for this week’s #icaewchartoftheweek. 

As the chart illustrates, there was a shortfall of $3.1tn between revenues and spending by the federal government in the year ended 30 September 2020, with a projected deficit of $2.3tn in the current financial year and deficits ranging from $0.9tn to $1.9tn over the coming decade.

The CBO is at pains to stress that its projections are not a forecast of what will happen but instead, provide a baseline against which decisions can be assessed. This is particularly relevant at the moment as Congress debates a potential $1.9tn stimulus plan that would increase this year’s deficit significantly if passed.

On the path shown in the projections, the CBO calculates that debt held by the public will increase from $21.0tn (100% of GDP) in 2020 up to $35.3tn (107% of GDP) by 2031. Will policymakers in the US be comfortable in continuing to run with such a high level of debt compared with pre-pandemic levels of around 80% of GDP and a pre-financial crisis level of less than 40%?

The projections are based on assumed economic growth excluding inflation of 4.6% in the current financial year following on from a fall of 3.5% last year, with the recovery continuing into 2022 with growth of 2.9%. Economic growth over the following nine years to 2031 is expected to average around 1.9%. This is much lower than the average rate of growth experienced before the financial crisis just over a decade ago but may still prove optimistic given the potential for a recession at some point over the next ten years.

The UK counterpart to the CBO – the Office for Budget Responsibility (OBR) – is currently working its abacus quite hard on updating its five-year projections ready for the Budget on 3 March. The OBR’s projections will be extremely useful in understanding the near-term path in the UK’s public finances, including the effect of any tax and spending announcements that may be featured in the Budget. Unfortunately, they will be less useful than the CBO’s projections in that they are not expected to provide a refreshed baseline for the second half of the decade when the hard work of starting to repair the public finances is expected to take place.

This chart was originally published by ICAEW.

ICAEW chart of the week: CP Trans-Pacific Partnership

12 February 2021: The UK wrote to New Zealand at the start of this month formally requesting permission to apply for membership of the Comprehensive and Progressive Trans-Pacific Partnership. What is the CPTPP and what opportunities would joining provide to the UK?

The #icaewchartoftheweek is on the UK’s application to join the Comprehensive and Progressive Trans-Pacific Partnership (CPTPP), a group of eleven countries on the other side of the world. This trade organisation was established to improve trade links between countries surrounding the Pacific, reducing trade barriers between the countries involved and aligning regulations in areas such as intellectual property. 

It is sometimes described as the third largest free-trade area in the world, after the US-Mexico-Canada Free Trade Agreement (USMCA, formerly NAFTA) and the EU-EEA-Switzerland Common Market, but it is important to understand that it is much less integrated than a customs union (with shared tariffs), a common market (with fuller regulatory alignment) or an economic union (such as the highly integrated EU Single Market with unified standards and regulations). 

According to IMF forecasts for 2021, Japan is the largest economy in the CPTPP with GDP of £3,815bn, while Brunei is the smallest with GDP of £9bn. The other members are Canada (£1,335bn), Australia (£1,125bn), Mexico (£890bn), Malaysia (£280bn), Vietnam (£275bn), Singapore (£270bn), Chile (£220bn), New Zealand (£165bn) and Peru (£150bn). This compares with a forecast of £2,180bn for UK GDP in 2021.

Membership is not exclusive, with CPTPP members involved in a number of other multilateral free trade agreements. Canada and Mexico are also members of USMCA. Malaysia, Singapore, Vietnam and Brunei are members of the 10-nation Association of South East Asian Nations (ASEAN), which in turn has free trade agreements with Japan, Australia and New Zealand, China, India and South Korea. Mexico, Peru and Chile are members of the four-nation Pacific Alliance with Columbia. In addition, China is leading the formation of the Regional Comprehensive Economic Partnership which includes all of the non-Americas members of the CPTPP in addition to China, South Korea and the other members of ASEAN.

The CPTPP replaced the original proposal for a Trans-Pacific Partnership (TPP) that would have included the US, but the remaining nations decided that it was still worthwhile pursuing a revised trade arrangement even after the US withdrew its application four years ago. A new administration could see the USA change its mind and seek to join the CPTPP after all.

Why does the UK want to join a trade pact on the other side of the world? The immediate trade benefits are likely to be relatively modest given the distances involved and which are likely to be secured through bilateral trade agreements already under discussion.

One reason is likely to be geo-political, as membership would strengthen relationships with allies in the Pacific, advancing the UK Government’s ‘global Britain’ agenda. There may also be an advantage in being directly involved in the development of international trade policy in the Pacific region which contains the two largest individual economies in the world (the US and China), potentially influencing trade policy across the planet.

Of course, part of the motivation might be less about trade in the Pacific and more about trade across the Atlantic. After all, if the US were to join the CPTPP, the UK’s membership might provide a base from which to eventually develop a more comprehensive bilateral free trade agreement. This could fulfil a key strategic objective of improving trade ties with the USA by going around the world, albeit in a lot more than 80 days!

This chart was originally published by ICAEW.

ICAEW chart of the week: Japan Budget 2021-22

5 February 2021: This week’s chart focuses on the Japanese economy as it seeks to return to relative fiscal normality in the year commencing 1 April 2021, following multiple supplementary budgets in its current financial year.

The #icaewchartoftheweek is full of anticipation for the UK Budget next month and so decided to take a look at how the Japanese central government plans to borrow ¥28.9tn (£205bn) in the year to 31 March 2022. Together with taxes and other income of ¥63.0tn (£450bn), this will be used to fund ¥86.9tn (£620bn) of spending and a ¥5.0tn (£35bn) COVID-19 contingency.

This follows a significant amount of borrowing in the current financial year, with the 2020-21 Budget amended by three supplementary Budgets in response to the coronavirus pandemic. If temporary and special measures are excluded, the 2021-22 Budget reflects a 0.7% increase in spending over the previous year’s ¥86.3tn (£615bn) pre-COVID budget.

Spending comprises ¥35.8tn (£255bn) on social security, central government spending of ¥26.1tn (£185bn), and other spending of ¥16.5tn (£120bn), with the latter principally relating to transfers and grants to local government. Interest of ¥8.5tn (£60bn) is only marginally higher than the previous year’s ¥8.3tn, despite a 9% increase in the level of government bonds outstanding to ¥990tn (£7tn) – equivalent to 177% of GDP – at March 2022.

Borrowing has increased over pre-pandemic levels, with net borrowing of ¥28.9tn (£205bn) in 2021-22 compared with the 2020-21 pre-pandemic budget of ¥18.0tn (£130bn, not shown in the chart). This is principally driven by a 10% decline in anticipated income, with taxes and other income of ¥63.0tn (£450bn) falling from the ¥70.1tn (£500bn) originally budgeted for the current year (but not actually received).

The chart does not include the substantial amounts of taxation raised and spent by its 47 regional prefectures and so does not provide a complete fiscal picture for Japan. However, it does provide an indication of how the Japanese public finances have been able to respond to the pandemic.

The Japanese government will be hoping that there will be no need for supplementary Budgets in the coming financial year, as no doubt will UK Chancellor Rishi Sunak as he prepares for his government’s Budget on 3 March.

This chart was originally published by ICAEW.

ICAEW chart of the week: IMF world economic outlook update

29 January 2021: The UK economy is expected to shrink over the three years from 2020 to 2022, compared with flat growth in the Eurozone, modest growth by the USA and relatively strong growth by China.

The IMF released updated economic forecasts this week, estimating the world economy shrank by 3.5% in 2020 with output projected to increase by 5.5% in 2021 and 4.2% in 2022. World output over the three years is now expected to see an average annualised growth rate of 2.0%.

The UK’s economy has been one of the hardest hit by the coronavirus pandemic, shrinking by an estimated 10.0% in 2020. Growth prospects are weak, with forecasts of 4.5% and 5.0% in 2021 and 2022 respectively bringing the annualised average growth rate over three years to a negative 0.4%. This contrasts with the 1.4% average growth forecast last year in the Spring Budget 2020, meaning that the UK economy is now projected to be around 4.7% smaller in 2022 than pre-pandemic expectations.

Prospects for the Eurozone countries are also disappointing, with forecast growth in 2021 and 2022 expected to bring their economies back to where they started and substantially below where they might have expected to have been without COVID-19. 

The USA economy appears to be more resilient, with growth in 2021 expected to offset the decline experienced in 2020 by a modest amount, bringing annualised growth over the three years to 1.3%.

In contrast, China expects to see annualised growth of 5.3% as it recovers from much slower than normal growth in 2020 as a consequence of the pandemic. While this is relatively strong compared with most other countries, China itself will consider this to be a relatively modest level of growth compared to the recent past. 

IMF World Economic Outlook Update – summary and selected countries

  2020 2021 2022 Average
 World output (1) -3.5% +5.5% +4.2% +2.0%
 World growth at market exchange rates -3.8% +5.1% +3.8% +1.6%
 Emerging and developing economies -2.4% +6.3% +5.0% +2.9%
 Advanced economies -4.9% +4.3% +3.1% +0.8%
 Eurozone -7.2% +4.2% +3.6% +0.0%
 Argentina -10.4% +4.5% +2.7% -1,3%
 Australia -2.9% +3.5% +2.9% +1.1%
 Brazil -4.5% +3.6% +2.6% +0.5%
 Canada -5.5% +3.6% +4.1% +0.6%
 China +2.3% +8.1% +5.6% +5.3%
 Egypt (2) +3.6% +2.8% +5.5% +4.0%
 France -9.0% +5.5% +4.1% +0.0%
 Germany -5.4% +3.5% +3.1% +0.3%
 India (2) -8.0% +11.5% +6.8% +3.1%
 Indonesia -1.9% +4.8% +6.0% +2.9%
 Iran (2) -1.5% +3.0% +2.0% +1.1%
 Italy -9.2% +3.0% +3.6% -1.1%
 Japan -5.1% +3.1% +2.4% +0.1%
 Kazakhstan -2.7% +3.3% +3.6% +1.4%
 Korea -1.1% +3.1% +2.9% +1.6%
 Malaysia -5.8% +7.0% +6.0% +2.2%
 Mexico -8.5% +4.3% +2.5% -0.7%
 Netherlands -4.1% +3.0% +2.9% +0.5%
 Nigeria -3.2% +1.5% +2.5% +0.3%
 Pakistan (2) -0.4% +1.5% +4.0% +1.7%
 Philippines -9.6% +6.6% +6.5% +0.9%
 Poland -3.4% +2.7% +5.1% +1.4%
 Russia -3.6% +3.0% +3.9% +1.0%
 Saudi Arabia -3.9% +2.6% +4.0% +0.8%
 South Africa -7.5% +2.8% +1.4% -1.2%
 Spain -11.1% +5.9% +4.7% -0.5%
 Thailand -6.6% +2.7% +4.6% +0.1%
 Turkey +1.2% +6.0% +3.5% +3.5%
 UK -10.0% +4.5% +5.0% -0.4%
 USA -3.4% +5.1% +2.5% +1.3%

For more information, read the IMF World Economic Outlook Update.

This chart was originally published by ICAEW.

ICAEW chart of the week: BBC finances

22 January 2020: The BBC’s finances are in the spotlight for this week’s chart, as it struggles to generate the income it needs to fund its public service broadcasting mission.

National Audit Office report out this week on the BBC’s strategic financial management highlights the financial pressures facing the BBC as it seeks to deliver on its universal public service broadcasting obligation in the face of a rapidly changing media landscape.

The #icaewchartoftheweek illustrates how the BBC generated revenue of £4.9bn in the year ended 31 March 2020. This is less than the £9bn or so generated by Sky in the UK & Ireland each year, but more than ITV’s £3bn or Channel 4’s £1bn. 

The principal source of income is the TV licence fee, which generated £3.2bn in 2019-20 from 21.2m households. This excludes 4.5m households that received free licences, with the government providing £253m to cover this in addition to an £87m grant for the World Service. Other income generated by the public service broadcasting arm amounted to £0.2bn, while BBC Studios and other commercial activities had external revenues of £1.2bn.

Expenditure of £5.0bn included £4.0bn incurred on public service broadcasting, paying for eight TV channels and 60 radio stations in the UK, radio services around the world in more than 40 languages and extensive online services – most notably BBC iPlayer. 

The BBC’s domestic TV and radio channels cost £1,609m and £494m respectively, while £238m was spent on BBC Online and £315m on the BBC World Service, of which £228m was funded from the licence fee. £204m was incurred on other services (including a contribution to S4C), while distribution, support and other costs incurred amounted to £1,070m, excluding £119m of licence fee collection costs.

A colour TV licence in 2019-20 cost £154.50, equivalent to £12.88 per month and the BBC estimates that £6.83, £2.22, £1.24 and £1.24 of each licence fee went on TV, radio, BBC Online and the World Service respectively, while £1.35 paid for other services, distribution and support, licence fee collection and other costs.

Commercial activities contributed £176m to the bottom line, providing a small subsidy to licence fee payers, with attempts by the BBC to start a global subscription service for British TV content in partnership with ITV (Britbox) yet to bear much fruit. The principal commercial revenue stream remains sales by BBC Studios to broadcasters around the world, together with advertising from the seven UKTV channels now wholly owned by BBC Studios and declining amounts from DVD sales. 

At the bottom line, the BBC incurred a loss of £119m in 2019-20, following on from a loss of £69m in the previous year and a profit of £180m in 2017-18. An improved contribution from commercial activities was not enough to offset the cut in the government funding for free TV licences for over-75s, which fell from £656m in 2017-18 to £253m in 2019-20. This funding has now ceased and from 1 August 2020 the BBC reintroduced licence fees for around three million over-75s households, retaining free licences for 1.5m or so over-75s households receiving pension credit (a welfare benefit for pensioners on low incomes).

There is a lot of debate both inside and outside the BBC about the future of the licence fee model and whether it can survive in a landscape of global streaming services. As it approaches its 100th anniversary in October 2022, the BBC will be hoping it can find a way to extend its public service broadcasting mission for a second century.

This chart was originally published by ICAEW.

ICAEW chart of the week: 40 years of technology

18 December 2020: Our last chart this year takes a look at how technology has advanced over the last forty years, using the number of transistors in central processing unit microprocessors as a proxy for technological advancement.

Transistors on chips: 2020 Apple M1 16bn, 2010 Intel Xeon 2.3bn, 2000 Intel Pentium IV 42m, 1990 Motorola 68040 1.2m and 1980 Motorola 68000 68,000.

As we look back over the course of a difficult year, the contribution of technology to keeping the economy working has become apparent. Working from home instead of the office, joining video calls instead of in-person meetings and collaborating using online tools have made it possible for most businesses to continue to operate, albeit perhaps not quite as normal. Similarly, consumers have been able to turn to online retail, streaming services and cashless technology to cope with closed stores and shuttered entertainment venues during lockdowns and tiered restrictions.

This has only been possible as a consequence of huge advancements in technology over the past forty years, with the arrival of affordable personal computers in the 1980s, mobile phones in the 1990s, practical laptops and broadband connections in the 2000s, and smartphones and tablets in the 2010s.

We have used the number of transistors in central processing unit (CPU) microprocessors as a proxy for technological advancement in the #icaewchartoftheweek, but of course there have been many other advancements that have been just as significant, from processing capabilities, memory size, data storage, video quality and broadband speeds.

Back in 1980, the Motorola 68000 chip with 68,000 transistors was the leading chip. It was originally used in high-end business computers before lower production costs enabled it to be included in the original Apple Macintosh launched in 1984. That first Macintosh had separate chips to provide 64K of read-only-memory (ROM), 128k of random-access memory (RAM), a built-in 400KB floppy disk drive and 512 x 342 monochrome display.

A decade later, Intel had caught up with Motorola in chip design, with the Intel 80486 containing 1,180,235 transistors, matching Motorola’s 68040 chip that contained approximately 1.2 million transistors. The Intel 80486 was used in many IBM-compatible PCs while the Motorola 68040 was used in the Commodore Amiga 4000 and HP Series 400 desktops.

Intel was the leading chip-maker in 2000 with the Pentium series of microprocessors being the core of many PCs, albeit against strong competition from AMD’s Athlon x86 compatible CPUs. The Pentium 4 had 42 million transistors, while by 2010, Intel had taken over from Motorola in Apple’s range of computers, although its Xeon series of chips (with 2.3 million transistors in 2010) was primarily used in high-end workstations and servers rather than in desktops or laptops.

In 2020, Apple has started to replace Intel in its computers with the launch of its ARM-based M1 chip. This has 16 billion transistors, more than 235,000 times as many as there were in the leading edge Motorola 68000 of 40 years ago. Processing power and capability is expected to continue to expand: for example, we didn’t have enough room on the chart to fit in AMD’s Epyc Rome microprocessor with 39.5billion transistors on a single chip.

The recently launched M1-based edition of the Apple MacBook Air has a specification that would unimaginable to the personal computer owner of four decades past, with a base configuration containing 8Gb of memory (62,500 times as much RAM as the original Macintosh desktop), 256 GB of storage (640,000 times) and a 2560 x 1600 colour display. 

Our ability to cope with the pandemic would have been much harder even a mere decade ago when smartphones were only just emerging, let alone if we had been back in the world of dial-up modems and fax machines of 40 years ago. This demonstrates just how much technology has improved our ability to deal with a global crisis such as the coronavirus pandemic.

The #icaewchartoftheweek is taking a break for a couple of weeks in order to enjoy socially-distanced Christmas and New Year celebrations and will be returning on 8 January 2021. After such a difficult year, we hope you will be able to take some time off to recharge and return to your home-office (and eventually your actual office) energised for what we hope will be a much improved 2021!

This chart was originally published by ICAEW.

ICAEW chart of the week: Government bond yields

11 December 2020: Ultra-low or negative yields provide governments with an opportunity to borrow extremely cheaply, but what will happen if and when interest rates rise?

Government 10-year bond yields

Germany -0.61%, Switzerland -0.59%, Netherlands -0.53%, France -0.36%, Portugal -0.02%, Japan +0.01%, Spain +0.02%, UK +0.26%, Italy +0.58%, Greece +0.60%, Canada +0.76%, New Zealand +0.91%, USA +0.95%, Australia +1.02%

On 9 December, the benchmark ten-year government bond yield for major western economies ranged from -0.61% for investors in German Bunds through to 0.95% for US Treasury Bonds and 1.02% for Australia Government Bonds, as illustrated in the #icaewchartoftheweek.

One of the more astonishing developments of the last decade or so has been the arrival of an era of ultra-low or negative interest rates, even as governments have borrowed massive sums of money to finance their activities. This is not only a consequence of weak economic conditions and the slowing of productivity-led growth, but it has also been driven by the monetary policy actions of central banks through quantitative easing operations that have driven down yields by buying long-term fixed interest rate government bonds in exchange for short-term variable rate central bank deposits.

For bond investors this has been a wild ride, with the value of existing bonds sky-rocketing as central banks have come calling to buy a proportion of their holdings, crystallising their gains. The downside is the extremely low yields available to debt investors on fresh purchases of government bonds, which in some cases involve paying governments for the privilege of doing so.

Yields vary according to maturity, with yields on UK gilts ranging from -0.08% on two-year gilts through to 0.26% for 10-year gilts (as shown in the chart) up to 0.81% on 30-year gilts. In practice, the UK issues debt with an average maturity between 15 and 20 years, so the current average cost of its financing is higher than that shown in the chart at between 0.48% and 0.77% being the yields on 15-year and 20-year gilts respectively. This has the benefit of locking in low interest rates for longer, in contrast with most of the other countries shown that tend to issue debt with an average maturity of less than ten years.

Quantitative easing complicates the picture, as by repurchasing a significant proportion of government debt and swapping it for central bank deposits, central banks have reversed the security of fixed interest rates locked in to maturity with a variable rate exposure that will hit the interest line immediately if rates change. 

In theory, this should not be a problem, as higher interest rates are most likely to accompany stronger economic growth and hence higher tax revenues with which to pay the resultant higher debt interest bills, but in practice treasury ministers are not so sanguine. In leveraging public balance sheets to finance their responses to COVID-19 – on top of the legacy of debt from the financial crisis – governments have significantly increased their exposure to movements in interest rates, just as other fiscal challenges are growing more pressing.

Expect to hear a lot more over the coming decade about the resilience of public finances as governments seek to reduce gearing and reduce their vulnerability to the next unexpected crisis, whenever that may occur.

This chart was originally published on the ICAEW website.

ICAEW chart of the week: UK trade in goods

With less than a month to go before the UK leaves the EU Single Market and Customs Union, trade is high on the agenda as negotiations between the UK and the EU go down to the wire.

UK trade in goods in the year to September 2020: exports £338bn & imports £420bn

EU: £153bn & £230bn
Continuity deals: £49bn & £43bn
USA: £53bn & £38bn
China: £32bn & £54bn
Other: £51bn & £54bn

The #icaewchartoftheweek this week is on international trade, illustrating how exports and imports of goods amounted to £338bn and £420bn respectively in the year to 30 September 2020. This excludes £289bn and £181bn of services exports and imports over the same period that are also extremely important, but which are not the principal subjects of the free trade deal currently being negotiated.

The UK’s largest trading partnership for goods is with the members of the EU Customs Union (together with Turkey for non-agricultural products), with the UK exporting £153bn (45% of total goods exports) and importing £230bn (55% of total goods imports). 

This is followed by a further £49bn (15%) of exports to and £43bn (10%) of imports from 52 countries that have trade deals with the EU that the UK has been able to agree replacement trade arrangements with. These include Norway, Switzerland, Japan, South Korea, Canada and South Africa, with discussions underway to roll-over trade deals with a further 13 countries not included in these numbers, in particular with Singapore and Vietnam.

The UK’s two largest individual trading partners are the USA and China, where the UK will continue to trade on World Trade Organisation (WTO) terms. The UK exported £53bn (16%) of goods to the USA and imported £38bn (9%) in the year to September, while it exported £32bn (9%) to China and imported £54bn (13%).

The balance of goods trade, comprising exports of £51bn (15%) and imports of £54bn (13%), is with over 130 other countries and territories where the UK does not have a trade deal in place for after 1 January 2021, including India, Russia, Vietnam, Taiwan, the UAE, Saudi Arabia, Qatar, Thailand, Singapore, Australia, Malaysia and Nigeria.

Both exports and imports of goods have reduced in the year to September 2020 compared with a year previously, with exports down 7% and imports down 18%. The principal driver of the fall is the coronavirus pandemic, although reconfiguration of cross-border supply chains ahead of the end of the transition period may also be a factor.

Although global trade is expected to pick up in 2021 once covid-19 vaccines are widely available, there is significant uncertainty as to the effect on trade of the UK’s departure from the Single Market and Customs Union – with or without a deal. Either way, increased trade frictions are likely to have at least some impact, while the imposition of tariffs in the event of no deal could cause significant additional problems for key sectors such as car manufacturing and agriculture.

The size and closeness of the EU economy means that it will continue to be the most important trading partner for the UK whatever is agreed. If only we knew on what terms we are going to be trading in less than a month’s time and what the major changes that are coming in January will mean for the future!

This chart was originally published on the ICAEW website.

ICAEW chart of the week: Spending Review 2020

In the wake of the government’s Spending Review, this week’s chart focuses on the bigger picture and looks at the scale of public spending in relation to the size of the overall economy.

Spending Review 2020: Public spending as % of GDP

2019-20: Department spending 17.0% + other spending 12.3% + welfare 10.3% + covid 0.2% = 39.8%

2020-21: 19.3% + 13.3% + 11.5% + 12.2% = 56.3%

2021-22: 19.5% + 12.4% + 10.6% + 2.6% = 45.1%

2022-23: 19.2% + 12.2% + 10.6% = 42.0%

2023-24: 19.2% + 12.1% + 10.5% = 41.8%

2024-25: 19.3% + 12.1% + 10.5% = 41.9%

2025-26: Departmental spending 19.3% + other spending 12.0% + welfare 10.5% = 41.8%

There was a lot of substance in the Spending Review 2020 announced this week, with a lot more going on under the surface with – for example – the launch of the National Infrastructure Strategy. However, we thought we would focus on the bigger picture for the #icaewchartoftheweek and to look at the scale of public spending in relation to the size of the overall economy.

Of course, the current financial year has seen a massive expansion in the amount of public spending – up from £884bn or 39.8% of GDP of £2,218bn in 2019-20 to a revised budget of £1,165bn or 56.3% of GDP of £2,069bn. The combination of higher spending and a smaller economy this year makes for an eye-watering percentage.

Next financial year will see further COVID support measures adding to public spending, but the key takeaway from the chart is that public spending is expected to persist at around 42% of GDP from 2022-23 onwards, reflecting a permanently smaller economy following the pandemic combined with slightly higher spending in real terms. This is 2% higher than the just under 40% seen in 2019-20 and 3%-4% higher than the 38%-39% longer-run average.

Around half of the increase in departmental spending seen in the chart relates to capital investment in line with the government’s infrastructure plans, while the remainder relates to operational spending with more for health, education and defence being partially offset by the reduction in development spending and the one-off public sector pay freeze.

With scope for substantial reductions in public spending seen to be limited, there are two main routes for covering this increase in costs – economic growth to boost the size of the economy or higher taxes. The government will be hoping that its increase in capital investment will help to deliver on the former, but it appears increasingly likely that tax rises will be needed over the course of the coming decade.

This chart was originally published on the ICAEW website.

ICAEW chart of the week: Ireland Budget 2021

20 November 2020: The #icaewchartoftheweek takes a look at the Irish Government’s fiscal plans for 2021 and how it plans to tackle the twin headwinds of COVID and Brexit.

Ireland Budget 2021:

2019 Revenue £89bn, expenditure £87bn

2020 Revenue £84bn, expenditure £106bn

2021 Revenue £89bn, expenditure £109bn

The Irish Government held its Budget 2021 announcement last month, setting out how the coronavirus pandemic has damaged the public finances in 2020 and how it plans to help the economy recover in 2021.

There was a fiscal surplus of €2bn in 2019 with general government revenue of €89bn exceeding expenditure of €87bn, but the pandemic has squeezed revenues (expected to fall to €84bn in 2020) and increased spending (expected to increase to €106bn), resulting in an expected shortfall of €22bn this year. This is equivalent to 6.2% of GDP or 10.7% of Gross National Income (GNI).

General government revenues are forecast to recover to €89bn in 2021, well below the level they would have been without the pandemic. Although much of the emergency spending incurred in 2020 will not be repeated, the Irish Government still plans to increase total spending in 2021 to €109bn. This reflects social payments continuing to run at a higher level (€32bn in 2019, €39bn in 2020 and €38bn in 2021) and greater capital investment (€10bn, €12bn and €12bn), but mainly reflects extensive Brexit-related spending to soften the anticipated adverse economic impacts of increased trade frictions with the UK from 1 January 2021, as well as a €3bn COVID recovery fund intended to help the economy recover from the pandemic. 

As a consequence, the fiscal deficit in 2021 is forecast to be €20bn, 5.7% of GDP and 9.8% of GNI.

General government debt is expected to increase from €204bn at the end of 2019 to €219bn in December 2020 and €239bn in December 2021. This is equivalent to 57%, 63% and 67% of GDP which may not appear to be that high, but with a much wider gap between GDP and GNI than most countries, the debt-GNI ratios of 96%, 108% and 115% are much more of a concern.

Fortunately, interest costs in 2021 are expected to be around €1bn lower despite the significant increase in debt, reflecting the extremely low interest rates available to Ireland as a member of the Eurozone.

The uncertainties surrounding the Irish economy, the pandemic and Brexit mean that Ireland’s Department of Finance decided to publish a one-year economic and fiscal forecast this year instead of the normal five years. They will be hoping for clarity to emerge over the coming year!

This chart was originally published on the ICAEW website.