ICAEW chart of the week: Germany

My chart this week is on Germany, where a new ‘traffic light’ coalition government headed by Chancellor-designate Olaf Scholtz is poised to take charge of Europe’s most prosperous nation.

Map of Germany showing population of 83.2m by state or 'bundesländer': Nordrhein-Westfalen (North Rhine Westphalia) 17.9m, Bayern (Bavaria) 13.1m, Baden-Württemberg 11.1m, Niedersachsen (Lower Saxony) 8.0m, Hessen 6.3m, Rheinland-Pfalz (Rhineland Palatinate) 4.1m, Sachsen (Saxony) 4.1m, Berlin 3.7m, Schleswig-Holstein 2.9m, Brandenburg 2.5m, Sachsen-Anhalt (Saxony-Anhalt) 2.2m, Thüringen 2.1m, Hamburg 1.9m, Mecklenburg-Vorpommern 1.6m, Saarland 1.0m and Bremen 0.7m

With a population of 83.2m and a €3.4tn (£2.9tn) economy, Germany is the largest member of the European Union and the fourth biggest national economy in the world after the USA, China and Japan.

The formal agreement of a red-green-yellow ‘traffic light’ coalition between the centre-left Social Democratic Party (SPD), the Green Party and the liberal Free Democratic Party (FDP) means that Angela Merkel can finally retire as Chancellor to be replaced by SPD-leader Olaf Scholz, the current Vice-Chancellor and Finance Minister in the outgoing ‘Grand Coalition’.

According to the coalition agreement, which is still subject to ratification by the three parties, Olaf Scholtz will become the new Chancellor with the SPD filling six of the 15 federal ministries, the Green party filling five ministries and the FDP filling four. Green co-leaders Annalena Baerbock and Robert Habeck are expected to become Foreign Minister and Economy & Climate Change Minister respectively, while FDP leader Christian Lindner is expected to become Finance Minister.

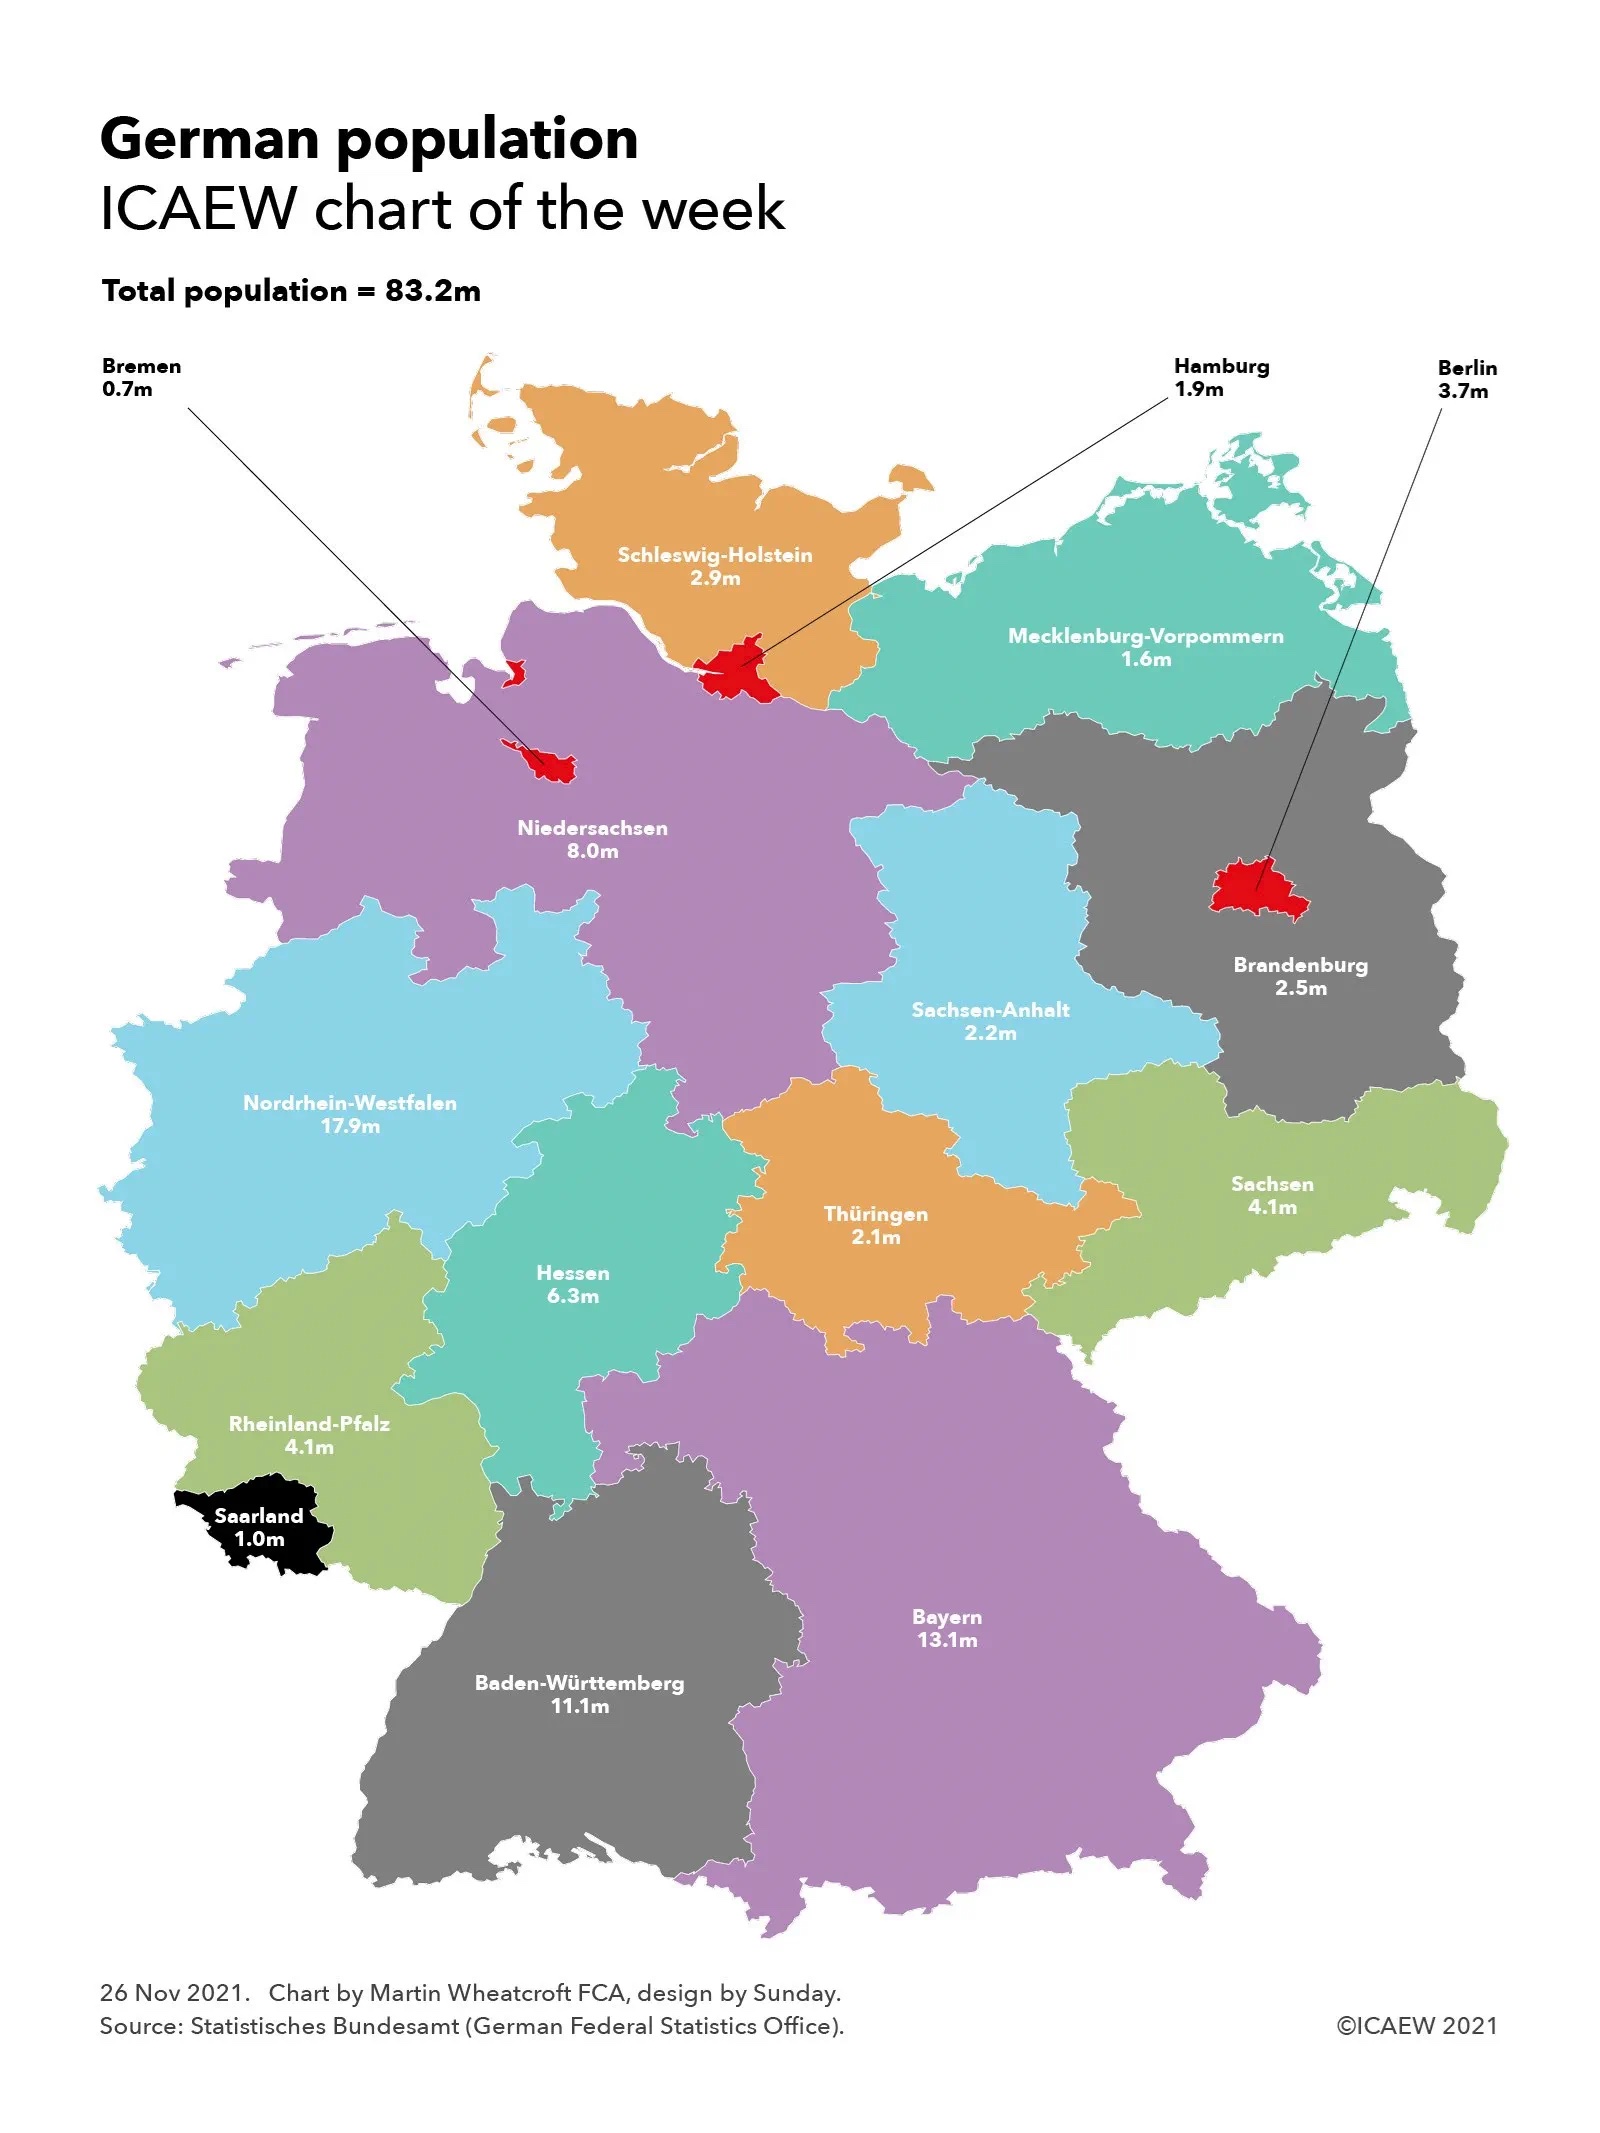
Despite running the most powerful country in Europe, the new coalition is only responsible for the federal government. As the chart illustrates, Germany has sixteen Bundesländer or federal states, comprising Nordrhein-Westfalen (North Rhine Westphalia) with 17.9m people, Bayern (Bavaria) with 13.1m, Baden-Württemberg with 11.1m, Niedersachsen (Lower Saxony) with 8.0m, Hessen with 6.3m, Rheinland-Pfalz (Rhineland Palatinate) and Sachsen (Saxony) each with 4.1m, the city-state of Berlin with 3.7m, Schleswig-Holstein with 2.9m, Brandenburg with 2.5m, Sachsen-Anhalt (Saxony-Anhalt) with 2.2m, Thüringen with 2.1m, the city-state of Hamburg with 1.9m, Mecklenburg-Vorpommern with 1.6m, Saarland with 1.0m and the city-state of Bremen with 0.7m.

The state governments are also run by coalitions. The now federal opposition Union parties (the Christian Democratic Union and the Bavarian Christian Social Union) lead two- or three-party coalitions in seven states, the SPD lead in seven states, the Greens in one state and Der Linke (the Left) in one state. With a proportional voting system at state and federal levels, coalition government is a way of life in Germany, with parties that are in government in one state being in opposition to each other in others.

Despite being the first three-party coalition at a federal level, with the more complicated negotiations that entails, the coalition agreement has been reached fairly ‘speedily’ by German standards – taking just over two months compared with the six months taken to agree the ‘Grand Coalition’ between the Union parties and the SPD following the last election in September 2017.

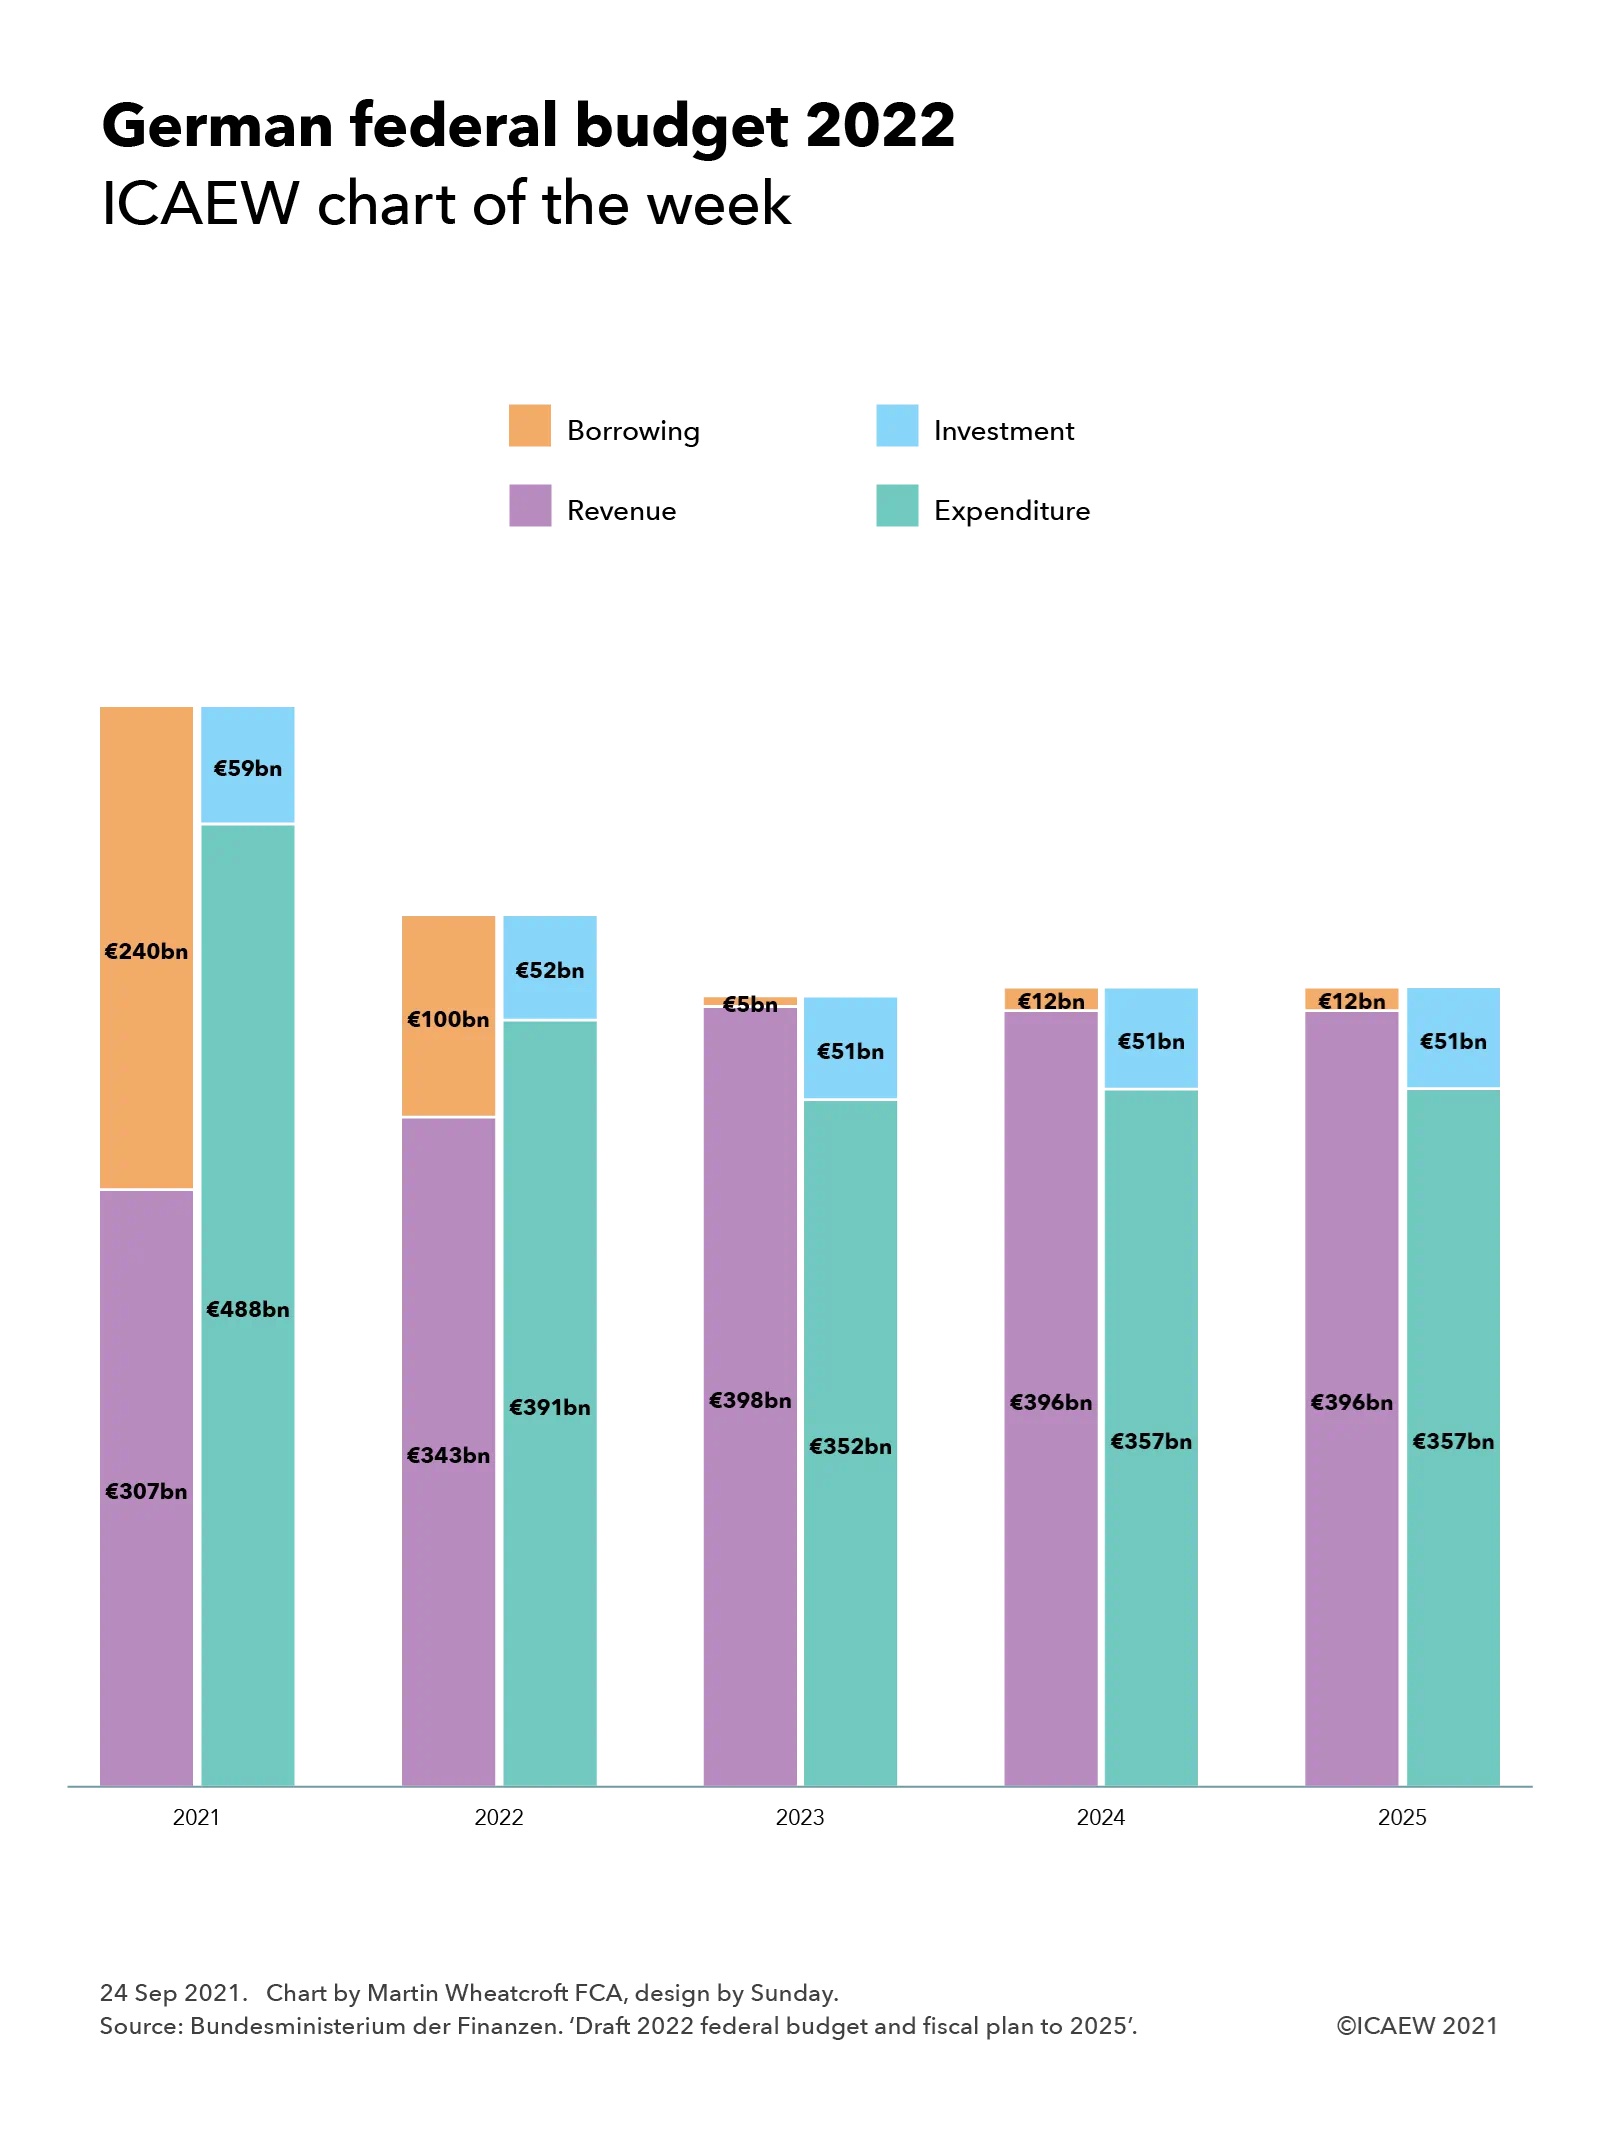
The inclusion of the Greens puts climate change at the top of the new government’s priorities, bringing forward the end of coal from 2038 to 2030 for example, while the inclusion of the fiscally prudent FDP will mean limited scope for new government borrowing. Other plans include raising the minimum wage, more defence spending, and legalising cannabis,

To read about the federal budget see my previous ICAEW chart of the week: German federal budget 2022.

This chart was originally published by ICAEW.

ICAEW chart of the week: Consumer Prices Index

My chart this week looks at how price rises have accelerated over the last few months, with consumer price inflation reaching 4.2% in October, the highest it has been for a decade.

Line chart showing how the Consumer Prices Index has increased from 106.7 in Oct 2018 to 107/6 in Apr 2019 to 108.3 in Oct 2019 (a +1.5% increase over a year earlier) to 108.5 in Apr 2020 to 109.1 in Oct 2020 (up 0.7% over the year) to 110.1 in Apr 2021 to 113.6 in Oct 2021 (a 4.2% annual increase).

The Office for National Statistics published its latest estimates for inflation on Wednesday 17 November, reporting a 12-month increase in the Consumer Prices Index (CPI) of 4.2% and a 12-month increase in the Consumer Prices Index including owner occupiers’ house costs (CPIH) of 3.8%, both of which are the highest they have been since November 2011 when CPI was 4.8% and CPIH was 4.1%.

CPI and CPIH are calculated using a basket of goods and services to assess the level of inflation experienced by consumers, with the current index set to 100 in July 2015.

The ICAEW chart of the week shows how CPI fell before increasing from 106.7 in October 2018 to 107.6 in April 2019 and 108.3 in October 2019, an annual increase of 1.5% that was within the 1% to 3% Bank of England target range. This was followed by smaller increases to 108.3 in April 2020 and 109.1 in October 2020, a 0.7% annual increase in CPI driven in part by the pandemic. The index hovered around that level for several months until starting to increase more rapidly from March onwards as the economy started to re-open, reaching 110.1 in April 2021 and continuing to increase sharply to 113.6 in October 2021, an annual increase of 4.2%.

The Governor of the Bank of England is required to write to the Chancellor of the Bank of England whenever inflation is more than 1% above or below the 2% target and he did so on 23 September when inflation reached 3.2% and he will again now that it has reached 4.2%. Part of the explanation he has given and will give are ‘base effects’, where price discounting during 2020 at the height of the first and second waves of the pandemic suppressed some of the inflation that is being experienced now.

Further letters are likely over the next few months as even if prices don’t rise any further, given how the index bounced around the 109 level between September and March 2021. This means inflation should continue to stay substantially above 3% for the next four months or so unless prices were to fall again, which is unlikely given how global commodities and supply constraints continue to feed into rising domestic prices. A 12-month CPI-inflation rate of 5% appears more than likely at some point in the next few months.

The Bank of England’s Monetary Policy Committee (MPC) isn’t panicking at this stage given that the annualised rate of inflation over the last three years (comparing October 2021 with October 2018) is an almost on-target 2.1% and their expectation that inflation rate will come down once the flat inflationary period of a year ago starts to drop out of the comparison. However, they are sufficiently concerned about the steep slope in the CPI in the last few months to signal that interest rates may need to rise if prices continue to increase at the pace seen in recent months.

The MPC’s original plan was to hang tight through what they hoped would be a short inflationary spurt as the economy emerges from the pandemic. In the event it looks like they won’t be able to hold that line, with higher interest rates a distinct possibility in the coming months.

This chart was originally published by ICAEW.

ICAEW chart of the week: US Infrastructure & Jobs Act

My chart this week looks at the $550bn of incremental funding over five years allocated by the US Infrastructure & Jobs Act just passed by Congress.

Chart showing $550bn in incremental investment over five years, with $110bn allocated to roads & bridges, $66bn railroads, $65bn power grid, $65bn broadband, $63bn water, $47bn resilience, $39bn public transit, $25bn airports, $21bn environment, $17bn ports, $15bn electric vehicles and $11bn safety.

The $1.2tn US Infrastructure & Jobs Act authorises $550bn in incremental spending over five years on top of existing infrastructure investment planned by the federal government on highways, railroads, electricity networks, water, public transit, airports, and ports across the US. Passed by Congress with some bipartisan support it aims to renew the nation’s infrastructure and stimulate the economy as the US emerges from the pandemic.

The White House describes the Act as delivering “no more lead pipes, high-speed internet access, better roads and bridges, investments in public transit, upgraded airports and ports, investment in passenger rail, a network of electric vehicle chargers, an upgraded power infrastructure, resilient infrastructure, and investment in environmental remediation.”

The incremental spending can be broken down as follows:

  • $110bn for roads and bridges – rebuilding the crumbling highway network, transportation research, funding for Puerto Rico’s highways, and ‘congestion relief’ in American cities
  • $66bn for railroads – upgrades and maintenance of the passenger rail system, and freight rail safety
  • $65bn for the power grid – investment in power lines and cables, and in clean energy
  • $65bn for broadband – expanding broadband in rural areas and low-income communities, including $14bn to reduce internet bills for low-income citizens
  • $63bn for water infrastructure – including $15bn for lead pipe replacement, $10bn for chemical clean-up, and $8bn for water facilities in the western half of the country to address ongoing drought conditions.
  • $47bn for resilience – a Resilience Fund to protect infrastructure from cybersecurity attacks and address flooding, wildfires, coastal erosion, and droughts along with other extreme weather events
  • $39bn for public transit – upgrades to public transport systems nationwide, new bus routes, and public transport accessibility for seniors and disabled Americans
  • $25bn for airports – major upgrades and expansions at airports, including $5bn for air traffic control towers and systems
  • $21bn for the environment – to clean up polluted ‘superfund’ and other brownfield sites, abandoned mines, and old oil and gas wells
  • $17bn for ports – half to the Army Corps of Engineers for port infrastructure, with the balance to the Coast Guard, ferry terminals, and to reduce truck emissions at ports
  • $15bn for electric vehicles – including $7.5bn on electric vehicle charging points, $5bn for bus fleet replacement in low-income, rural, and tribal communities, and $2.5bn for zero- and low-emission ferries
  • $11bn for safety – mostly highway safety improvements, but also for pedestrian, pipeline, and other safety areas

The plan was for a combination of tax rises, economic returns on the investments made and savings from other areas (including unused pandemic-relief) to fully cover the cost of these investments, however, many of the proposed tax increases did not make it to final bill and the independent Congressional Budget Office (CBO) estimates that there is less unused pandemic-relief available than originally thought. The CBO estimates that the fiscal deficit will be $350bn higher over the next five years.

The Act is the economic infrastructure element of President Biden’s “Build Back Better Framework”, with the separate $1.75tn Build Back Better Bill covering social infrastructure (including more than a million homes for low-income families) and large amounts for social programmes. These include universal pre-school for three- and four-year olds, free community college, expanded healthcare through Medicare (for over 65s) and Medicaid (for low-income families), lower prescription drug costs, tax cuts for children and childcare support, and paid family leave. There is also some money for tax cuts for electric vehicles and other climate incentives, although more ambitious plans such as forcing utilities to phase in renewable energy are believed to be less likely to make it into the final legislation. The Build Back Better Bill does not have bipartisan support and so requires all 50 Democrats in the Senate and almost all the Democrats in the House of Representatives to agree if it is to pass.

Whether the other elements of the Build Back Better Framework come to fruition remains to be seen, but President Biden will definitely be pleased that he can chalk up this major legislative achievement.

This chart was originally published by ICAEW.

ICAEW chart of the week: the path to net zero

All eyes have been on COP26 as the world’s leaders seek to set a course to eliminating carbon emissions over the next quarter of a century or so. Our chart highlights what it will take for the UK to do its part of delivering net zero by 2050.

Chart showing how the UK plans to go from 520m tonnes CO2-equivalent of greenhouse gas emissions in 2019 to net zero in 2020:

146m power & heat in 2019 -57m power -86m heat = 3m in 2050

167m transport in 2019 -117m domestic transport -24m international travel = 26m in 2050

207m industry, agriculture & waste in 2019 -86m industry -42m agriculture -27m waste = 52m in 2050

less: 81m greenhouse gas removals in 2050

to get to net zero

The Breakthrough Agenda agreed at COP26 by countries representing more than 70% of the world economy will be key, by making clean technologies the most affordable, accessible and attractive choice for all globally in each of the most polluting sectors. This involves ensuring that clean power, zero emission vehicles, near-zero emission steel, green hydrogen and climate-resilient sustainable agriculture are in place by 2030 so that countries including the UK can deliver on their ambitious plans to eliminate greenhouse emissions from their economies.

For the UK, the plan is to reduce greenhouse gas emissions from the 520m tonnes CO2-equivalent (tCO2e) emitted in 2019 to between 75m and 81m in 2050, with a combination of natural and technological solutions to remove an equivalent amount of carbon from the atmosphere to bring net emissions down to zero. This is based on the scenarios set out in the UK’s Net Zero Strategy published on 19 October 2021, which starts from 146m tCO2e of emissions from power and heat, 167m tCO2e from transport and 207 tCO2e from industry, agriculture & waste.

The different steps that will be needed to achieve this goal start with decarbonising power generation and heating, going from 146m to 3m tCO2e in 2050. The UK has already made substantial progress in installing renewable generation and appears on track to achieve the 57 MtCO2e further reduction to almost entirely remove fossil fuels from electricity. Challenging as that will be, it will be even more difficult to replace natural gas as the principal source of heating for the majority of buildings across the UK in order to find a further 86m tCO2e of reduction.

Eliminating 117m out of 122m tCO2e of emissions from domestic transport will mainly be accomplished by replacing petrol and diesel vehicles with electric, not only requiring affordable car technology but an entire new infrastructure of charging points. There is less optimism for international travel, where the ambition is to take out 24m of the 45m tCO2e emitted in 2019 in the ‘high innovation’ scenario presented in the chart and only 10m tCO2e in the other two scenarios (which assume greater reductions in other areas to arrive at a similar end point).

Industry, agriculture, and waste have even more to do, with businesses including steel producers, manufacturers and the fuel supply chain needing to decarbonise to remove 86m tCO2e out of 104m tCO2e. Agriculture and land use will need to take out 42m of 63m tCO2e of emissions, while emissions from waste and fluorinated greenhouse gases (F-gases) will need to come down by 27m from 40m to 13m tCO2e.

The result will be a UK economy still emitting 81m tCO2e a year, comprising 3m from power and heat, 26m from transport and 52m from industry, agriculture, and waste. Net zero will be achieved by removing an equivalent amount of carbon from the atmosphere, partially through natural means but in practice through technological solutions that have yet to be developed.

There is a lot that all of us need to do to achieve net zero here in the UK. The positive news emerging from COP26 is that the rest of the world is also committed to doing so too – a global solution for a global climate emergency.

Read more – ICAEW Insights Special on COP26: acting together on climate.

This chart was originally published by ICAEW.

ICAEW chart of the week: Spending Review 2021

Chancellor of the Exchequer Rishi Sunak found some extra money to supplement the Spending Review 2021, turning a very tough settlement for government departments into a moderately tough one.

Departmental budgets chart.

2019-20: £416bn (£346bn resource, £70bn capital)
2020-21: £570bn (£355bn, £88bn, £127bn covid-19 supplementary budget)
2021-22: £554bn (£385bn, £99bn, £70bn)

Spending Review 2021

2022-23: £542bn (£435bn resource with +£15bn health & social care and +£27bn spending review, £107bn capital)
2023-24: £554bn (£443bn with +£12bn and +£21bn, £111bn)
2024-25: £566bn (£454bn with +£14bn and +£13bn, £112bn)

The Chancellor had already announced an increase in the health budget from the proceeds of the health and social care levy, but as highlighted by our chart last week, this implied a very tough budget settlement for most other departments, including cuts for some. Instead, Rishi Sunak was able to use some of the upward revisions in the economic forecasts from the Office for Budget Responsibility to add to departmental resource budgets, ensuring that each department receives a real term spending increase in their combined resource and capital budgets even with higher levels of inflation in the coming year.

However, there was a sting in the tail, as supplementary COVID-19 funding ceases at the end of this financial year, leaving departments to absorb further COVID-related expenditure within their budgets from next April onwards. This will include catching up on backlogs built up during the pandemic in addition to any incremental costs that may continue into the Spending Review period.

The chart starts by highlighting how departmental resource and capital budgets of £346bn and £70bn in 2019-20, increased to £355bn and £88bn in 2020-21 and to £385bn and £99bn in the current year. This is before £127bn in COVID-19 supplementary budgets last year and £70bn this year.

The Spending Review period itself covers the three financial years 2022-23, 2023-24 and 2024-25, with the combination of funding from the health and social care levy and the Spending Review seeing departmental resource budgets increase to £435bn, £443bn and £454bn respectively. This is more than the spending envelope originally set out by the Chancellor last month.

Capital investment budgets remained broadly unchanged at £107bn, £111bn and £112bn respectively, continuing the significant jump from the £70bn invested in 2019-20 in the coming financial year before flattening out in the following two years.

Over the three years, the resource budget settlement implies annualised average real terms growth in the health & social care budget of 4.1% and in the education budget of 2.2%, while the defence budget is broadly frozen in cash terms and cut by 1.4% in real terms. This assumes average inflation over the three years of 2.2%, with higher inflation in the coming financial year offset by much lower rates in the following two years.

Other departments are expected to grow by 3.1% on average over the period, with central funding for local government up 9.4%, transport up 6.8%, work & pensions up 4.6% and justice up 4.1%, each receiving larger relative settlements than other departments. International trade (+0.1%), HM Treasury (+0.9%), levelling up, housing & communities (+1.1%), HMRC (+1.2%), the Cabinet Office (+1.4%), business, energy & industrial strategy (+1.4%), and intelligence (+1.7%) are the departments receiving increases below 2% a year on average.


2021-22
£bn

2022-23
£bn

2023-24
£bn

2023-24
£bn
Average
real-terms
growth
Education147.1167.9173.4177.4+4.1%
Defence70.777.079.080.6+2.2%
Transport31.532.432.232.2-1.4%
Large departments249.3277.3284.6290.2+2.9%
Other departments70.783.982.782.7+3.1%
Devolved administrations56.863.064.365.3+2.5%
ODA to 0.7% of GDP5.2
Reserves8.111.010.910.3
Total excluding covid-19384.9435.2442.5453.7+3.3%
HM Treasury, ‘Autumn Budget and Spending Review 2021’

The above growth rates exclude capital budgets, expected to increase in real terms by 1.9% a year on average over the three years of the Spending Review. Departments benefiting from higher capital budgets include small and independent bodies (+16.8%), FCDO (+16.0%), digital, culture, media & sport (+11.8%), and intelligence (+9.1%), albeit mostly from relatively small bases in each case. The 3.8% average real terms increase in health & social care capital investment is much less proportionately, but much larger in cash terms.

Perhaps just as important as the monetary amounts provided to departments as the Chancellor opened his proverbial cheque book, is the certainty that a three-year budgetary settlement provides. This will help departments plan ahead with confidence and hopefully help them obtain better value for the money they spend on our behalf.

This chart was originally published by ICAEW.

ICAEW chart of the week: Pre-Spending Review departmental spending

The chart this week looks at the core departmental resource budgets that are central to next Wednesday’s long-awaited Spending Review.

The Spending Review and Autumn Budget on Wednesday 27 October will see the Chancellor set out departmental budgets for the next three financial years from 1 April 2022. The #icaewchartoftheweek shows the core departmental resource budgets for the current financial year, excluding COVID-19 related spending, capital investment, and annually managed expenditure such as the state pension and welfare provision.

With budget settlements for health, schools and defence already pencilled in, there may be a need for cuts in some departments if the Chancellor is to be able to free up cash to direct it where it is most needed. 

The Chancellor has already announced that the spending envelope will increase core departmental resource budgets of £385bn as shown in the chart to £408bn in 2022-23, £422bn in 2023-24 and £441bn in 2024-25. 

This might be seen as implying generous budget increases are on offer, but £18bn of the £23bn increase in the coming financial year has already been allocated to the Department for Health & Social Care (DHSC). This reflects £13bn of additional funding from the recently announced health and social care levy in addition to already planned increases in health spending, taking the DHSC budget to £164.8bn in 2022-23, rising to £171.4bn and £175.9bn in the following two years.

A further £2bn has been allocated to English schools next year (taking it from £49.8bn to £52.2bn within the Education’s overall £70.8bn budget) while the Ministry of Defence’s current budget of £31.6bn is expected to receive a flat budget settlement in 2022-23 before rising in subsequent years. With just under a billion in consequential increases to the devolved administrations under the Barnett formula, that leaves a mere £2bn available for non-schools education and all the other departments. 

With local government and departments such as Justice under severe financial pressure, the implication is that some departments may receive cuts in their core budgets to free up extra cash for those more in need.

Other departmental budgets of £70.5bn in 2021-22 include the Home Office £13.7bn, Local Government £8.5bn, Justice £8.4bn, the Foreign, Commonwealth & Development Office (FCDO) £7.4bn, the Department for Work & Pensions (DWP) £5.7bn, HMRC £4.9bn, the Department for Transport (DfT) £4.7bn, the Department of Environment, Food & Rural Affairs (DEFRA) £4.2bn, the Department for Business, Energy & Industrial Strategy (BEIS) £2.6bn, the Single Intelligence Account (SIA) £2.2bn, the Department for Levelling Up, Housing & Communities (DLUHC) and the Department for Digital, Culture, Media & Sports £1.7bn. This is followed by a series of smaller departments such as the Cabinet Office £0.7bn, Law Officers £0.7bn, the Department for International Trade (DIT) £0.5bn and HM Treasury £0.3bn as well as non-ministerial departments and other public bodies.

The chart does not include capital budgets, which are expected to rise from £99.8bn in the current year to £107.3bn, £109.1bn and £112.8bn in 2022-23, 2023-24 and 2024-25 respectively. Here, the Chancellor has greater room for manoeuvre and it would not be surprising for the Budget Statement next month to focus on capital investment programmes across the country rather than the more challenging budget settlements for current expenditure that most departments are likely to receive.

This chart was originally published by ICAEW.

ICAEW chart of the week: UK public debt profile

Our chart this week shines a spotlight on the UK’s public debt, focusing on the Government’s debt strategy ahead of the fast approaching Spending Review.

A big worry for the Chancellor of the Exchequer in putting together the Budget and Spending Review this month is the possibility that higher inflation and interest rate rises will hit the public finances, restricting the amounts he has available to meet his policy objectives. Our chart this week illustrates just how exposed the UK’s public debt is to changes in inflation and interest rates.

UK public debt profile - column chart

UK public sector net debt before QE: Index-linked £470bn + Variable-rate £490bn + Fixed-rate £1,580bn - Cash and liquid assets £340bn = £2,200bn

Quantitative easing: £980bn (£735bn overlaps with fixed-rate and £245bn overlaps with variable-rate.

UK public sector net debt after QE: Index-linked £470bn + Variable-rate £1,225bn + Fixed-rate £845bn - Cash and liquid assets £340bn = £2,200bn

Sources: Office for National Statistics, Debt Management Office, ICAEW calculations and estimates.

UK public sector net debt was marginally over £2.2tn at the end of August 2021, comprising in the order of £2,540bn in gross debt less £340bn in cash and liquid assets. As ICAEW’s chart of the week illustrates using approximate numbers, this can be broadly divided into fixed-rate, variable-rate and index-linked debt, reflecting the Government’s debt strategy as executed by the UK Debt Management Office and by National Savings & Investments.

What the chart highlights is how quantitative easing (QE) has changed the profile of UK public debt significantly. This tool has been used by the operationally independent Bank of England to ease monetary policy by pumping money into the economy in response to the financial crisis a decade ago and the coronavirus pandemic more recently, but has the effect of switching fixed-rate government securities into variable-rate central bank deposits, contributing to falling interest costs even as public sector net debt has risen from less than £0.5tn in 2007 before the financial crisis to £1.8tn in March 2020 before the pandemic and £2.2tn currently.

Fixed-rate debt of £1,580bn comprises approximately £1,490bn in government bonds or gilts repayable over periods generally ranging from five to 30 years, together with £75bn in other central and local government loans net of intra-government holdings (which we have assumed are mostly fixed-rate in nature) and up to £15bn in fixed-rate savings certificates sold to individual investors by National Savings & Investment.

Variable-rate debt of £490bn comprises around £185bn of variable-rate National Savings & Investments deposits and certificates, £60bn in short-term Treasury bills, and £245bn in Bank of England liabilities relating to QE (see below). The balance of £470bn is in the form of index-linked gilts, where the amounts owed increase in line with the retail prices index (RPI).

This is before deducting £340bn in cash and liquid assets, comprising around £150bn of official reserves (much of which is currency deposits with foreign central banks) and £115bn, £40bn and £35bn in bank, building society and other liquid financial asset holdings held by central government, local government and other parts of the public sector respectively.

In practice, the sterling work of the UK Debt Management Office (DMO) to create a balanced portfolio of public debt has been upended by the Bank of England’s Monetary Policy Committee, albeit with the agreement of successive Chancellors. The spread of inflation-, variable- and fixed-rate exposure combined with extended maturities to manage refinancing requirements over longer periods has been offset by £980bn of QE purchases and lending that has replaced £735bn (or around half) of the fixed-rate gilts in issue at nominal value with central bank deposits that pay interest at the Bank of England base rate – reducing the net fixed rate exposure to £845bn. This is in addition to the QE-related liabilities of £245bn already included in variable-rate debt, of which £110bn was used to finance Term Funding Scheme low-cost business loans, £20bn to fund corporate bond purchases, and £115bn to finance premiums on gilt purchases (in effect prepaying some of the interest that would have gone to external investors over time if the gilts had not been purchased by the Bank of England).

The consequence is a public debt portfolio that is currently being financed much more cheaply than anyone ever expected, but which is much more sensitive to changes in inflation and interest rates than was ever planned.

With inflation now expected to rise to in the order of 5% (or even higher) over the next few months, and suggestions that the Bank of England may start to increase the base rate in early 2022, the gains the public finances have experienced from ultra-low borrowing costs look as if they will start to go into reverse. This is likely to put additional pressure onto the public finances at a time of elevated economic uncertainty, making for even tougher choices for the Chancellor on both tax and spending in the Spending Review and Autumn Budget in a couple of weeks’ time.

This chart was originally published by ICAEW.

ICAEW chart of the week: UK public sector employment

Our chart this week is on public sector employment, the cost of which is one of the largest components of the Spending Review in a few weeks’ time.

Chart showing UK public sector employment between June 2001 and June 2021.

See text below for description of trends.

One of the key drivers for any budget or business plan is the number of full-time equivalent employees (FTEs) and it is no different in the public sector, where staff costs in the order of £150bn constitute just under 40% of departmental resource budgets of £385bn in 2021-22 (excluding depreciation and COVID-related spending).

The chart illustrates how public sector employment has grown, fallen and grown again over the last 20 years. It starts with the largest employer in the country – the NHS – where the workforce has increased from 1,025,000 FTEs in June 2001 to 1,626,000 FTEs in 2021. This 59% increase in staffing is substantially greater than the 14% increase in the size of the UK population from 59m to 67m over the same period, reflecting how the combination of more people living longer but less healthy lives and more successful treatments for cancer (for example) have resulted in substantially more for the NHS and its workforce to do.

Education FTEs are up 16% from 997,000 twenty years ago to 1,113,000 this year, is more in line with the growth in the size of the population, although most of the increase happened before the financial crisis, with FTEs working in education still below the peak of 1,210,000 in March 2012.

Public administration is down from 20 years ago, with 966,000 FTEs in June 2021 compared with 998,000 two decades previously. FTEs increased to a peak of 1,081,000 in June 2005 before falling gradually to 1,010,000 in June 2010, followed by more significant falls following the financial crisis. Most of the net fall represents fewer public servants in local government since the financial crisis , with civil servants in central government only slightly below where they were 20 years ago at 465,000 FTEs in June 2021 compared with 492,000 in June 2001. The total would have been much lower but for a post-Brexit surge in the size of the civil service, which has grown by 20% from its nadir of 384,000 FTEs in June 2016.

Police and armed forces FTEs have fallen from 436,000 in June 2001 to 417,000 in June 2021, mainly due to a steady decline in the armed forces from 219,000 to 159,000 FTEs over that period. Police numbers (including civilian support staff) increased from 222,000 FTEs 20 years ago to a peak of 284,000 in September 2009, fell to 235,000 FTEs in December 2016, and then started to increase again over the course of the last two years to reach 258,000.

Other public sector workers, including community health and social workers and employees of public corporations such as the BBC, Channel 4, Crossrail and Ordnance Survey have fallen from 973,000 to 655,000 FTEs, having reached a peak of 1,322,000 in March 2008 following the nationalisation of a number of banks. Most of the fall since then is a consequence of transfers to the public sector, including housing associations, Royal Mail, Direct Line, Lloyds Banking Group and Northern Rock.

Overall, public sector employment grew from 4,429,000 FTEs in June 2001 to a peak of 5,292,000 FTEs in December 2009 before falling to 4,777,000 FTEs in June 2021, comprising net changes of +601,000 in the NHS, +116,000 in Education, -32,000 in public administration, -19,000 in the police and armed forces and -318,000 in other public sector employees.

Of course, staff numbers are only part of the equation as the 4,777,000 FTEs currently employed have to be multiplied by an average salary of around £34,000 a year to reach the more than £160bn estimate for total staff costs across the public sector. This is the average of total pay – the median full-time salary is lower than this at somewhere in the region of £26,000.

Pay is one of the key drivers, with a pay freeze for many public sector workers announced last year helping to constrain the growth in the wage bill. With the cost of living on the march upwards, it seems unlikely that the Chancellor will be able to justify as strict a pay freeze this year, although he will still be looking to constrain wage settlements as much as possible. Wage settlements in the private sector are also likely to be higher this year, another worry for the Treasury given the £230bn or so the public sector spends every year on external procurement.

The recent upward trend in public sector employment is a big challenge for the Spending Review, particularly the continual growth in NHS staff as more people live longer lives, in addition to commitments to recruit more police officers and to improve other public services. Higher wage settlements in both the public and private sectors could significantly affect the number of people the government can afford to employ to meet its policy objectives.

ICAEW chart of the week: capital investment before the Spending Review

Given that capital budgets are often the first to be cut when money is tight, will the planned growth in capital investment survive the Spending Review later this month?

Capital investment before the spending review

Departmental capital budgets from 
2019-20 through 2025-26: £70bn, £92bn, £100bn, £107bn, £109bn, £113bn, £117bn

Local and other capital budgets: £14bn, £10bn, £7bn, £7bn, £11bn, £10bn, £10bn.

Sources: HM Treasury and Office for Budget Responsibility, Spring Budget 2021. Excludes covid and student loans.

Our chart this week is on public sector capital investment, illustrating how central department capital budgets increased from £70bn two years ago to £92bn last year and £100bn this year, with further increases planned up to £117bn in 2025-26. This path was originally set by former Chancellor Philip Hammond who believed boosting capital investment, particularly on infrastructure, would help address the productivity gap that has constrained economic growth over the last decade. Chancellor Rishi Sunak has broadly adopted the same approach of increasing capital budgets in the first half of the 2020s, but with the rather snappier objective of ‘levelling up’ opportunity across the country.

Local and other capital budgets in the public sector are actually significantly higher than those shown in the chart (£14bn, £10bn, £7bn, £7bn, £11bn, £10bn and £10bn in 2019-20 through 2025-26), but that is primarily because a substantial proportion of both local government and public corporation capital investment is funded through central government capital grants, which are already included within departmental capital budgets. The balance, funded by local taxation and non-tax revenues, has actually fallen in the last few years, especially as many local authorities have tightened their belts as social care and other costs have outstripped council tax receipts.

The Treasury announced last month that the envelope for the Spending Review would adopt the capital spending profile already set out in the Spring Budget in March as shown in our chart, with core capital department expenditure limits (Core CDEL) of £107bn in 2022-23, £109bn in 2023-24 and £113bn in 2024-25. It seems likely that the government will stick ahead with these capital plans, unlike the profile for departmental current spending (Core resource department expenditure limits or Core RDEL, not shown in the chart) which increased by £15bn, 12bn and £14bn respectively to £408bn in 2022-23, £422bn in 2023-24 and £441bn in 2024-25 to address the increasing demands being placed on health care as more people live longer and to address the social care crisis. 

While this extra current spending is to be funded by the new health and social care levy, there remain huge pressures on many other public services as well as concerns about the risks to tax receipts from an uncertain economic recovery. The temptation to raid capital budgets to top up current spending, as occurred in the years following the financial crisis, will be there. After all, the benefits of capital investment can often take many years to arrive, while the stresses experienced by public services are much more immediate. In addition, under government fiscal rules, capital expenditure counts towards reported expenditure (total managed expenditure or TME) and the public sector deficit, which perhaps makes it more difficult to treat investment for the long-term differently from day-to-day operating expenditure. 

Assuming the Chancellor sticks to the plan, then the big story of the Spending Review from a capital expenditure perspective will be in the allocation between departments. Transport (£18bn in 2021-22), Business, Energy & Industrial Strategy (£16bn) and Defence & Intelligence (£15bn) are the largest spenders, and each will be fighting hard for more money, especially Defence where governmental ambitions to be a ‘tier 1’ military power have always outstripped the amount of money supplied. Other departments likely to be seeking additional capital funding include the Department for Levelling Up, Housing and Communities on behalf of local authorities in England (£9bn in 2021-22) and the devolved administrations (together £9bn).

Will the Chancellor be able to steer a course through what appear to be some turbulent economic waters to deliver on the government’s infrastructure ambitions?

This chart was originally published by ICAEW.

ICAEW chart of the week: German federal budget 2022

As Germany heads to the polls this weekend to elect a new federal parliament, the topic of the public finances has moved to centre stage. Our chart this week looks at the federal budget for 2022 and the current plan to sharply reduce the deficit from 2023 onwards.

German federal budget 2022

2021: revenue €307bn + borrowing €240bn = expenditure €488bn + investment €59bn

2022: revenue €343bn + borrowing €100bn = expenditure €391bn + investment €52bn

2023: revenue €398bn + borrowing €5bn = expenditure €352bn + investment €51bn

2024: revenue €396bn + borrowing €12bn = expenditure €357bn + investment €51bn

2025: revenue €396bn + borrowing €12bn = expenditure €357bn + investment €51bn

Source: Bundesministerium der Finanzen: 'Draft 2022 federal budget and fiscal plan to 2025'

The coronavirus pandemic has been accompanied by relaxations in both European and German constitutional limitations on the size of the federal deficit for 2020, 2021 and 2022, with Chancellor Angela Merkel of the Union parties (the Christian Democratic Union (CDU) together with Bavaria’s Christian Social Union (CSU)) and Finance Minister and chancellor-candidate Olaf Scholtz of the Social Democratic Party (SPD) setting out a plan earlier this year to reduce federal borrowing significantly by 2023.

As the #icaewchartoftheweek illustrates, the plan is to continue to run a sizeable deficit of €100bn in 2022 with tax and other revenue of €343bn being offset by €391bn in expenditure and €52bn in investment spending. This is a smaller deficit than the €240bn forecast for the current year (revenue €307bn – expenditure €488bn – investment €59bn) and the €131bn recorded in 2020 (not shown in the chart: revenue €311bn – expenditure €392bn – investment €50bn), both of which contained significant amounts of emergency spending in response to the pandemic. 

The hope is that revenues will recover in 2023 to €398bn at the same time as expenditures and investment return to pre-pandemic levels of €352bn and €51bn respectively to leave only a €5bn shortfall to be covered by borrowing. The forecast deficit for both 2024 and 2025 is €12bn, comprising revenue of €396bn in both years, less expenditure of just under €396bn in 2024 and just over €396bn in 2025 and investment in both years of €51bn. It is important to note that this is the budget for the federal government only and excludes the share of joint taxes going to Germany’s states (Länder) as well as expenditures funded from state and local taxation.

The challenge for the three principal candidates for the chancellorship: Olaf Scholtz of the SPD, Armin Laschet of the Union parties and Annalena Baerbock of the Green party, is in how to make promises to spend more on their respective priorities while maintaining the low levels of borrowing required by the constitution outside of fiscal emergencies. 

Major flooding earlier this year has put climate change at the top of the electoral agenda, with the need to increase investment to achieve net zero a key theme of party platforms. Together with promises to invest more in infrastructure and the need to cover the cost of more people living longer, higher defence spending and other financial commitments, there are significant questions about whether the path to near-budget balance can be achieved. Given the economic uncertainty, the prospect of returning to the pre-pandemic policy of paying down government debt seems unlikely, although that policy helped reduce general government debt from a peak of 82% of GDP in 2010 following the financial crisis. Despite the additional borrowing because of the pandemic, general government debt is still below that level at somewhere in the region of 75% of GDP – putting Germany in a much better fiscal position than many of its European neighbours, including the UK.

One candidate to be the next finance minister is Christian Lindner of the liberal Free Democratic Party (FDP), a possible partner in either a ‘traffic-light coalition’ of SPD (red), Greens (green) and FDP (yellow) or a ‘Jamaica coalition’ of the Union parties (black), Greens (green) and FDP (yellow) although this will of course depend on how the parties perform in the election on Sunday 26 September. Alice Weidel and Tino Chrupalla, joint leaders of the hard-right Alternative for Germany (AfD), and Janine Wissler & Dietmar Bartch, joint leaders of the Left Party (Die Linke), are considered unlikely to find their way into the federal cabinet in most scenarios.

Unlike in the UK, where a new prime minister customarily takes up residence in 10 Downing Street the next day, there is unlikely to be an instant change in national leadership. Chancellor Angela Merkel and most of her existing Union/SPD ‘Grand coalition’ cabinet are likely to stay in caretaker positions for several weeks or potentially months as fresh coalition negotiations between the parties elected to the Bundestag are concluded.

This chart was originally published by ICAEW.