Our chart this week takes a look at trade between the UK and the EU in the light of the recent trade deal announced by the prime minister and the EU Council and Commission presidents.
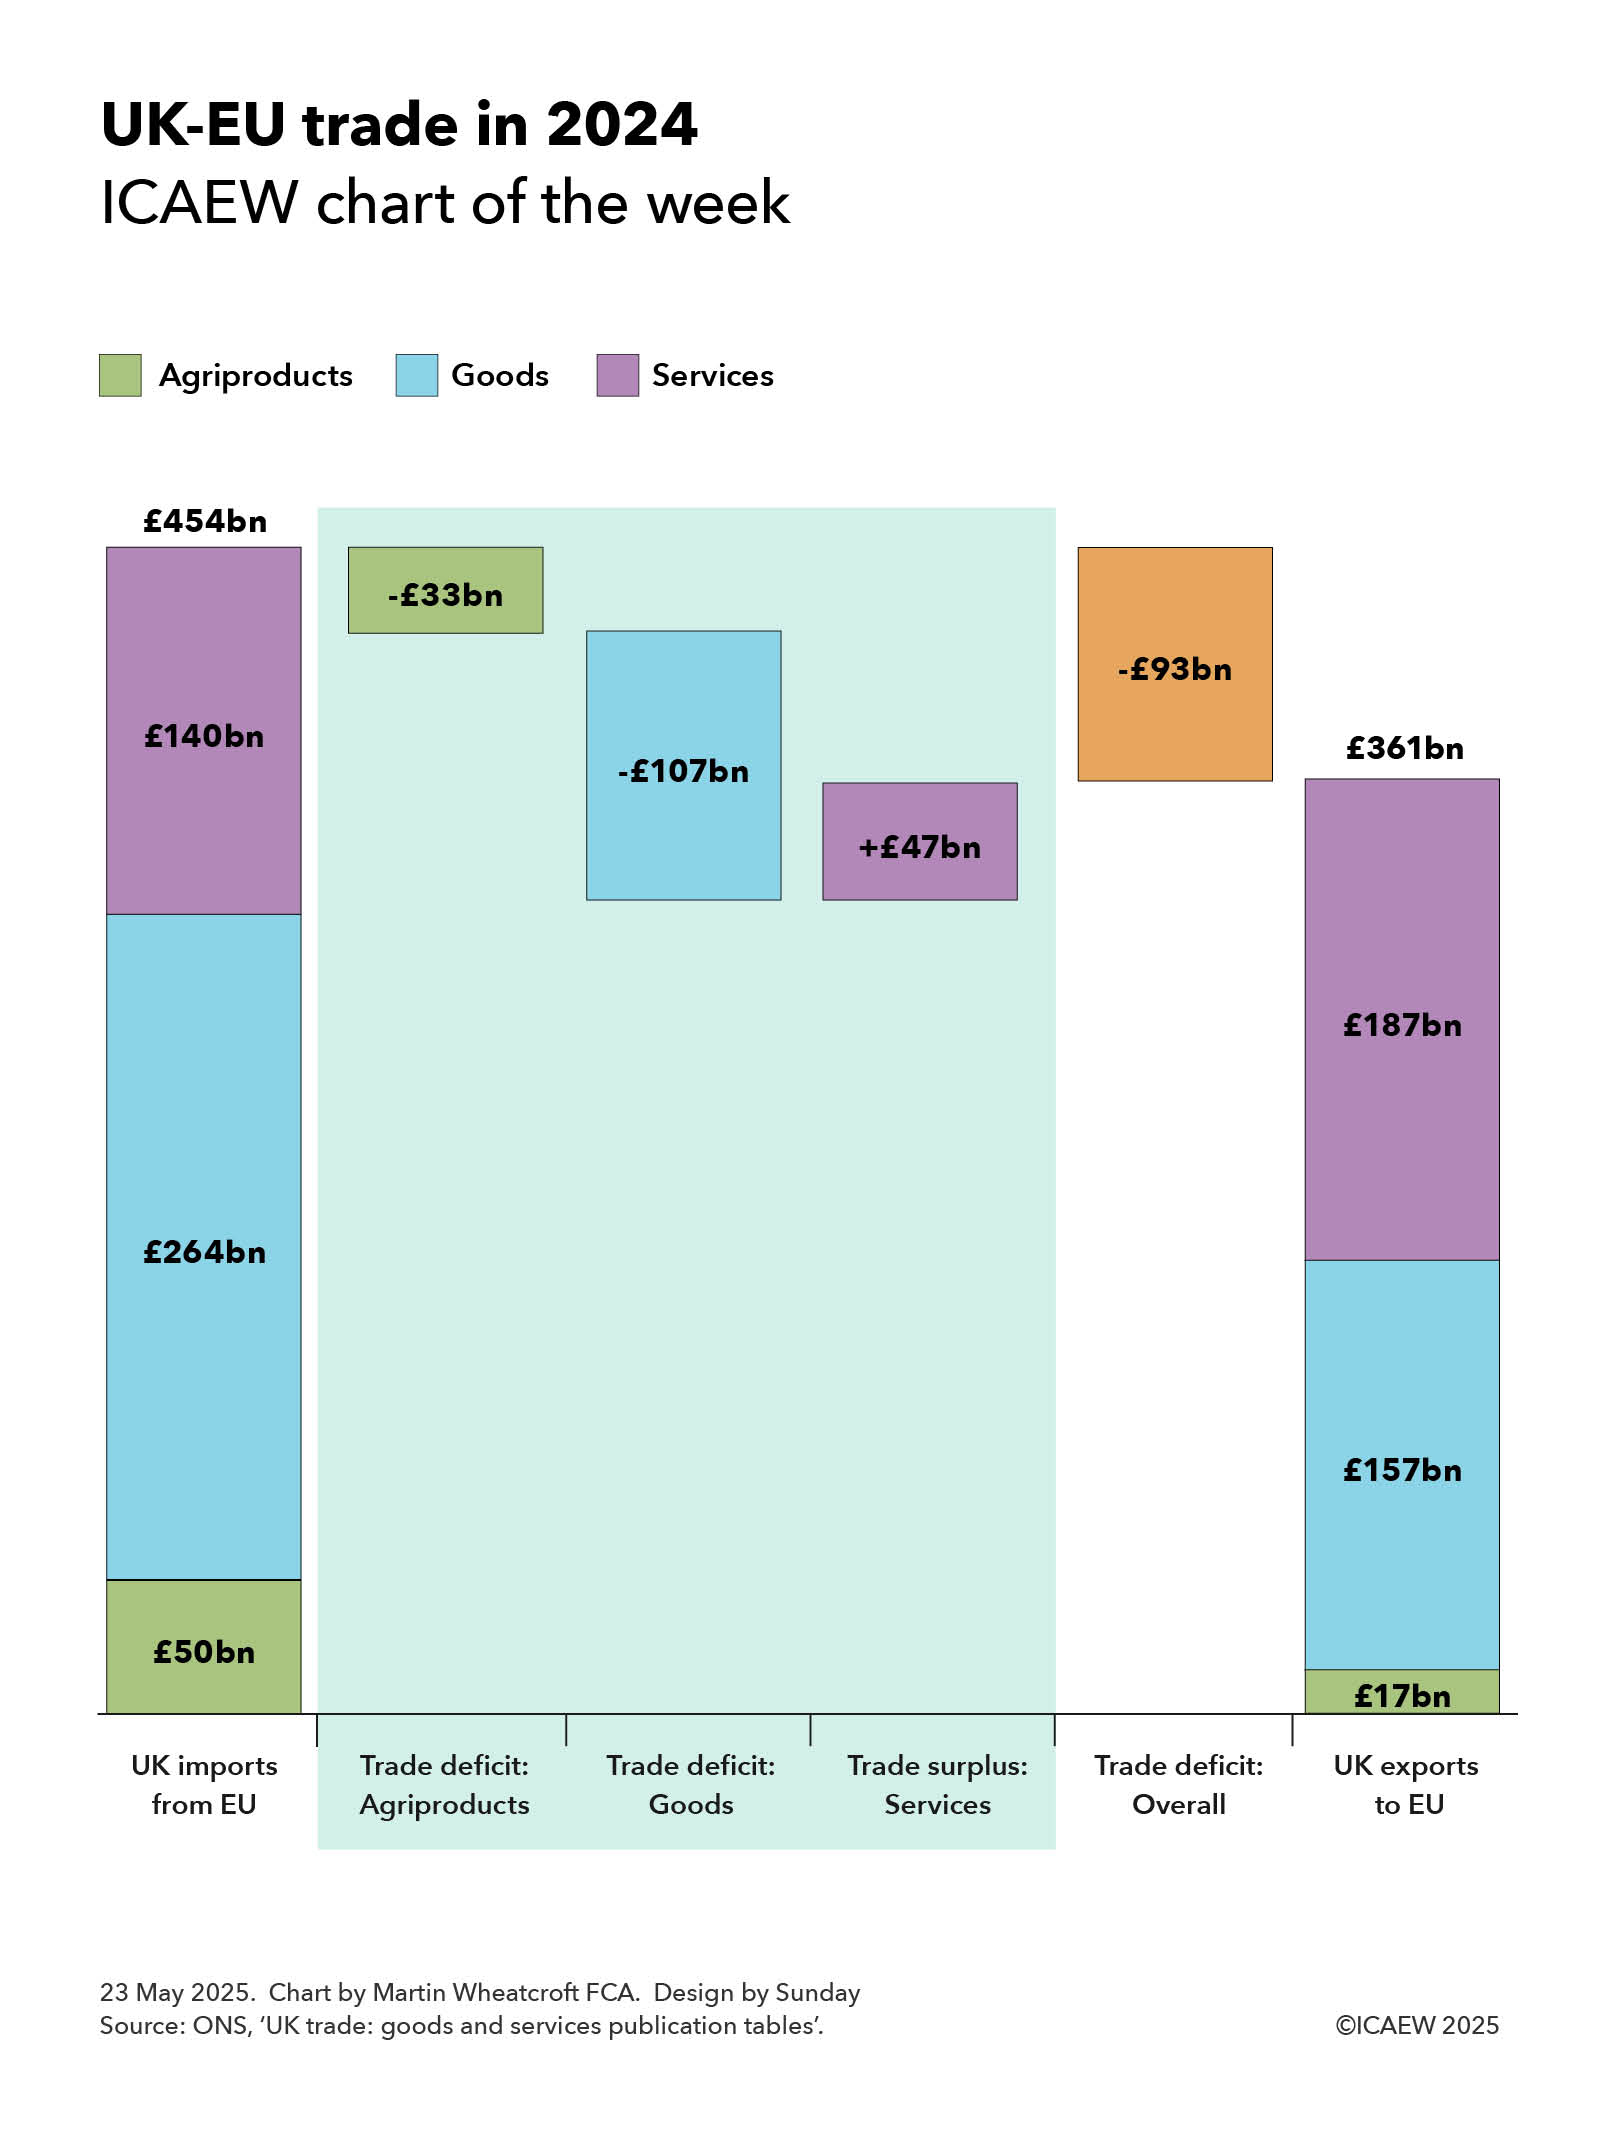
The European Union is the UK’s largest trading partner, with the UK importing goods and services from its 27 member countries worth £454bn at current market prices in 2024, and the UK exporting goods and services to EU countries worth £361bn.
UK imports from and exports to the EU represent 50% and 41% respectively of the UK’s total imports and exports of £906bn and £873bn in 2024. This is equivalent to 16% and 13% of estimated GDP in 2024 of £2,851bn, out of total imports and exports of 32% and 31% of GDP respectively.
Our chart this week analyses trade with the EU between £50bn, £264bn and £140bn in imports of agriproducts, other goods, and services, and £17bn, £157bn and £187 in exports of agriproducts, goods, and services. As the chart illustrates, the trade deficits on agriproducts and goods are £33bn and £107bn respectively, while there is a trade surplus on services of £47bn. Overall the UK imports £93bn more from the EU than it exports to the EU.
Agriproduct imports and exports of £50bn and £17bn (1.8% and 0.6% of GDP) consist of purchases and sales of food and live animals (£39bn and £11bn), beverages and tobacco (£9bn and £5bn), and animal and vegetable oils and fats (£2bn and £1bn).
Goods imports and exports of £264bn and £157bn (9.3% and 5.5% of GDP) respectively comprise machinery and equipment (£127bn and £65bn), material manufactures and other manufactured goods (£67bn and £36bn), chemicals (£46bn and £28bn), energy (£15bn and £24bn), raw materials (£6bn and £3bn), and unspecified goods (£3bn and £1bn). With the exception of energy, we buy more goods from the EU than we sell them.
Services imports and exports of £140bn and £187bn (4.9% and 6.6% of GDP) during 2024 include business and professional services (£42bn and £67bn), travel and tourism (£53bn and £18bn), financial services (£11bn and £40bn), transport (£17bn and £16bn), IT services (£7bn and £21bn), intellectual property (£5bn and £16bn), and other services (£5bn and £9bn). We sell more to the EU than we purchase in services, with the main exception being travel and tourism, where holidays in Europe are a big factor.
The trade deal between the UK and the EU announced on 19 May 2025 primarily focuses on food and other agriproducts, a relatively small proportion of total trade between the UK and the EU. This perhaps explains why the anticipated benefits to the UK economy of the new trade deal are also relatively small at £9bn a year by 2040, just 0.3% of GDP.
Most of our trade with the EU is in goods and services that, apart from energy, are not directly impacted by this deal. Despite that, the deal is expected to be positive for the farming and fishing communities that will be hoping to reverse a 19% drop in food exports since 2019. EU producers will also be hoping to reverse the 5% fall in their food exports to the UK over the same period.
Taxpayers will also benefit from being able to avoid the cost of imposing restrictions on food and agricultural imports that were never fully implemented and will now no longer be needed.
While the economic benefits of the deal may be fairly small, as the saying goes: “Every little helps.”