A slightly higher fiscal deficit for May and rising interest rates provide no comfort for the Chancellor as he considers how to respond to public sector wage demands.
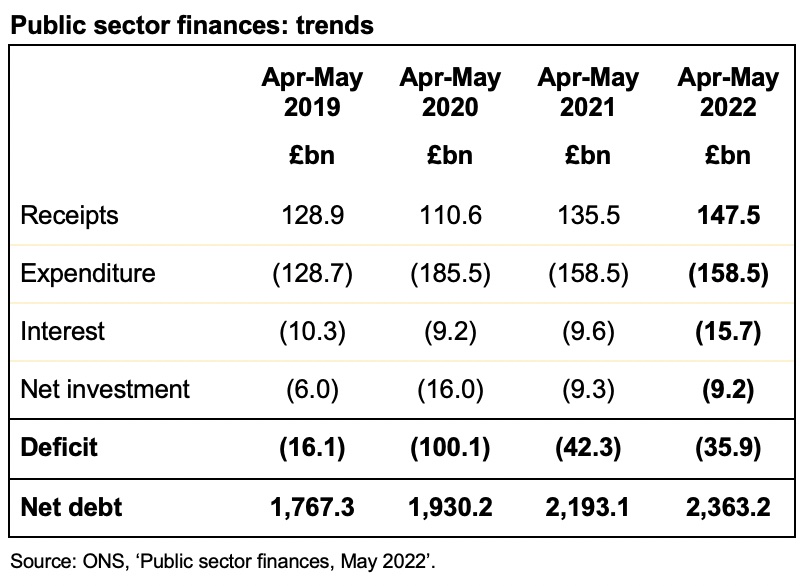
The monthly public sector finances released on Thursday 23 June 2022 reported a provisional deficit for the month of May 2022 of £14.0bn, an improvement from this time last year, but still £8.5bn higher than May 2019, the year before the pandemic.
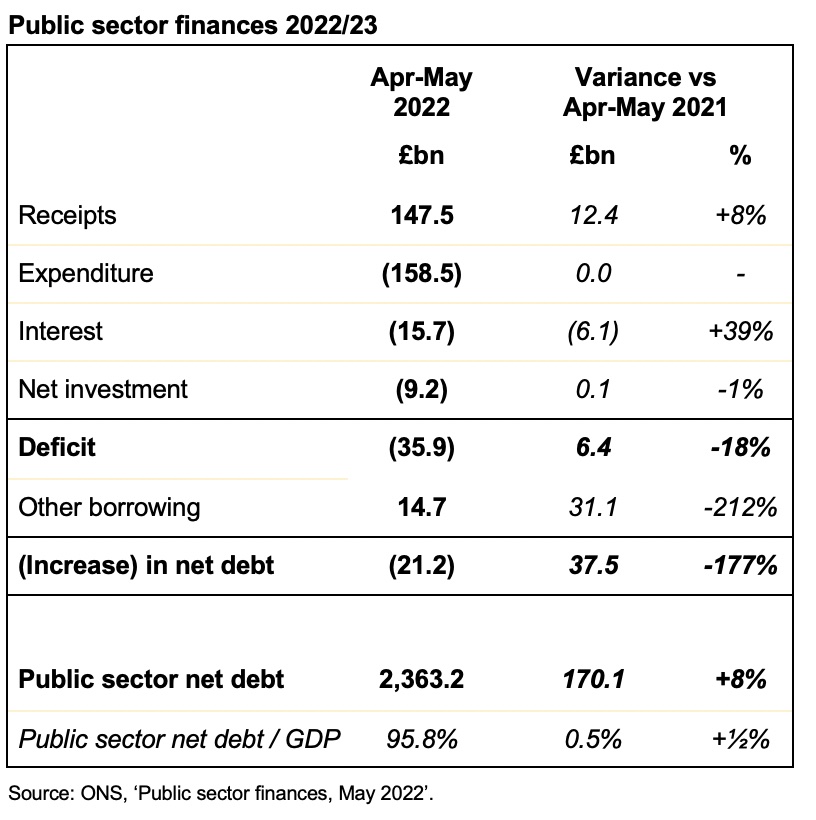
Public sector net debt increased by £21bn from £2,342bn at the end of March 2022 to £2,363bn or 95.8% of GDP at the end of May. This is £570bn higher than 31 March 2020, reflecting the huge sums borrowed over the course of the pandemic.
The deficit reported for the two months to May 2022 of £35.9bn was an improvement of £6.4bn from the deficit of £42.3bn reported for the months of April and May 2021, and £64.2bn better than the £100.1bn reported for April and May 2020. However, it was £19.8bn worse than the pre-pandemic deficit of £16.1bn for the two months to May 2019.
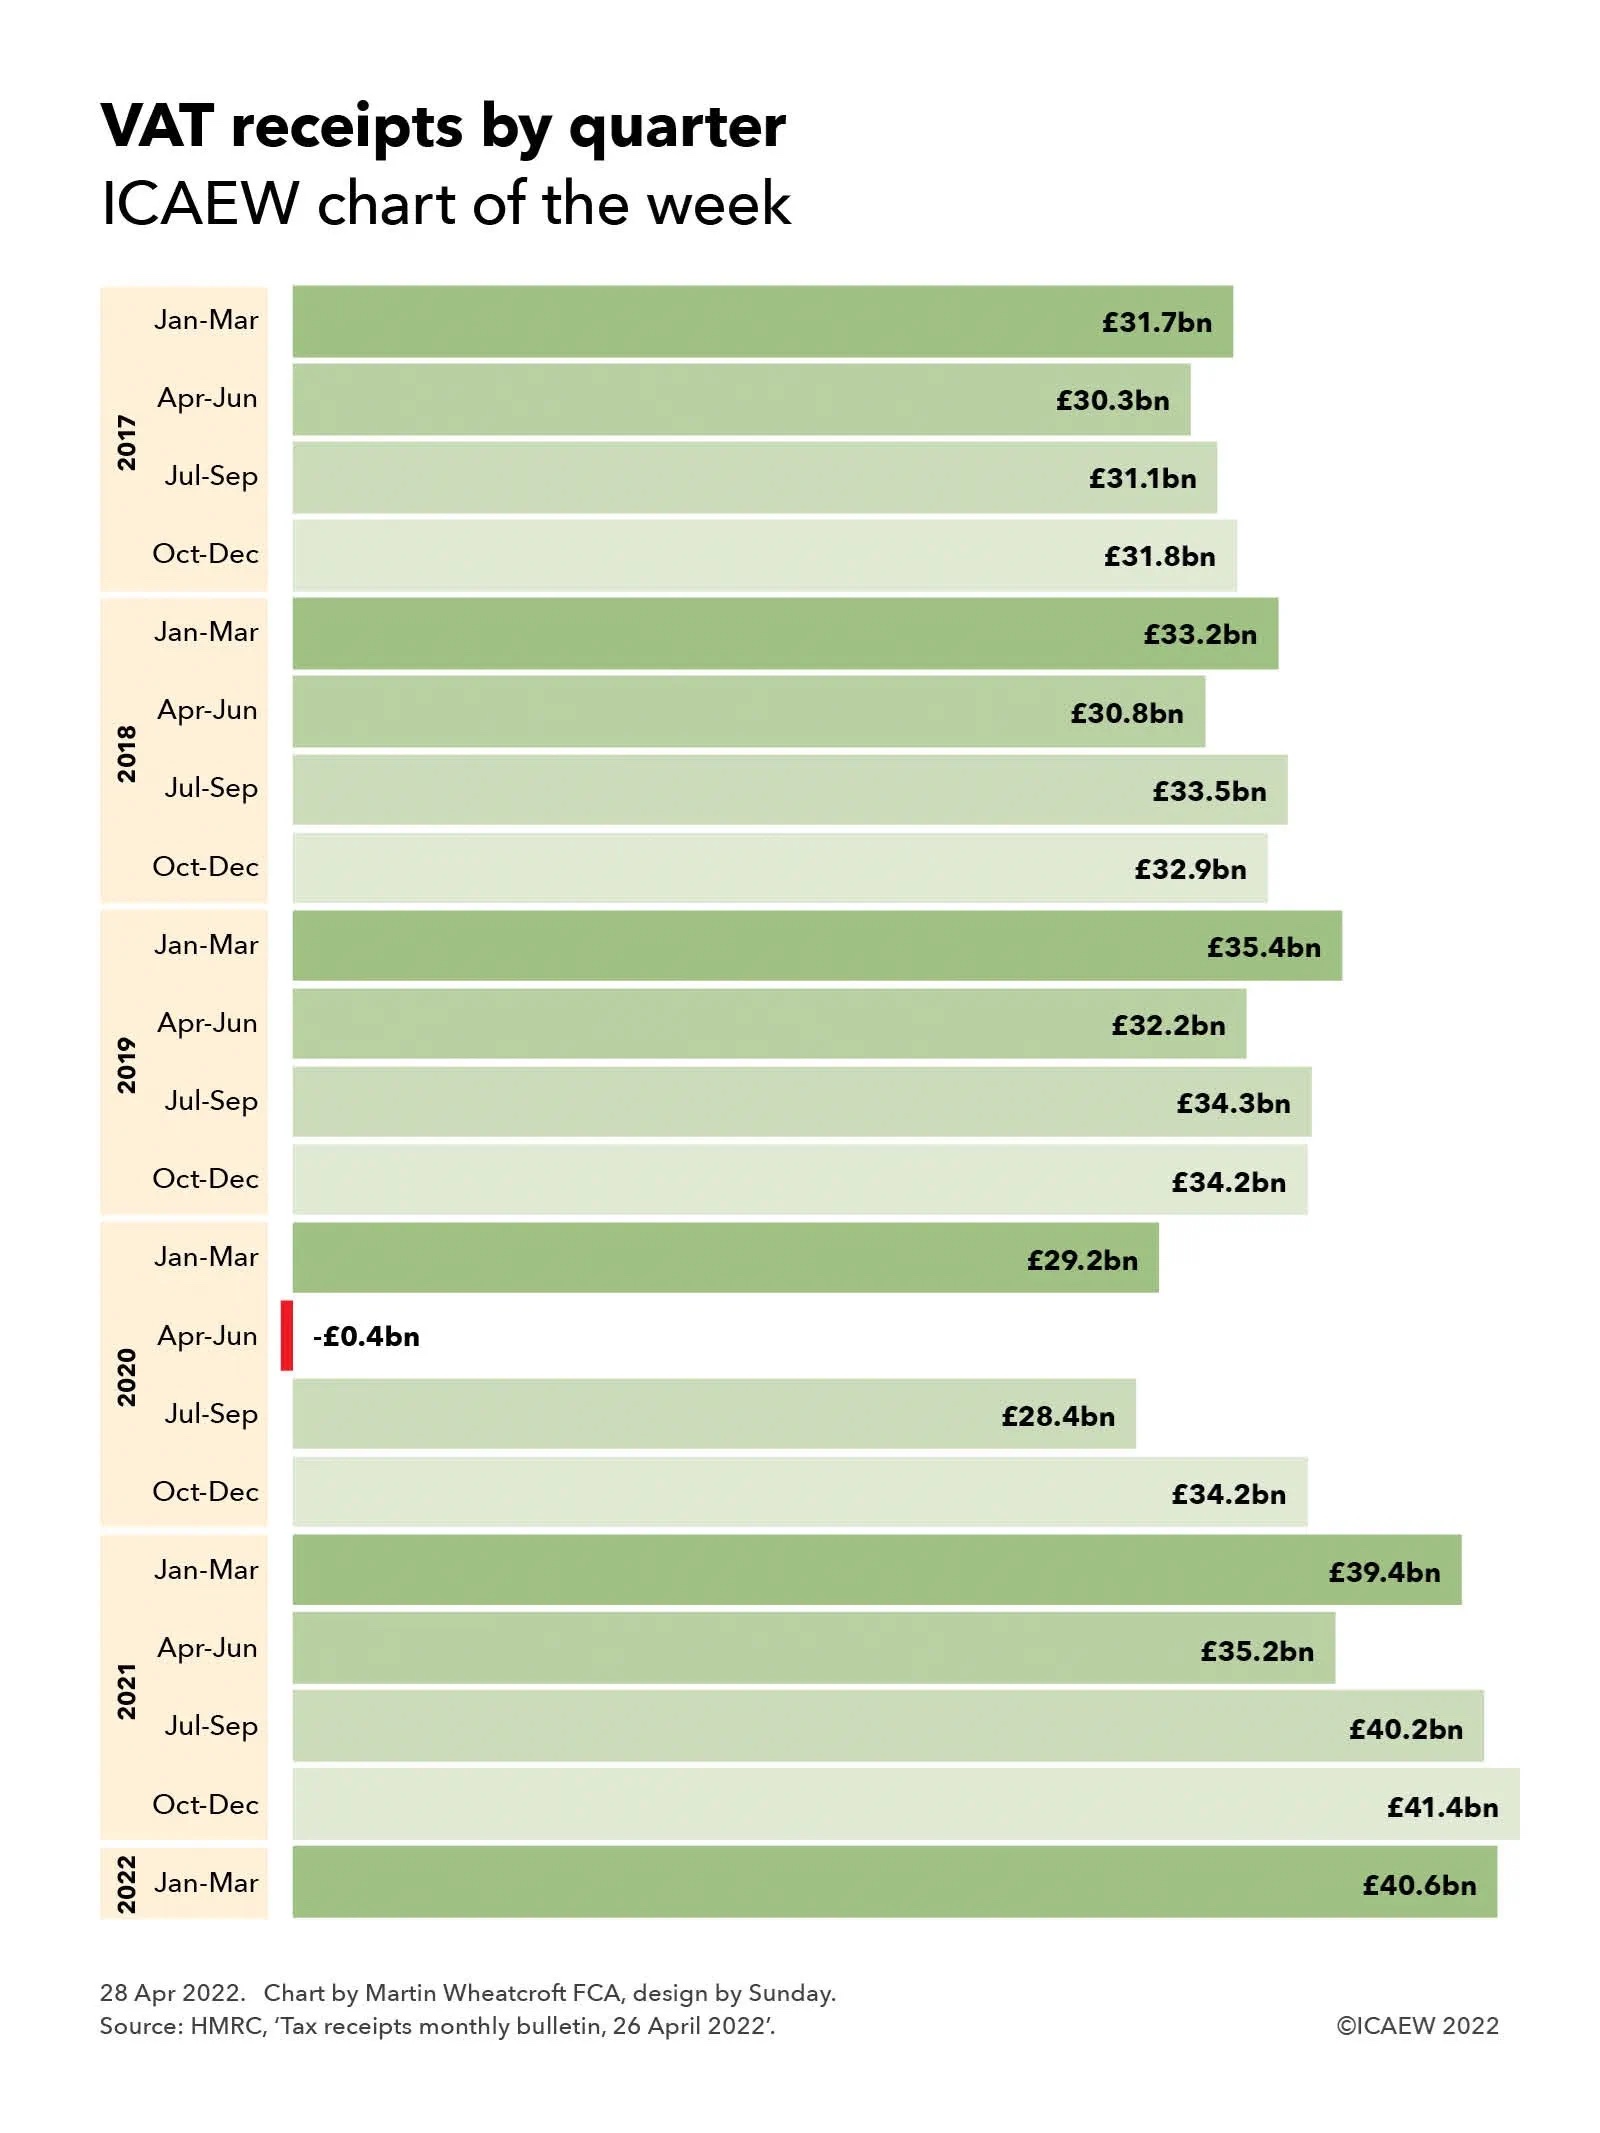
Tax and other receipts in the two months amounted to £147.5bn, £12.4bn or 9% higher than a year previously. This included higher income tax receipts from wage increases and bonuses as well as the new higher rate of national insurance, as well as higher VAT receipts driven by higher retail prices.
Expenditure excluding interest and investment for the year to date of £158.5bn was unchanged from the same period last year, as reduced spending on the pandemic including furlough programmes was offset by planned increases in spending announced in last year’s Spending Review and by additional support to households to help with their energy bills.
Interest amounted to £15.7bn in April and May, £6.1bn or 64% higher than the £9.6bn in the two months ended 31 May 2021, reflecting how higher interest rates and higher inflation are increasing the government’s cost of borrowing.
Net public sector investment in April and May 2022 was reported to be £9.2bn, which is £0.1bn lower than a year previously. This is slightly surprising given planned increases in capital expenditure as well as the subsidies given in the past two months to Bulb Energy, a failed energy supplier taken over by the government.
The increase in net debt of £21.2bn since the start of the financial year comprises the deficit for the month of £35.9bn less £14.7bn in net borrowing repayments. This reflects the recovery of loans to banks through the Bank of England’s Term Funding Scheme and of loans to businesses via the British Business Bank (including bounce-back and other coronavirus loans), offset by funding for student loans and other government cash requirements.
Alison Ring OBE FCA, Public Sector and Taxation Director for ICAEW, said: “A slightly higher deficit than expected in this month’s numbers and a rising interest bill will not provide any comfort for the Chancellor as he considers how to respond to public sector wage demands at the same time as attempting to build capacity for pre-election tax cuts next year.
“The economic storm clouds hovering over the fiscal outlook, as living standards go into reverse and inflation erodes the extent of planned investment in local communities, are likely to make the government’s ambition to level up the country even more difficult to achieve.”
Caution is needed with respect to the numbers published by the ONS, which are expected to be repeatedly revised as estimates are refined and gaps in the underlying data are filled.
The ONS made several revisions to the prior period fiscal numbers to reflect revisions to estimates. These had the effect of increasing the reported fiscal deficit for the month of April 2022 by £3.3bn from £18.6bn to £21.9bn and decreasing the reported fiscal deficits for the 12 months to March 2022 by £0.9bn from £144.6bn to £143.7bn and for the year ended 31 March 2021 by £7.7bn from £317.3bn to £309.6bn.