The OBR’s July 2023 fiscal risks and sustainability report indicates that, without higher taxes, public sector net debt as a share of GDP could triple or more over the next 50 years.
The Office for Budget Responsibility (OBR) published its latest fiscal risks and sustainability report on 13 July 2023, providing its analysis of the key risks confronting the UK public finances and long-term fiscal projections for the next 50 years.
This is a sobering report, suggesting that public sector net debt as a share of economic activity as measured by GDP could more than triple between March 2023 and March 2073 – and perhaps go even higher in certain circumstances. The OBR concludes that the public finances are on an unsustainable path.
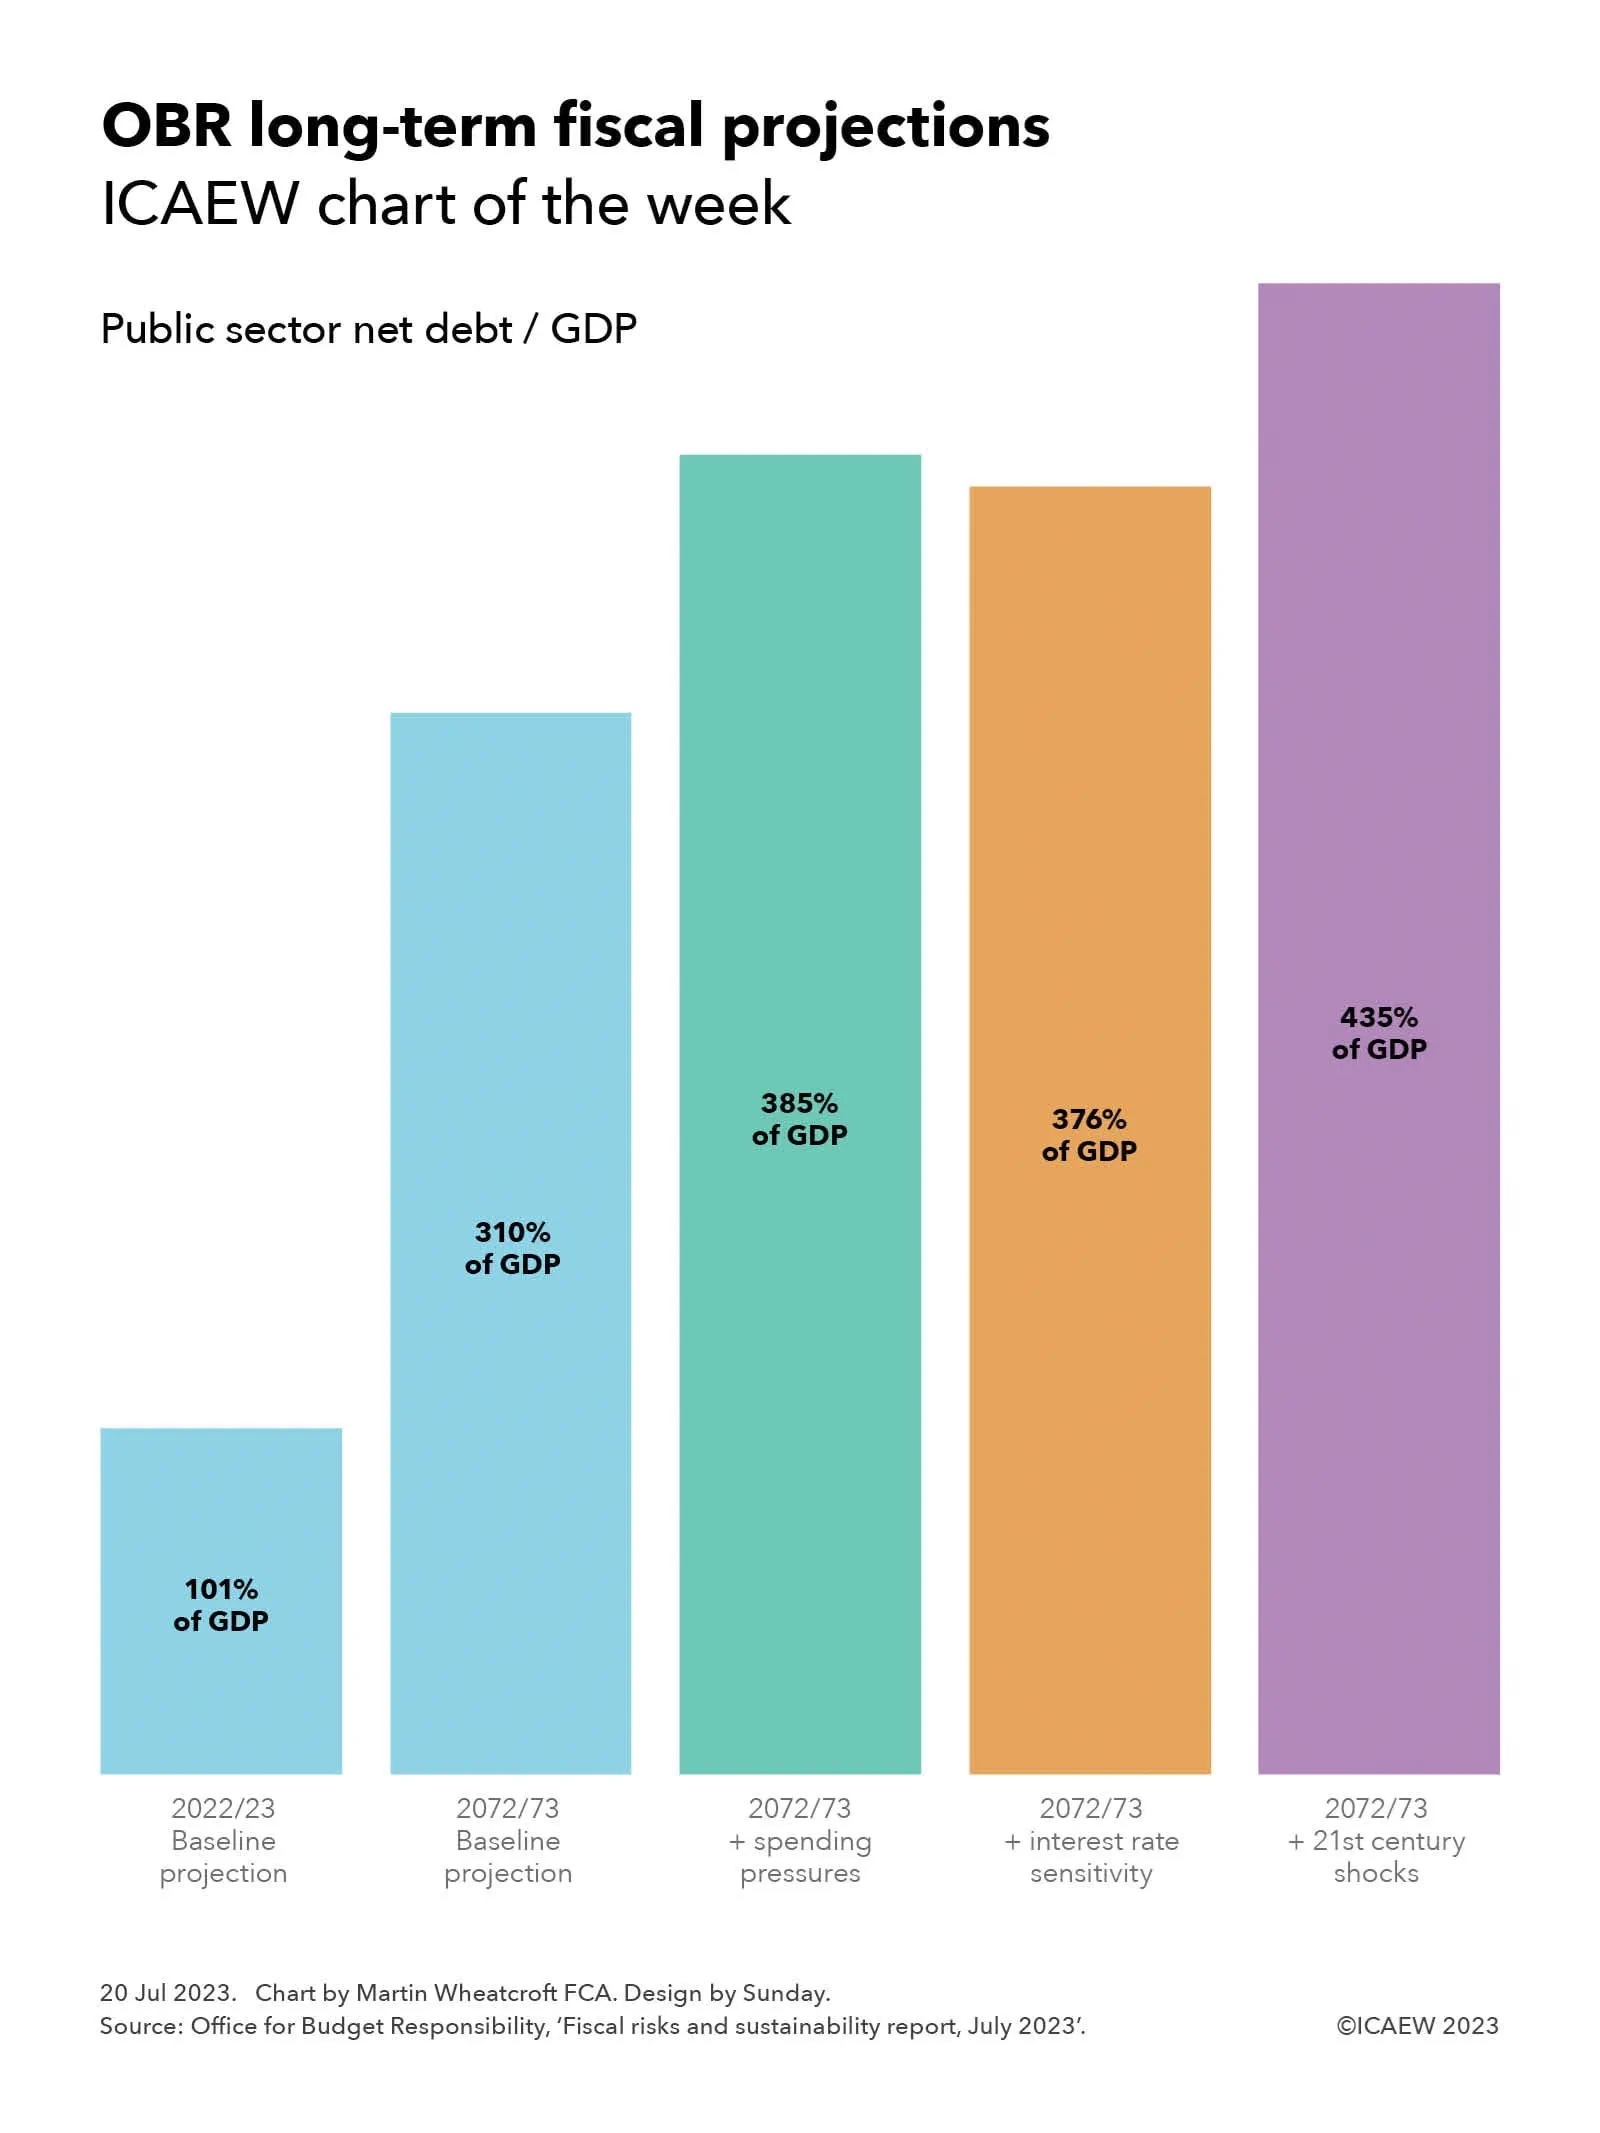
As illustrated by this week’s chart, the OBR’s baseline projection suggests that the ratio of public sector net debt to GDP could rise from 101% of GDP in 2022/23 to 310% of GDP in 2072/73. The OBR also presented three alternate scenarios: the first is based on higher levels of spending, which could result in the ratio reaching 385% of GDP; one involves higher interest rates, where the ratio might reach 376% of GDP; and a further scenario assuming additional economic shocks, where the ratio might hit 435% of GDP.
The projections are based on the government’s current medium-term fiscal plans as set out in the March 2023 Spring Budget, extrapolated into the future based on existing trends. The starting point is the already high level of public debt that has built up over the past 15 years, together with the current government’s plan to cut spending on public services over the next five years.
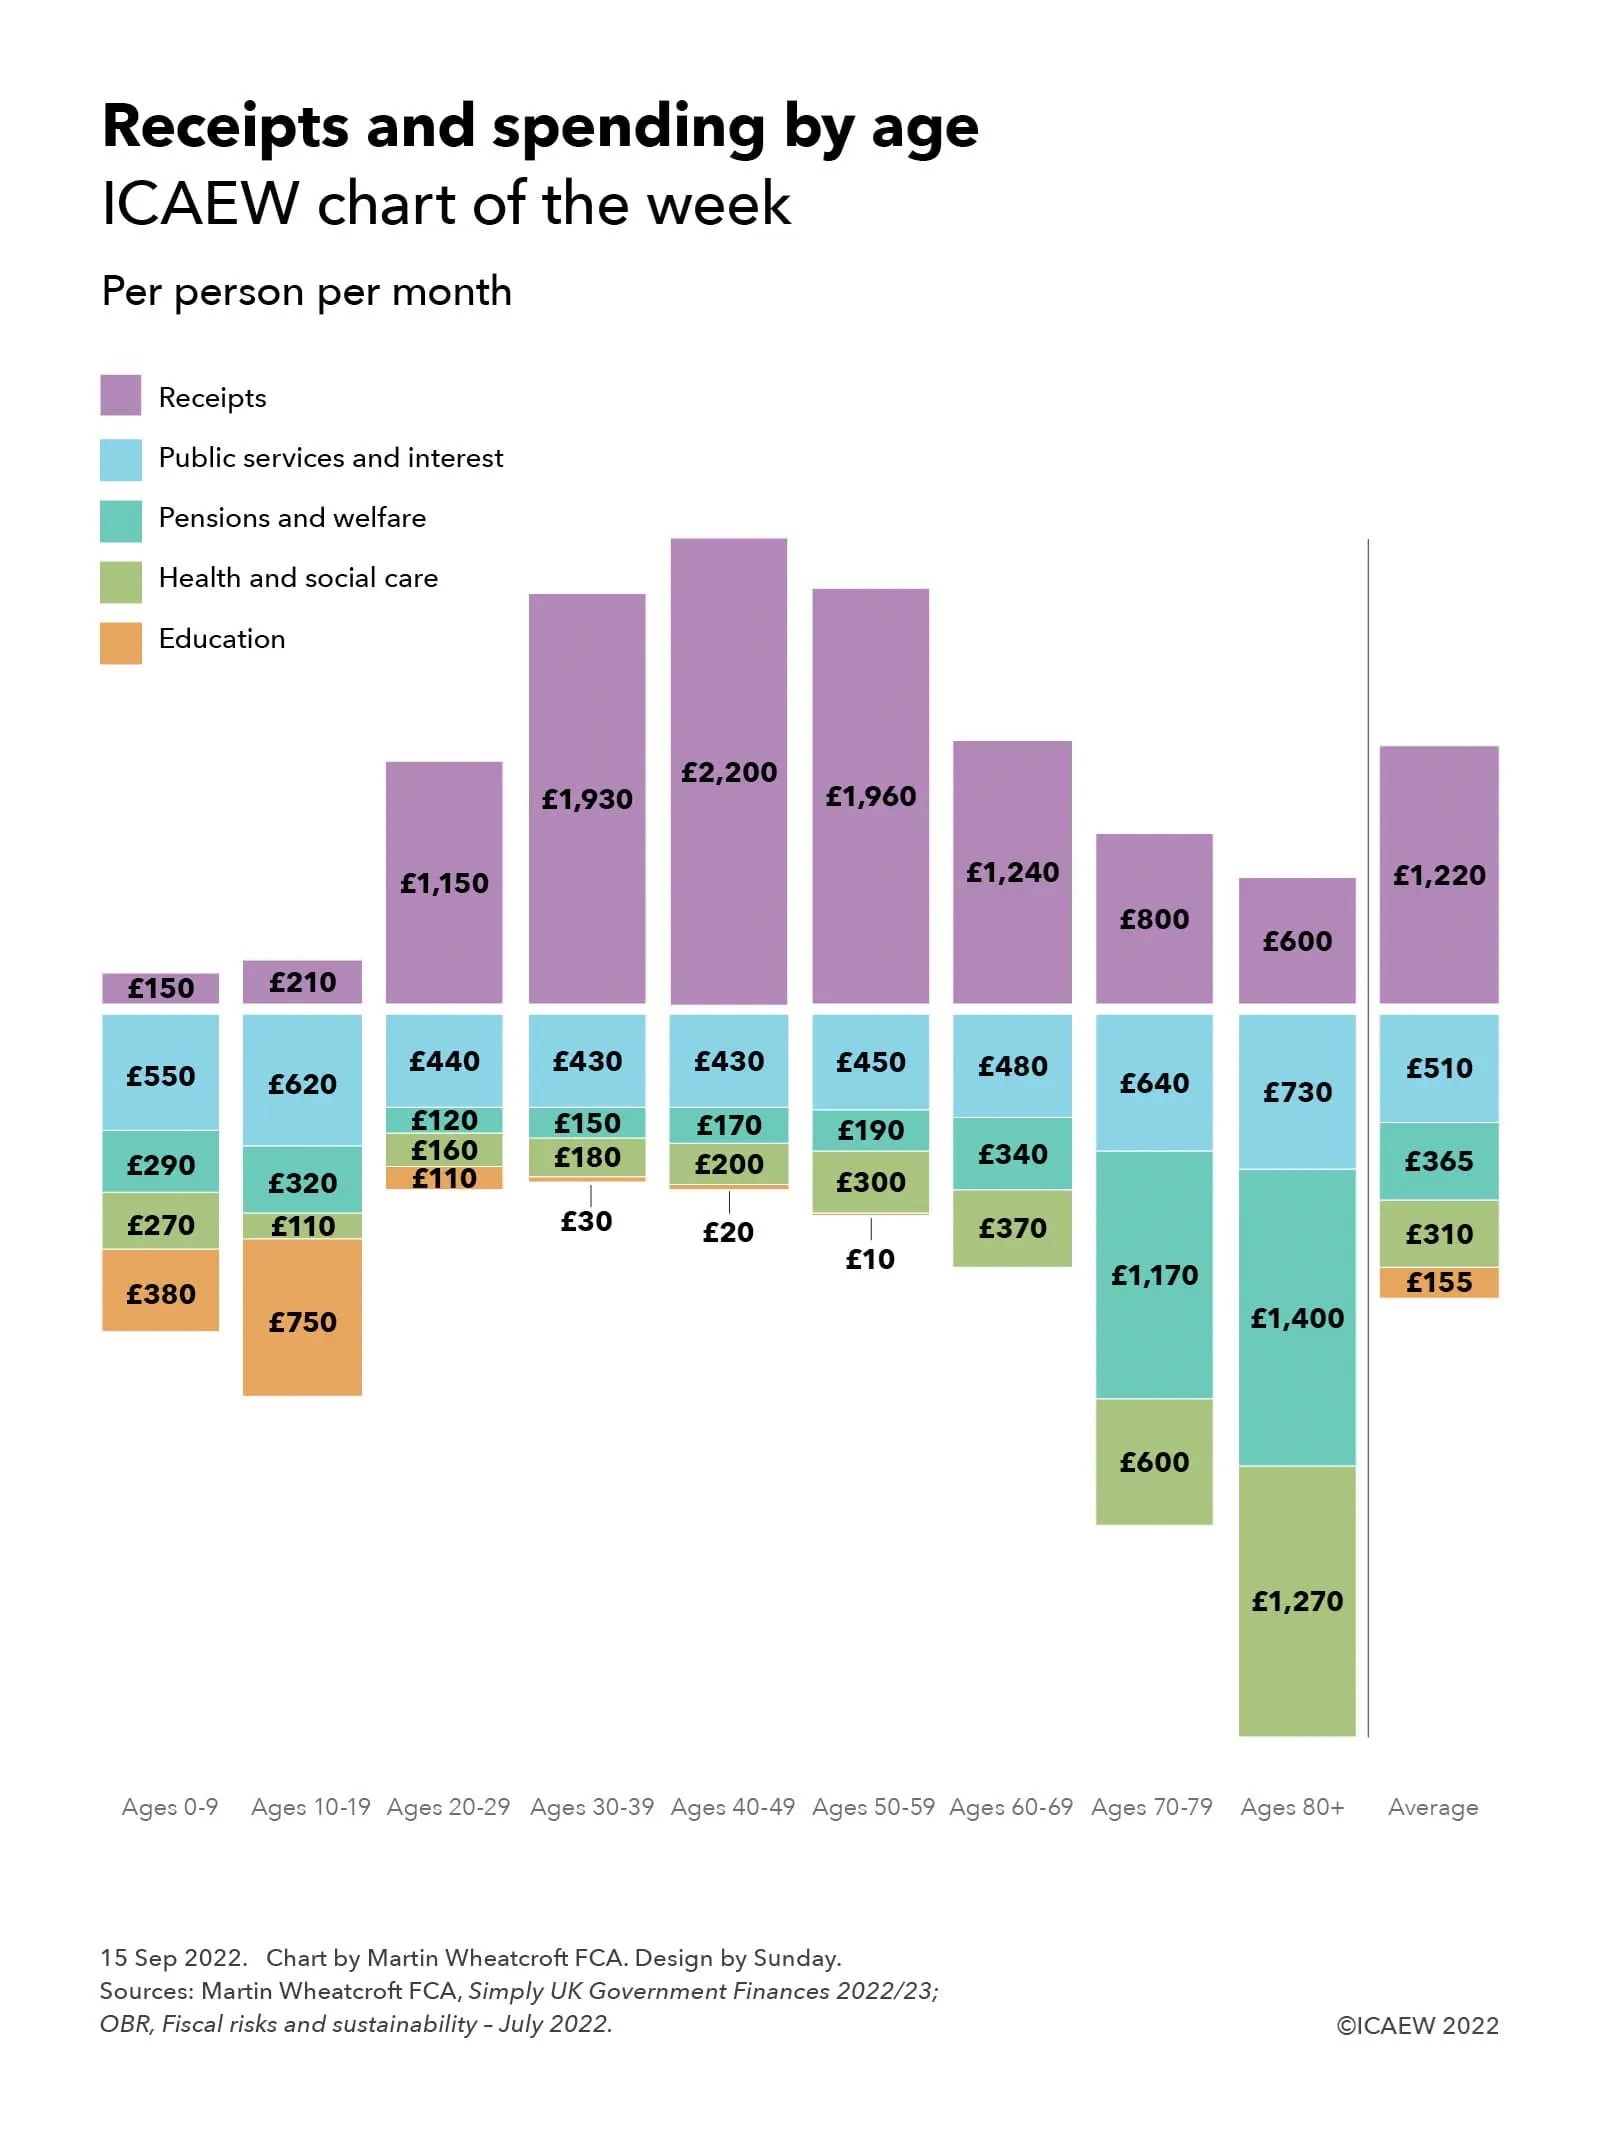
The OBR has then overlayed its view of economic growth over the next half century and expected changes in patterns of public spending. This reflects a substantial rise in spending on pensions, health and social care as the proportion of the population in retirement rises, among other drivers that include the financial costs and benefits of delivering net zero. Other key assumptions relate to productivity, demographics (births, deaths and net migration), interest rates and inflation.
The one thing the OBR hasn’t been able to do is to include probable but not enacted tax changes in its projections, with increases in public spending assumed to be financed by higher levels of borrowing instead of the tax rises that future governments are in reality going to opt for.
The projections therefore reflect borrowing that compounds over time to result in some very large headline debt numbers in March 2073, rather than the 1.5% of GDP rise in the tax burden each decade that would, according to the OBR, maintain the debt to GDP ratio at close to its current level.
The fiscal projections calculated by the OBR highlight just how difficult a position the UK’s public finances are in and the major fiscal challenges that will face the incoming government – whoever that may be – after the next general election.