ICAEW chart of the week: Government bond yields

11 December 2020: Ultra-low or negative yields provide governments with an opportunity to borrow extremely cheaply, but what will happen if and when interest rates rise?

Government 10-year bond yields

Germany -0.61%, Switzerland -0.59%, Netherlands -0.53%, France -0.36%, Portugal -0.02%, Japan +0.01%, Spain +0.02%, UK +0.26%, Italy +0.58%, Greece +0.60%, Canada +0.76%, New Zealand +0.91%, USA +0.95%, Australia +1.02%

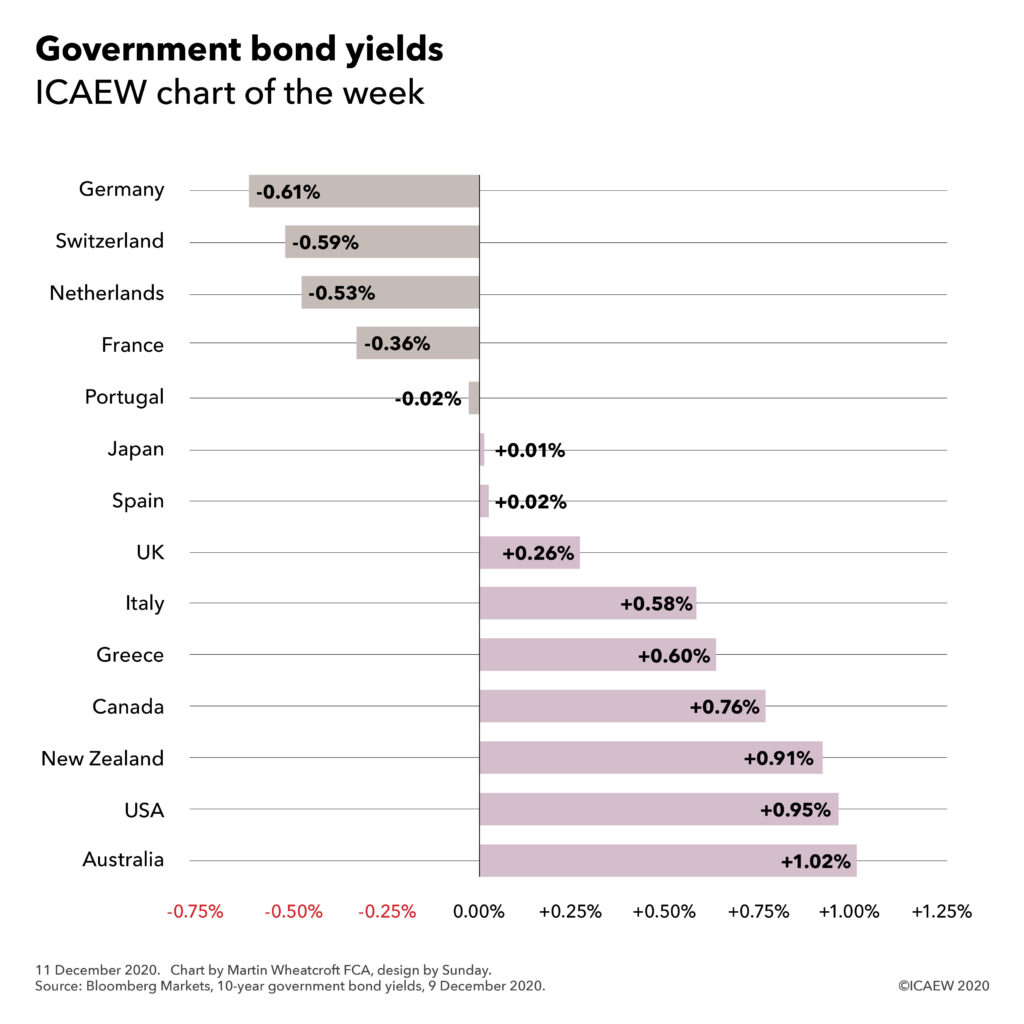
On 9 December, the benchmark ten-year government bond yield for major western economies ranged from -0.61% for investors in German Bunds through to 0.95% for US Treasury Bonds and 1.02% for Australia Government Bonds, as illustrated in the #icaewchartoftheweek.

One of the more astonishing developments of the last decade or so has been the arrival of an era of ultra-low or negative interest rates, even as governments have borrowed massive sums of money to finance their activities. This is not only a consequence of weak economic conditions and the slowing of productivity-led growth, but it has also been driven by the monetary policy actions of central banks through quantitative easing operations that have driven down yields by buying long-term fixed interest rate government bonds in exchange for short-term variable rate central bank deposits.

For bond investors this has been a wild ride, with the value of existing bonds sky-rocketing as central banks have come calling to buy a proportion of their holdings, crystallising their gains. The downside is the extremely low yields available to debt investors on fresh purchases of government bonds, which in some cases involve paying governments for the privilege of doing so.

Yields vary according to maturity, with yields on UK gilts ranging from -0.08% on two-year gilts through to 0.26% for 10-year gilts (as shown in the chart) up to 0.81% on 30-year gilts. In practice, the UK issues debt with an average maturity between 15 and 20 years, so the current average cost of its financing is higher than that shown in the chart at between 0.48% and 0.77% being the yields on 15-year and 20-year gilts respectively. This has the benefit of locking in low interest rates for longer, in contrast with most of the other countries shown that tend to issue debt with an average maturity of less than ten years.

Quantitative easing complicates the picture, as by repurchasing a significant proportion of government debt and swapping it for central bank deposits, central banks have reversed the security of fixed interest rates locked in to maturity with a variable rate exposure that will hit the interest line immediately if rates change. 

In theory, this should not be a problem, as higher interest rates are most likely to accompany stronger economic growth and hence higher tax revenues with which to pay the resultant higher debt interest bills, but in practice treasury ministers are not so sanguine. In leveraging public balance sheets to finance their responses to COVID-19 – on top of the legacy of debt from the financial crisis – governments have significantly increased their exposure to movements in interest rates, just as other fiscal challenges are growing more pressing.

Expect to hear a lot more over the coming decade about the resilience of public finances as governments seek to reduce gearing and reduce their vulnerability to the next unexpected crisis, whenever that may occur.

This chart was originally published on the ICAEW website.

ICAEW chart of the week: UK trade in goods

With less than a month to go before the UK leaves the EU Single Market and Customs Union, trade is high on the agenda as negotiations between the UK and the EU go down to the wire.

UK trade in goods in the year to September 2020: exports £338bn & imports £420bn

EU: £153bn & £230bn
Continuity deals: £49bn & £43bn
USA: £53bn & £38bn
China: £32bn & £54bn
Other: £51bn & £54bn

The #icaewchartoftheweek this week is on international trade, illustrating how exports and imports of goods amounted to £338bn and £420bn respectively in the year to 30 September 2020. This excludes £289bn and £181bn of services exports and imports over the same period that are also extremely important, but which are not the principal subjects of the free trade deal currently being negotiated.

The UK’s largest trading partnership for goods is with the members of the EU Customs Union (together with Turkey for non-agricultural products), with the UK exporting £153bn (45% of total goods exports) and importing £230bn (55% of total goods imports). 

This is followed by a further £49bn (15%) of exports to and £43bn (10%) of imports from 52 countries that have trade deals with the EU that the UK has been able to agree replacement trade arrangements with. These include Norway, Switzerland, Japan, South Korea, Canada and South Africa, with discussions underway to roll-over trade deals with a further 13 countries not included in these numbers, in particular with Singapore and Vietnam.

The UK’s two largest individual trading partners are the USA and China, where the UK will continue to trade on World Trade Organisation (WTO) terms. The UK exported £53bn (16%) of goods to the USA and imported £38bn (9%) in the year to September, while it exported £32bn (9%) to China and imported £54bn (13%).

The balance of goods trade, comprising exports of £51bn (15%) and imports of £54bn (13%), is with over 130 other countries and territories where the UK does not have a trade deal in place for after 1 January 2021, including India, Russia, Vietnam, Taiwan, the UAE, Saudi Arabia, Qatar, Thailand, Singapore, Australia, Malaysia and Nigeria.

Both exports and imports of goods have reduced in the year to September 2020 compared with a year previously, with exports down 7% and imports down 18%. The principal driver of the fall is the coronavirus pandemic, although reconfiguration of cross-border supply chains ahead of the end of the transition period may also be a factor.

Although global trade is expected to pick up in 2021 once covid-19 vaccines are widely available, there is significant uncertainty as to the effect on trade of the UK’s departure from the Single Market and Customs Union – with or without a deal. Either way, increased trade frictions are likely to have at least some impact, while the imposition of tariffs in the event of no deal could cause significant additional problems for key sectors such as car manufacturing and agriculture.

The size and closeness of the EU economy means that it will continue to be the most important trading partner for the UK whatever is agreed. If only we knew on what terms we are going to be trading in less than a month’s time and what the major changes that are coming in January will mean for the future!

This chart was originally published on the ICAEW website.

ICAEW chart of the week: Spending Review 2020

In the wake of the government’s Spending Review, this week’s chart focuses on the bigger picture and looks at the scale of public spending in relation to the size of the overall economy.

Spending Review 2020: Public spending as % of GDP

2019-20: Department spending 17.0% + other spending 12.3% + welfare 10.3% + covid 0.2% = 39.8%

2020-21: 19.3% + 13.3% + 11.5% + 12.2% = 56.3%

2021-22: 19.5% + 12.4% + 10.6% + 2.6% = 45.1%

2022-23: 19.2% + 12.2% + 10.6% = 42.0%

2023-24: 19.2% + 12.1% + 10.5% = 41.8%

2024-25: 19.3% + 12.1% + 10.5% = 41.9%

2025-26: Departmental spending 19.3% + other spending 12.0% + welfare 10.5% = 41.8%

There was a lot of substance in the Spending Review 2020 announced this week, with a lot more going on under the surface with – for example – the launch of the National Infrastructure Strategy. However, we thought we would focus on the bigger picture for the #icaewchartoftheweek and to look at the scale of public spending in relation to the size of the overall economy.

Of course, the current financial year has seen a massive expansion in the amount of public spending – up from £884bn or 39.8% of GDP of £2,218bn in 2019-20 to a revised budget of £1,165bn or 56.3% of GDP of £2,069bn. The combination of higher spending and a smaller economy this year makes for an eye-watering percentage.

Next financial year will see further COVID support measures adding to public spending, but the key takeaway from the chart is that public spending is expected to persist at around 42% of GDP from 2022-23 onwards, reflecting a permanently smaller economy following the pandemic combined with slightly higher spending in real terms. This is 2% higher than the just under 40% seen in 2019-20 and 3%-4% higher than the 38%-39% longer-run average.

Around half of the increase in departmental spending seen in the chart relates to capital investment in line with the government’s infrastructure plans, while the remainder relates to operational spending with more for health, education and defence being partially offset by the reduction in development spending and the one-off public sector pay freeze.

With scope for substantial reductions in public spending seen to be limited, there are two main routes for covering this increase in costs – economic growth to boost the size of the economy or higher taxes. The government will be hoping that its increase in capital investment will help to deliver on the former, but it appears increasingly likely that tax rises will be needed over the course of the coming decade.

This chart was originally published on the ICAEW website.

ICAEW chart of the week: UK claimant count

13 November 2020: The claimant count soared at the start of the pandemic but levelled off since then. Will a wave of redundancies see it climb again over the winter?

UK claimant count. Jan 2019: 1,012,000 (597,000 men, 415,000 women) - Mar 2020: 1,240,000 (724,000, 516,000) - May 2020: 2,663,000 (1,620,000, 1,043,000) - Sep 2020: 2,634,000 (1,571,000, 1,063,000).

This week’s #icaewchartoftheweek looks at the claimant count, an experimental statistic compiled by the Office for National Statistics (ONS) that seeks to reflect those on Universal Credit who are not in employment or who are required to search for work, in addition to those receiving Jobseeker’s Allowance.

As the chart illustrates, the claimant count had already been on an upward path prior to the pandemic as Universal Credit rolled out across the country, reaching a total of 1,240,000 on 8 March before jumping to 2,663,000 a couple of months later in May during the first lockdown. The number has moved around a little since then, dropping slightly to stand at 2,634,000 on 8 October, comprising 1,571,000 men and 1,063,000 women.

The rapid rise in claimants has not been reflected in the same way in the unemployment statistics, which increased less dramatically, albeit still significantly, from 1,355,000 in March to 1,661,000 in September 2020. This suggests around 300,000 of the increase in the claimant count is down to greater unemployment, with the balance of approximately 1,150,000 arising from ‘underemployment’ as claimants have had their hours and/or pay levels cut taking them below the relevant Universal Credit thresholds.

The recent rise in redundancies – up to a record 314,000 in the quarter to September – is likely to add further to the claimant count over the winter, although the extension in furlough arrangements until next March may constrain that rise to a certain extent.

News that a vaccine is on its way may well be positive for the second half of 2021, but in the meantime it is going to be a hard winter for many.

This chart was originally published by ICAEW.

ICAEW chart of the week: UK electricity projections

6 November 2020: Renewables, imports and nuclear are expected to provide around 85% of UK electricity generation by 2040, but will that be good enough to achieve carbon neutrality a decade later in 2050?

UK electricity projections chart (reference scenario):
Nuclear: 48 TWh in 2008, 62 TWh in 2020, 86 TWh in 2040.
Imports: 11 TWh, 28 TWh, 74 TWh.
Renewables: 23 TWh, 125 TWh, 188 TWh.
Carbon: 297 TWh, 109 TWh, 58 TWh in 2040.

The latest official energy and emissions projections, released by the Department for Business, Energy & Industrial Strategy (BEIS) on 30 October 2020, now extend out to 2040 – a decade before the 2050 target set by the UK Government to reach net zero.

The #icaewchartoftheweek takes a look at the progress being made on decarbonising electricity generation, with renewables, nuclear and imported electricity (much of which comes from nuclear or renewable sources) expected to increase from around 20% in 2008 to 66% this year and to just over 85% in 2040.

Overall electricity demand is expected to fall over the first half of the coming decade as improved energy efficiency and energy conservation measures (such as better insulation) continue to offset more demand from a growing population and economy (caveats apply). Lower demand in the residential and services sectors are then expected to be outweighed by higher demand for industrial and transport, particularly the latter as electric vehicles take to the roads.

Coal has now been almost entirely eliminated from electricity generation, falling from 118 TWh in 2008 (when there was also 6 TWh from oil and 173 TWh from natural gas) to 2 TWh projected in 2020 alongside 107 TWh from natural gas. Even so, coal may remain a small part of the mix even in 2040 as part of a projected 5 TWh of electricity from carbon capture and storage (CCS) plants. This should leave just 53 TWh from low (but still not no) carbon natural gas generation to eliminate over the subsequent decade.

Unfortunately, electricity is only part of the energy picture, with the reference scenario calculated by BEIS projecting that carbon sources will provide 980 TWh of final energy consumption in 2040 outside of electricity supply and direct power from renewables. This includes the equivalent of around 370 TWh from natural gas used domestically, 250 TWh from diesel and petrol used in transport, and 160 TWh from aviation fuels.

So while there continues to be welcome progress in greening the electricity supply, achieving net zero overall is not going to be as easy.

This chart was originally published on the ICAEW website.

ICAEW chart of the week: US federal deficit

30 October 2020: The US federal government spent $3.1tn more than it received in the year to 30 September 2020, more than three times the $1.0tn deficit incurred in 2019.

Chart showing US federal deficit for the year to 30 Sep 2020. Receipts £3.4tn, deficit $3.1tn and outlays $6.5tn.

The #icaewchartoftheweek is on the $3.1tn deficit incurred by the United States federal government, according to its preliminary financial results for the 2020 fiscal year published by the Bureau of the Fiscal Service, a unit of the US Department of the Treasury. 

Analysis by the US Congressional Budget Office reports that receipts of $3.4tn were 1% lower than in the previous financial year, which can broadly be split into a 6% increase in the first half from October 2019 to March 2020 and a 7% decrease in the second half of the year ending in September. 

As illustrated by the chart, the principal sources of revenue are $1.3tn in social security payroll tax deductions and $1.6tn in personal income taxes, together with $0.2tn in corporate income taxes and $0.3tn from excise taxes, customs duties, estate and gift taxes and other net receipts.

Outlays of $6.5tn in FY2020 were $2.1tn or 47% higher than in the FY2019, reflecting a 7% increase in the first half and an 87% increase in the second half. These increases were principally driven by the fiscal response to the coronavirus pandemic, including $0.6tn for small business furlough programmes, a $0.4tn increase in unemployment compensation, $0.3tn more in refundable tax credits, $0.2tn in emergency health measures and over $0.1tn for the Coronavirus Relief Fund. Other increases included $0.1tn in student loan subsidies, $0.3tn in federal reserve investments and $0.2tn in other increases, offset by a $0.1tn reduction in interest costs.

Outlays can broadly be split between $4.7tn of ‘mandatory’ spending on welfare, $0.3tn in interest costs and $1.5tn in ‘discretionary’ spending by the federal government. 

Welfare comprises spending on social security (principally pensions), Medicare and Medicaid (healthcare), veterans, income security (unemployment benefits and tax credits) and the Paycheck Protection Program for small businesses, while spending on the federal government is dominated by the $0.7tn spent on defence, followed by $0.2tn on education, $0.1tn on homeland security and justice, $0.1tn on transport and $0.4tn on everything else.

It is important to stress that these receipts and outlays relate only to the federal government and exclude what is normally in the region of $3tn in receipts and spending of state and local governments across the US. There is usually a surplus at the state and local level but this year is likely to be different as state and local tax revenues collapse and spending to tackle the pandemic locally continues to grow.

External public debt was $21.0tn at 30 September 2020, an increase of $4.2tn or 25% over the $16.8tn the US federal government owed a year previously, reflecting borrowing to fund the $3.1tn deficit and a net $1.1tn in lending, principally to businesses as part of the coronavirus response.

Even more borrowing is probable irrespective of which candidate wins the presidential election next week as the US struggles to get the pandemic under control and the increasing likelihood that Congress will pass a multi-trillion dollar stimulus bill after the election is over.

This chart was originally published on the ICAEW website.

ICAEW chart of the week: Half year public spending and receipts

23 October 2020: The gap between spending and receipts widened to £208bn in the half-year to September 2020, significantly greater than the £80bn in the first half of 2009-10 at the height of the financial crisis.

Line chart showing half-yearly spending and receipts with a shaded gap between them highlighting the deficit. A huge widening occurs in the most recent half year.

The #icaewchartoftheweek is on UK public spending and receipts in the light of the September 2020 public finance release that reported a fiscal deficit of £208bn for the six months ended 30 September 2020, comprising public spending of £567bn less receipts of £359bn.

The chart illustrates how the shortfall in receipts and public spending of £26bn (public spending £289bn – receipts £263bn) and £14bn (£303bn – £289bn) in the first and second halves of 2006-07 increased to £80bn (£347bn – £267bn) and £78bn (£375bn – £297bn) in 2009-10 before gradually declining to £31bn (£421bn – £390bn) and £8bn (£433bn – £425bn) in the first and second halves of 2018-19 respectively.

The chart highlights how deficits added up over a decade (a cumulative £1.1tn between 1 April 2008 and 31 March 2018) even as the gap between spending and receipts narrowed as well as how much the shortfall has widened in the first half of 2020-21. With a further £140bn or so shortfall expected in the second of the financial year, it will take a strong economic rebound to prevent another trillion of deficits accumulating over the coming decade.

Although the Spending Review in November will now only cover the 2021-22 financial year for current expenditure, it is expected to set capital expenditure budgets for 2022-23 as well. This will be important in giving departments confidence to get infrastructure spending projects underway as quickly as possible next year if there is to be an investment-led economic recovery.

Read more about the September 2020 public finances: Half-year deficit reaches £208bn as COVID costs continue to accumulate.

This chart was originally published on the ICAEW website.

Half-year deficit reaches £208bn as COVID costs accumulate

22 October 2020: Public finances remain on track for the worst peace-time deficit ever, thanks to lower receipts and large-scale coronavirus interventions.

The latest public sector finances reported a deficit of £36.1bn in September 2020, a cumulative total of £208.5bn for the first six months of the financial year.

Falls in VAT, corporation tax and income tax drove lower receipts, while large-scale fiscal interventions resulted in much higher levels of expenditure. Net investment is greater than last year, as planned, while the interest line has benefited from ultra-low interest rates.

Public sector net debt increased to £2,059.7bn or 103.5% of GDP, an increase of £259.2bn from the start of the financial year and £274.0bn higher than in September 2019. This reflects £50.7bn of additional borrowing over and above the deficit, most of which has been used to fund coronavirus loans to business and tax deferral measures.

Commenting on the figures Alison Ring, ICAEW Director for Public Sector, said: “The deficit of £208bn is already more than the full-year deficit at the height of the financial crisis a decade ago and remains on track to be the largest ever outside the two world wars. 

“The economic damage caused by the pandemic in the first half of the fiscal year was not as bad as originally feared, thanks in part to the extraordinary level of financial support provided by the Chancellor. However, the second wave is putting further strain on the public finances as new regional restrictions are placed on economic activity.

To help the recovery the Chancellor must take the opportunity at the Autumn Statement and Spending Round to invest in preparing infrastructure projects to start as soon as possible.”

Image of table showing public finances for month of September and six months to September together with variances from last year. Click on link to the article on the ICAEW website for a readable version.

The combination of receipts down 11%, expenditure up 34% and net investment up 37% has resulted in a deficit for the six months to September 2020 that is approaching four times the budgeted deficit of £55bn for the whole of the 2020-21 financial year set in the Spring Budget in March. This is despite interest charges being lower by 24%. The cumulative deficit is more than six times as much as for the same six-month period last year.

Cash funding (the ‘public sector net cash requirement’) for the six months was £257.8bn, compared with £7.1bn for the same period in 2019.

Interest costs have fallen despite much higher levels of debt, with extremely low interest rates benefiting both new borrowing to fund government cash requirements and borrowing to refinance existing debts as they have been repaid.

The Institute for Fiscal Studies’ recent IFS Green Budget 2020 annual pre-Budget report indicated that the deficit for the full year to March 2021 could reach £350bn or 17% of GDP.

Some caution is needed with respect to the numbers published by the ONS, which are expected to be repeatedly revised as estimates are refined and gaps in the underlying data are filled. In particular, the OBR points out that the ONS has yet to record any allowance for losses that might arise on the more than £100bn of tax deferrals, loans and guarantees provided to support businesses through the pandemic.

Image of table showing public finances for each month to September 2020 and for each month to September 2019. 

Click on link to the article on the ICAEW website for a readable version.

The ONS made a number of revisions to prior month and prior year fiscal numbers to reflect revisions to estimates and changes in methodology. These had the effect of reducing the reported fiscal deficit in the first five months from the £173.7bn reported last time to £172.4bn and reducing the reported deficit for 2019-20 from £55.8bn to £54.5bn.

For further information, read the public sector finances release for September 2020.

This article was originally published on the ICAEW website.

ICAEW chart of the week: UK debt financing requirement

16 October 2020: The Institute for Fiscal Studies annual pre-Budget report forecasts a doubling to £1.5tn in the amount of debt to be raised by the UK Government over the next five years.

UK debt financing requirement by year from 2020-21 to 2024-25, adding up to £757bn (March 2020 budget), £1,305bn (optimistic), £1,536bn (central) and £1,789bn (pessimistic forecast).

Although the Budget itself may have been delayed, the IFS Green Budget 2020 has been published on schedule, with a wealth (if that is the right word in the current context) of analysis on the economy and the public finances. 

With £201bn in discretionary measures and a £95bn economic impact from the coronavirus pandemic, the IFS is forecasting that the deficit will reach £350bn in the current financial year. At 17% of GDP, this is a level never before seen in the UK outside of the two world wars. 

Unfortunately, the effect of the pandemic on public finances will not be restricted to this financial year. Even if the economy recovers in 2021, or more likely in 2022, tax revenues will be significantly lower and spending significantly higher than they were previously expected to be.

This is perhaps best highlighted by looking at the UK Government’s gross financing requirement – the amount that the UK Debt Management Office (DMO) will be tasked with raising from external debt investors over the next five years to finance the shortfall in taxes compared with spending (the deficit), to finance business and other lending and to repay existing debts as they fall due. This is forecast by the IFS to double to £1.5tn in their central forecast, within a range from £1.3tn in a more optimistic scenario to £1.8tn in a more pessimistic scenario.

As the IFS points out, the enormous amount of debt being issued means that even small differences in financing costs will have a very large impact on the public finances. This is despite the sizeable proportion of debt being issued with long maturities (as long as 50 years in some case) that are locking in extremely low interest rates for decades to come.

Reducing interest costs on debt has provided the Chancellor with room to provide the unprecedented levels of financial support to the UK economy that we saw over the summer. The prospect of negative nominal rates could see investors paying the Government rather than the other way round, providing headroom for further interventions.

There is a downside, of course. The ‘good times’ of ultra-low interest rates may not last for ever, and with a central debt forecast at 31 March 2025 of 112% of GDP significantly higher than the 35% of GDP before the financial crisis a dozen years ago the exposure to changes in interests is that much more significant.

To find out more about the latest forecasts for the economy and the impact that will have on the public finances, please do read the IFS Green Budget 2020.

This chart was originally published by ICAEW.

ICAEW chart of the week: Local government in England

9 October 2020: The complex structure of regional and local authorities in England is just begging for reform, but will the rumoured plan to abolish county and district councils fix it for good?

Chart with three rings: regional tier, county or unitary tier and then district council tier, showing lots and lots of councils in England.

Local government in England, as illustrated by the #icaewchartoftheweek, is pretty complex with eight different types of regional or principal authority and a patchwork quilt of different tiers of government across the country.

This complex system comprises areas without a regional tier of government involving unitary authorities or county & district councils, and those with combined authorities atop unitary authorities or metropolitan boroughs (and one county and its districts) and the Greater London Authority atop 32 London boroughs and the City of London. (This excludes the 9,000 or so town, village and other forms of parish councils in England, mostly outside the major urban areas).

This complexity makes it very difficult for the Government to interact with local authorities in the absence of a consistent model of local government or a country-wide regional tier of government to act as intermediary. This contrasts (for example) with the federal system in Germany, where Chancellor Angela Merkel regularly speaks to the leaders of the 16 German states, who in turn deal with the local authorities in their areas. Similarly (although not formally federal), France has 13 mainland and 5 overseas regional administrations that President Emmanuel Macron and Prime Minister Jean Castex can talk to and who will deal with their constituent provinces.

The UK Government can and does communicate with London Mayor Sadiq Khan, Greater Manchester Mayor Andy Burnham, West Midlands Mayor Andy Street, West Yorkshire Chair Susan Hinchcliffe, Liverpool City Region Mayor Steve Rotherham, Sheffield City Region Mayor Dan Jarvis, North East Chair Iain Malcolm, West of England Mayor Tim Bowles, Cambridgeshire & Peterborough Mayor James Palmer, North of Tyne Mayor Jamie Driscoll and Tees Valley Mayor Ben Houchen, each of whom can represent their constituent local authorities. But, they only represent 44% of the English population, with a further 24 county council leaders and 46 unitary authority leaders to speak to cover the remaining 56%. That is a pretty big Zoom call, assuming borough and unitary leaders within the regional authority areas don’t also insist on joining in.

The delayed announcement of a plan to abolish the 25 county and 188 district councils and replace them with between 25 and 40 new unitary authorities (perhaps with some mergers with existing unitary authorities) will go some way to rationalising the existing system by going to a single tier of principal local authorities. This would bring local public services together under one roof and save money, albeit there are some concerns about whether some of the new authorities would be too remote from the local citizenry.

However, this is still likely to leave English local government reform unfinished with over half the country without a regional tier of government. Will the Government want to continue with its existing organic approach of combined authority formation or go for a more comprehensive programme to establish regional authorities across the whole country, similar to the French reforms of the 1980s?

This chart was originally published by ICAEW.