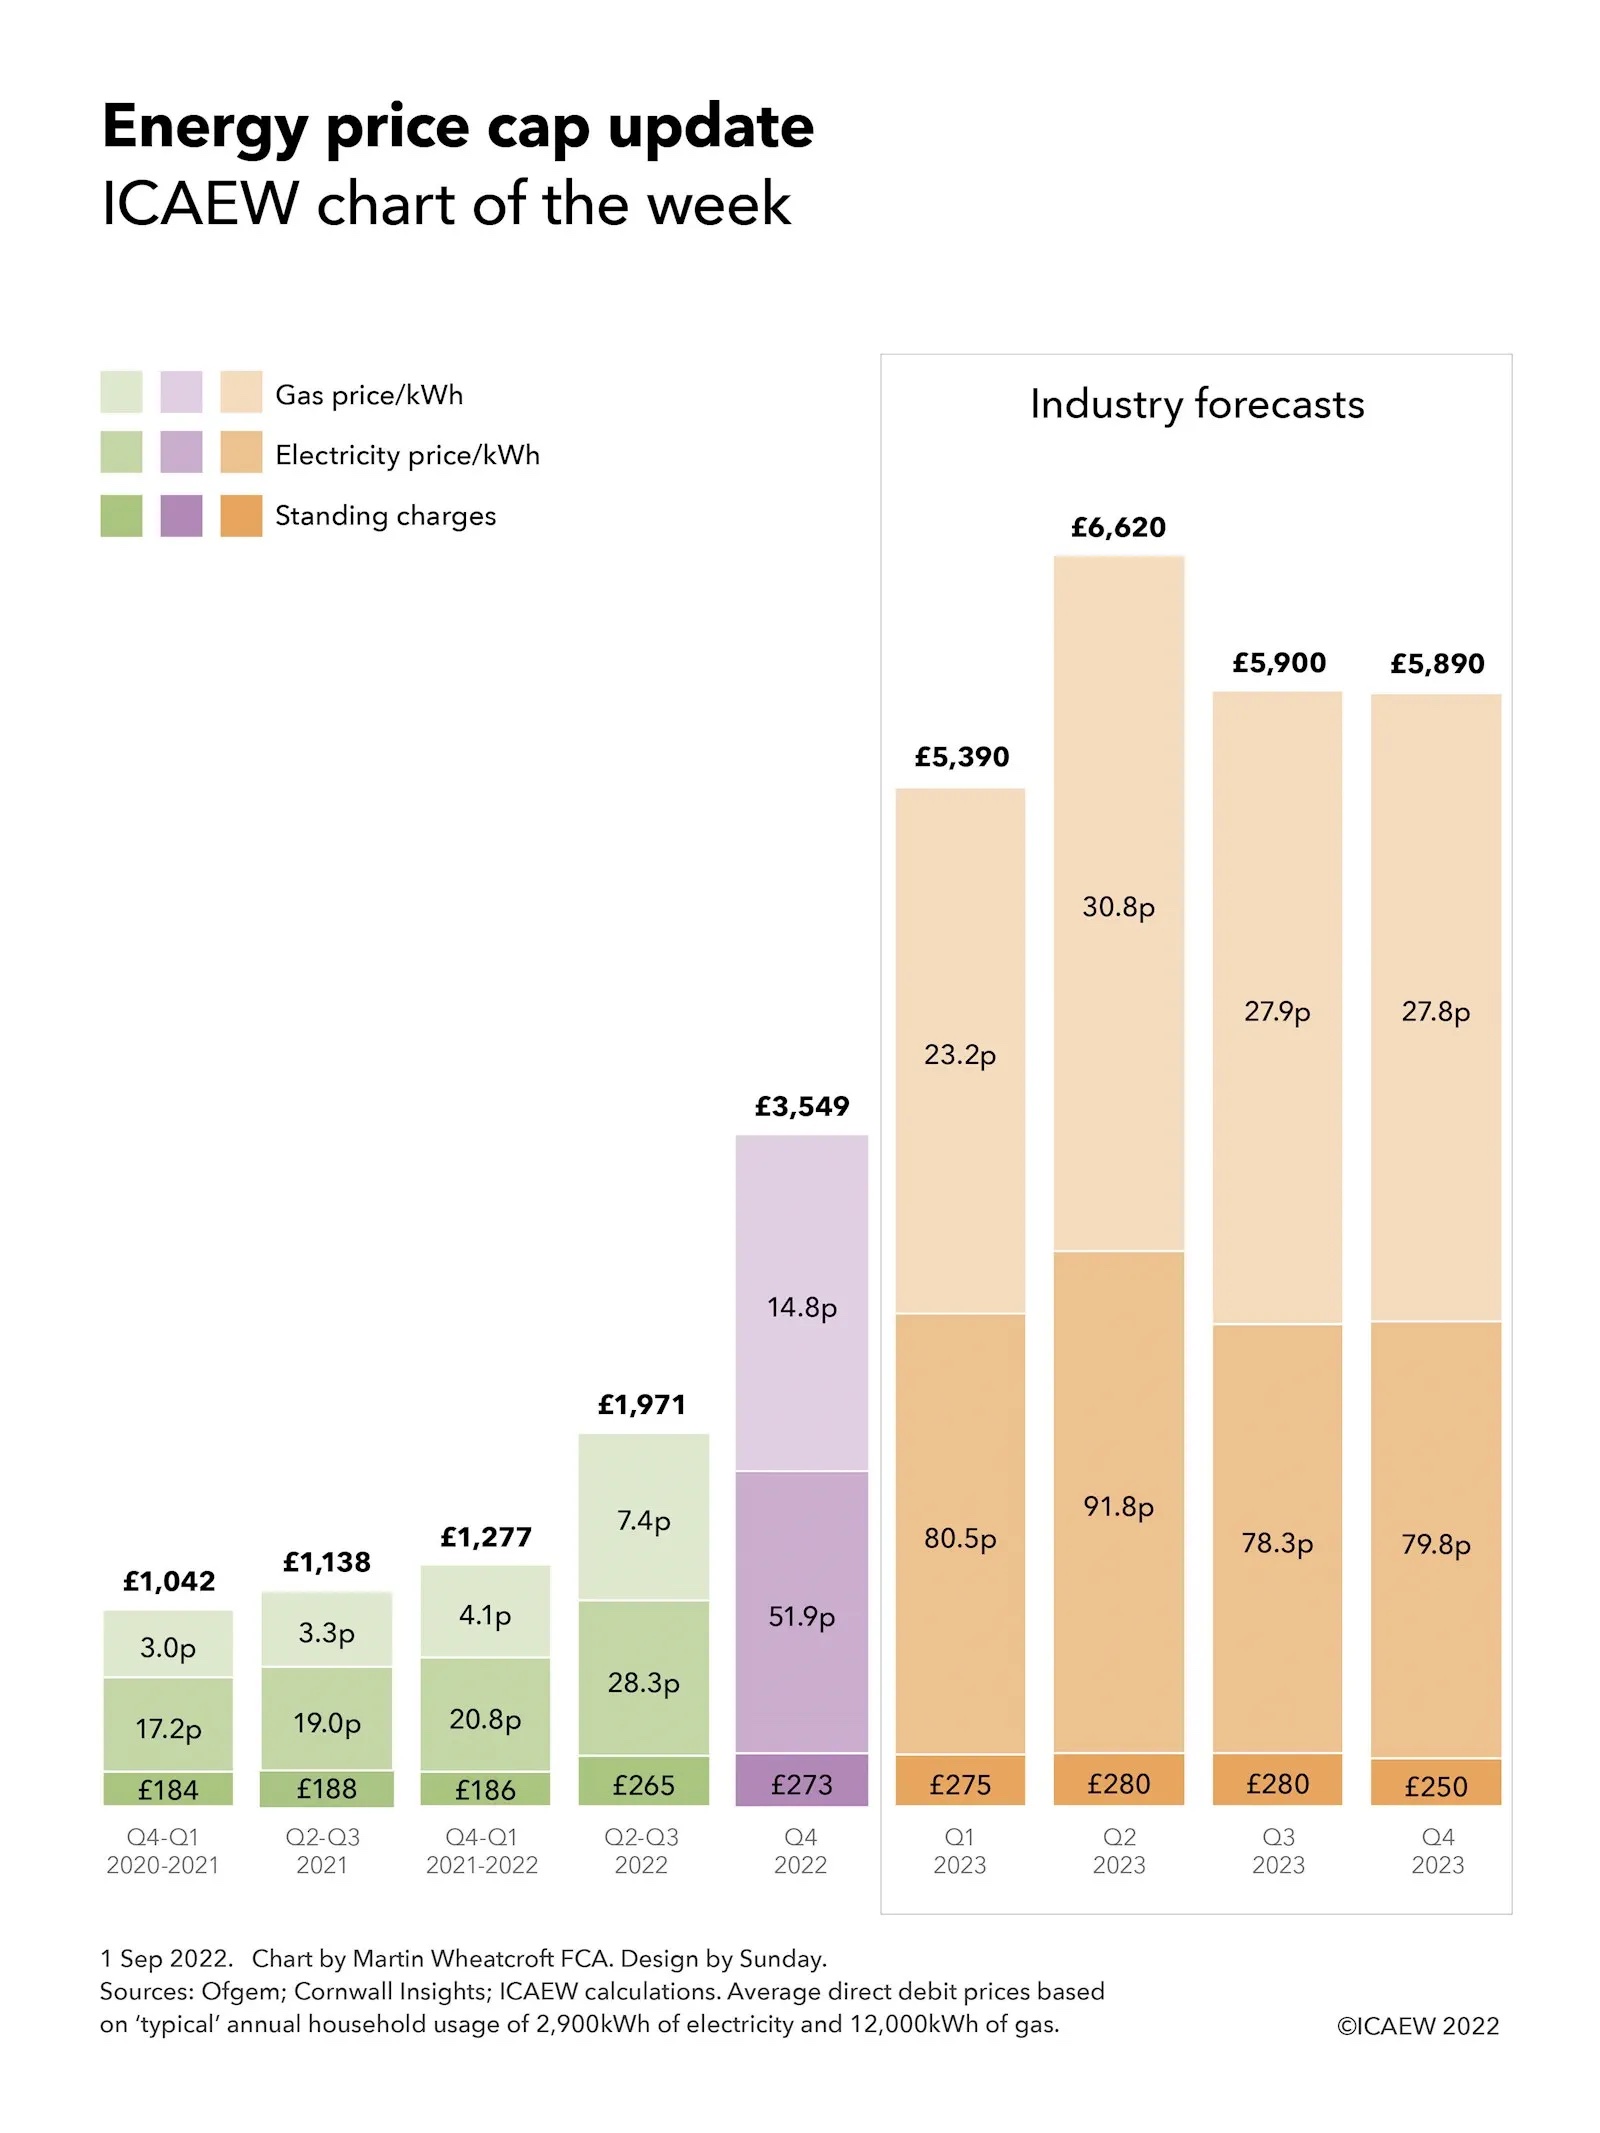
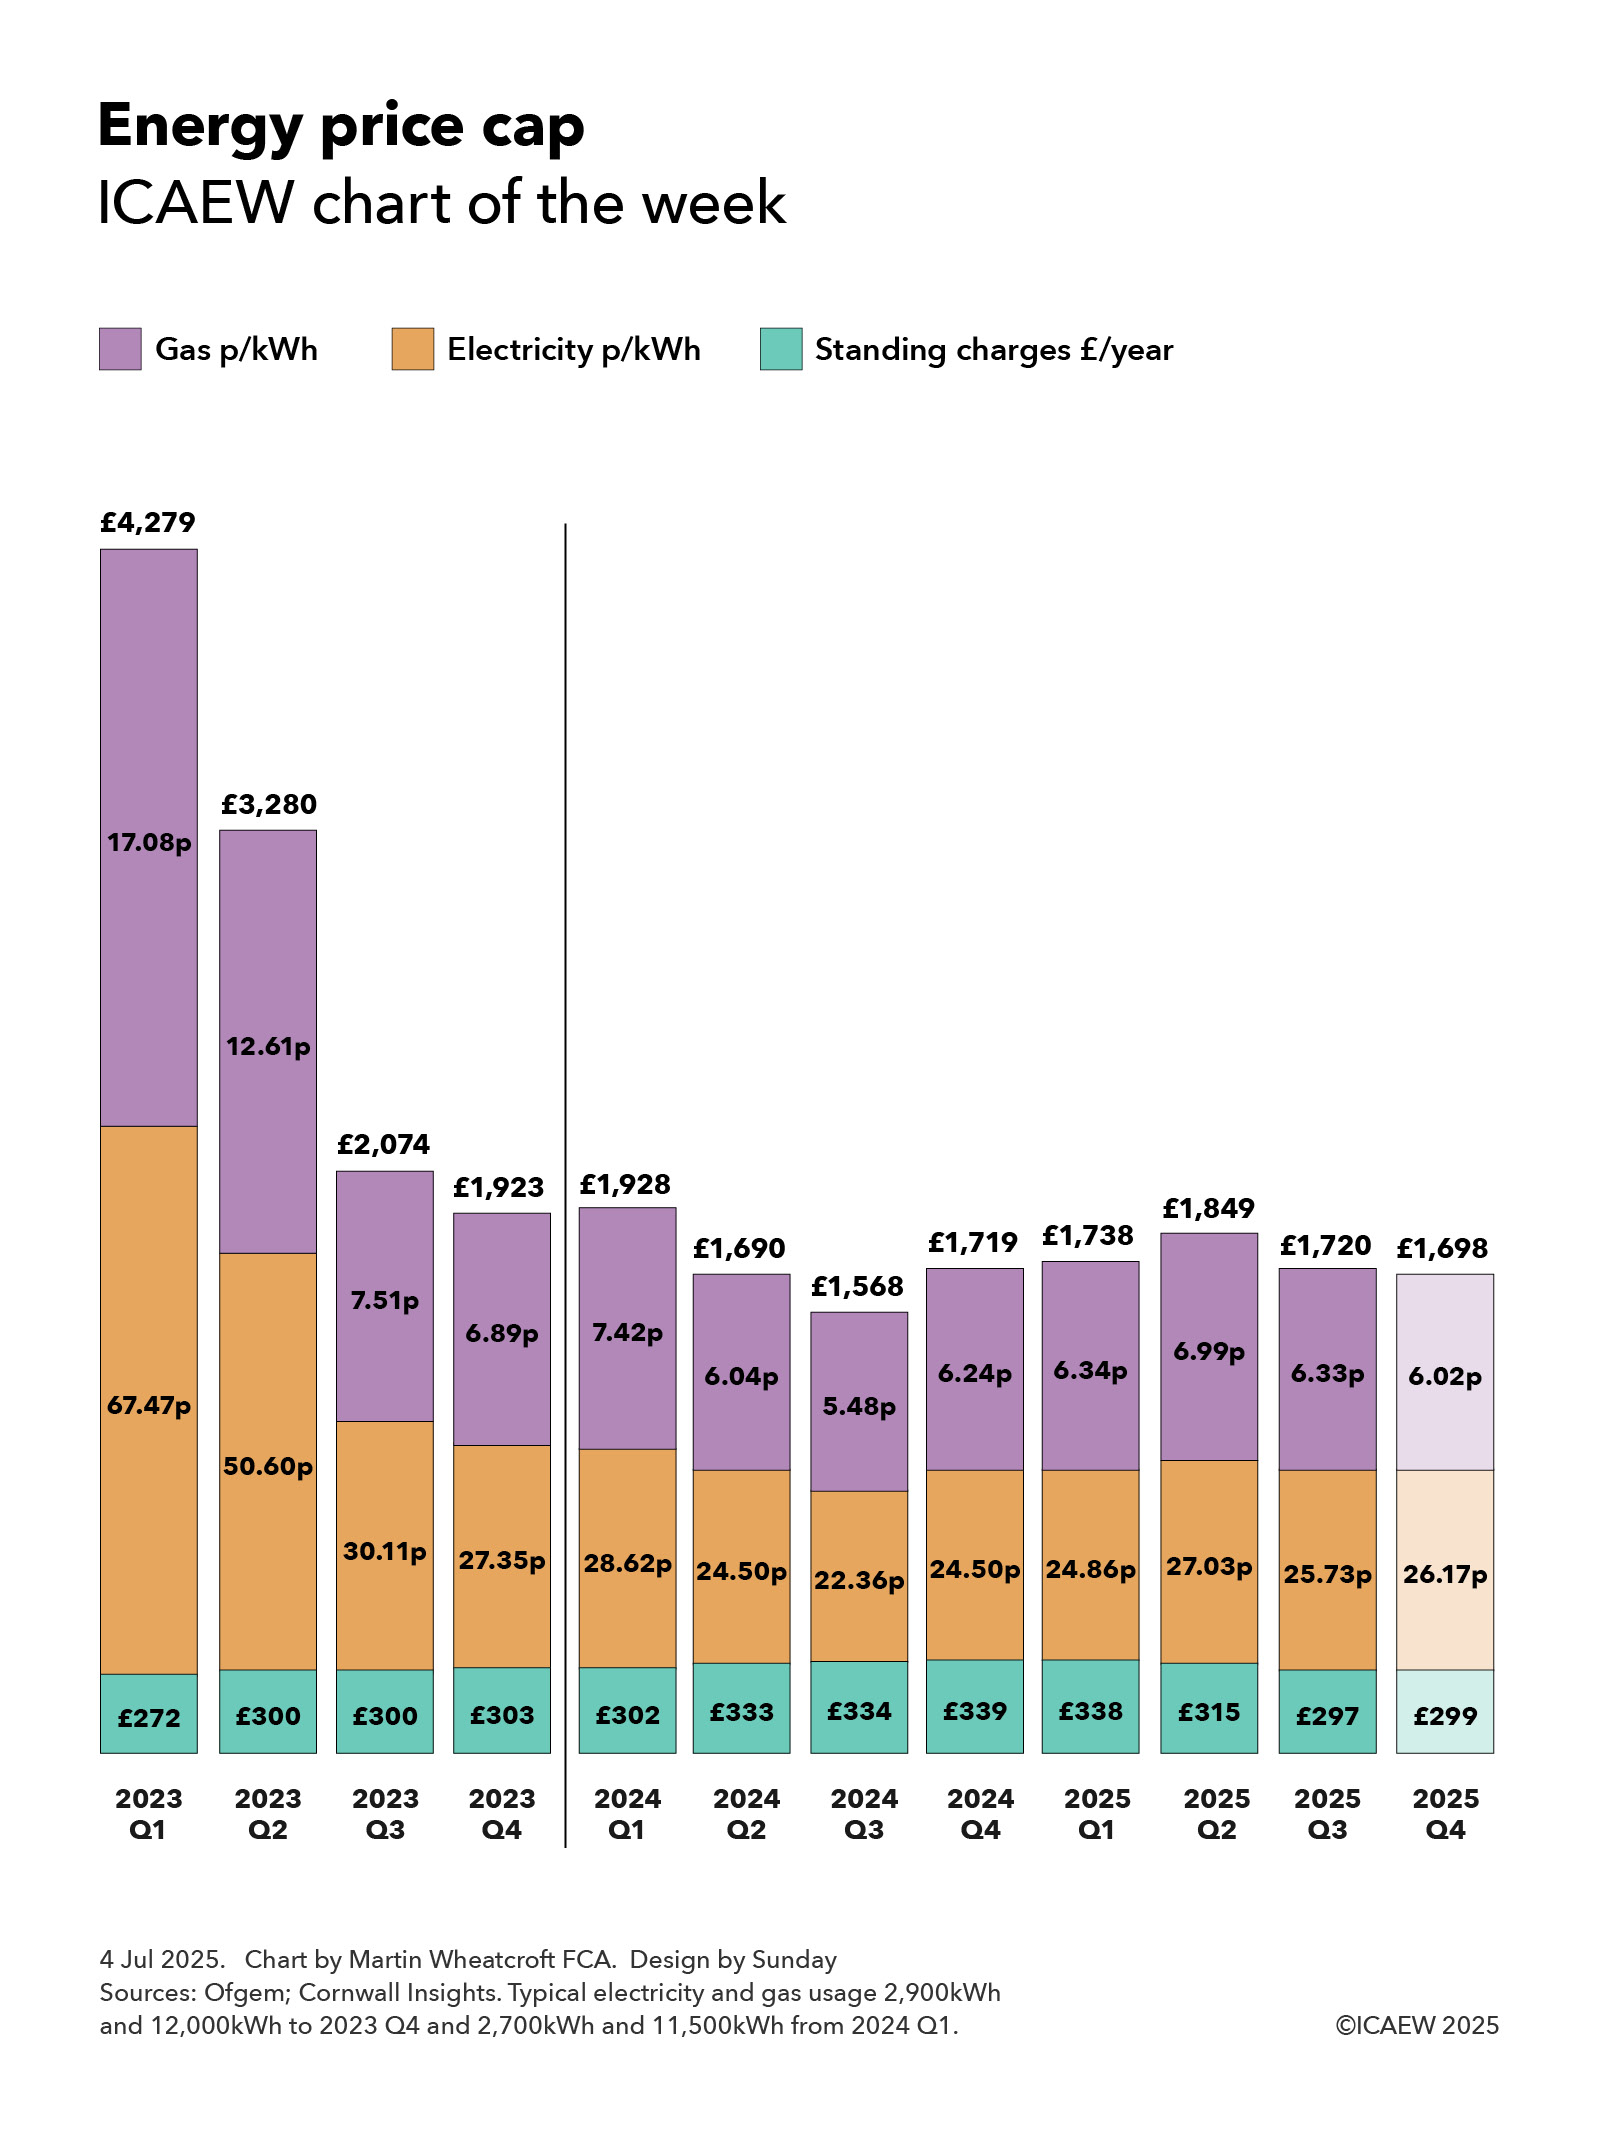
ICAEW chart of the week: Energy price cap update

My weekly chart for ICAEW returns for a less than cheerful update on the energy price cap, highlighting how the massive 54% price rise back in April pales into insignificance in comparison with the recently announced 80% rise in October and the prospect of further big rises in the first half of 2023.

Column chart showing historical price caps for Q4 2020-Q1 2021, Q2-Q3 2021, Q4 2021-Q1 2022, Q2-Q3 2022, the recently announced price cap for Q4 2022, and industry forecasts for Q1, Q2, Q3 and Q4 2023.

Average typical price cap: £1,042, £1,138, £1,277, £1,971, £3,549 (Q4 2022), £5,390, £6,620, £5,590, £5,890.

Gas price/kWh: 3.0p, 3.3p, 4.1p, 7.4p, 14.8p (Q4 2022), 23.2p, 30.8p. 27.9p, £27.8p.

Electricity price/kWh: 17.2p, 19.0p, 20.8p, 28.3p, 51.9pm (Q4 2022), 80.5p, 91.8p, 78.3p, 79.8p.

Standing charge: £184, £188, £186, £265, £273 (Q4 2022), £275, £280, £280, £259.

Sources: Ofgem, Cornwall Insights, ICAEW calculations. Average direct debit prices based on 'typical' annual household usage of 2,900 kWh of electricity and 12,000kWh of gas.

My chart this week is on Ofgem’s cap on domestic electricity and gas prices, which increased from an annual average of £1,042 back in October 2020 for a ‘typical’ household using 2,900kWh of electricity and 12,000kWh of gas paying by direct debit, to £1,138 in April 2021, £1,277 in October 2021 and £1,971 in April this year.

Unless the new prime minister intervenes, the energy price cap will rise to £3,549 on 1 October, significantly more than was anticipated in our chart back in January on this topic . Divided by 12, this gives a monthly average bill of £296 (compared with £164 currently and £106 last winter), although as energy usage in winter is higher for most households the £400 or £66 per month rebate between October 2022 and April 2023 announced by the government earlier this year will not go very far.

The change to quarterly price caps from 2023 onwards means that households face a further rise in January, making the winter even more expensive given that research from Cornwall Insight suggests energy prices will continue to rise, to a likely cap of in the region of £5,390 on 1 January 2023 and potentially to as much as £6,620 on 1 April 2023, before falling to £5,900 on 1 July and £5,890 on 1 October 2023.

The energy price cap is technically a series of regional caps on the price per kilowatt-hour (kWh) for electricity and gas, and on the daily standing charge payable by domestic users. Larger or less energy-efficient households using more electricity or gas will pay a lot more than the amounts shown here, while smaller and more energy-efficient households will pay less. There are higher prices for those using prepayment meters (£3,608 from 1 October) and those paying by cash or cheque (£3,764 from 1 October).

The chart illustrates how the average annual standing charge was £184 in Q4 2020 and Q1 2021, £188 in Q2 and Q3 2021, £186 in Q4 2021 and Q1 2022 and £265 in the current price cap, the large increase principally to cover the costs of dealing with the 40 or so energy suppliers that went bust over the past year. The average standing charge will increase to £273 in October and then is expected to stabilise at around that level, potentially at £275, £280, £280, and £250 respectively for the four quarters in 2023, although this depends on how Ofgem chooses to allocate the costs that make up the cap between fixed and variable elements in the pricing structure.

The average per kWh price for electricity has increased from 17.2p (Oct 2020-Mar 2021) to 19.0p (Apr-Sep 2021) to 20.8p (Oct 2021-Mar 2020) to 28.3p currently and will rise to 51.9p in October. If Cornwall Insight’s predictions come to fruition, the price is likely to rise to somewhere around 80.5p per kWh in January and potentially to 91.8p in April, before falling to 78.3p in July and rising slightly to 79.8p in October 2023. The potential peak of 91.8p is more than five times the level back in October 2020 and is likely to be an even higher multiple for the many households who were on fixed price deals that were often significantly below the level of the price cap.

The average per kWh price for gas has increased from 3.0p (Oct 2020-Mar 2021) to 3.3p (Apr-Sep 2021) to 4.1p (Oct 2021-Mar 2020) to 7.4p currently and will rise to 14.8p in October. The gas price is likely to rise to 23.2p per kWh in January and potentially to 30.8p in April, followed by 27.9p and 27.8p in the final two quarters of 2023. The possible peak of 30.8p would be more than 10 times the level of 3.0p back in October 2020.

The price cap about to come into force of £3,549 is based on annually equivalent wholesale energy costs of £2,491, network costs of £372, operating costs of £214, social and environmental contributions of £152, other costs of £88 and a profit margin of £63, before adding on £169 of VAT at a rate of 5%. These are equivalent to £208, £31, £18, £13, £7, £5, and £14 in a ‘typical’ bill of £296 per month.

The sheer scale of these price rises will make energy unaffordable for millions of families across the UK at the same time as many other prices are rising sharply. This will mean real hardship for those on low and middle incomes without significant additional financial support from government, whether in the form of extra rebates on energy price rises or support through the benefit system. Other options include reforming the pricing mechanism for electricity generated by non-gas sources such as renewables or providing the energy suppliers with a long-term borrowing facility to enable the expected price rises to be spread out over a number of years.

Either way, the incoming prime minister faces some very difficult choices in how to respond, not only to the cost-of-living crisis but also to an emerging cost-of-doing-business crisis that could see many businesses forced to close as their energy prices (not covered by the domestic price cap) become unsustainable.

In January, I said: “There may be trouble ahead.” Unfortunately for all of us, trouble has arrived.

This chart was originally published by ICAEW.

ICAEW chart of the week: energy prices

My chart this week is about domestic energy prices and the Ofgem energy price cap rises expected in April and October 2022.

Chart showing energy price cap based on typical annual usage of 12,000kWH gas and 2,900kWH electricity. £1,042 for Oct 2020 - Mar 2021 (£360 gas at 3.0p/kWh, £498 electricity at 17.2p/Kwh, £184 standing charges), £1,138 for Apr - Sep 2021 (£400 at 3.3p, £550 at 19.0p, £188), £1,277 for Oct 2021 - Mar 2022 (£488 at 4.1p, £603 at 20.8p, £186) and a projected £2,000 for Apr - Sep 2022 (£960 at 8p, £840 at 29p, £200) and £2,350 for Oct 2022 - Mar 2023 (£1,200 gas at 10p, £950 electricity at 33p, £200 standing charges).

The collapse of all but the largest energy suppliers over the past six months or so has pretty much ended a competitive market for domestic energy in the UK. Most consumers are now on tariffs that are at or close to the energy price cap set by the Office for Gas and Electricity Markets (Ofgem).

Originally designed as a safeguard for individuals on standard variable tariffs who couldn’t, didn’t or never got around to entering into competitive fixed-price contracts, the energy price cap is now expected to apply to most households as consumers either roll off existing fixed-price deals or – in many cases – transfer to one of the ‘Big Six’ energy suppliers following the collapse of one of the 40 or so energy firms that have gone bust over the past year.

As a consequence, many consumers will have seen their energy bills increase by much more than that implied by our chart of the week, which shows how the energy price cap has increased from an average dual-fuel bill for direct debit customers of £1,042 a year (about £87 per month) between October 2020 and March 2021 to £1,138 (£95 per month) between April 2021 and September 2021, to the current cap of £1,277 (£106 per month) for the period from last October through to March this year.

These amounts assume ‘typical’ usage for a dual-fuel household paying by direct debit of 2,900kWh of electricity and 12,000kWh (410 therms or 41 million British thermal units) of gas, with consumers using prepayment meters or on credit paying higher prices – currently an average of £1,309 (£109 a month) and £1,370 (£114 a month) respectively. Those who use more or less will pay higher or lower amounts accordingly, while the price cap varies by region.

As the chart illustrates, the direct debit price cap during the six months ended 31 March 2020 of £1,042 per year comprised £184 for the standing charge, £498 for 2,900kWh of electricity at 17.2p per kWh and £360 for 12,000kWh of gas at 3p per kWh. This increased to £1,138 per year in the six months to 30 September 2021, comprising £188 for the standing charge, £550 for 2,900kWh of electricity at 19p per kWh and £400 for 12,000kWh of gas at 3.3p per kWh. The current price cap of £1,277 per year, which lasts until 31 March 2022, comprises £186 for the standing charge, £603 for 2,900kWh of electricity at 20.8p per kWh and £488 for 12,000kWh of gas at 4.1p per kWh.

The current price cap is based on annual wholesale energy costs of £528, network costs of £268, operating costs of £204, social and environmental contributions of £159, other costs of £34 and a profit margin of £23 before adding on £61 of VAT at a rate of 5%. These are equivalent to £44, £22, £17, £13, £3, £2 and £5 in an average bill of £106 per month, although in practice energy usage varies across the course of a year.

Recent industry forecasts and speculation from EnAppSys, Investec and Cornwall Insight, among others, suggest that the price cap is likely to increase by more than 50% to somewhere in the region of £2,000 a year (£167 per month) for the six-month period from 1 April and potentially to around £2,350 a year (£196 per month) for the six months from 1 October 2022. Publicly available forecasts do not provide a breakdown on what that means for per kWh prices and so the chart provides illustrative calculations based on gas prices doubling to around 8p per kWh in April and rising to 10p in October and electricity prices increasing by in the order of 40% to 29p in April and then further to 33p per kWh in October. Actual prices will depend on how Ofgem allocates costs between the fixed and variable parts of the bill, as well as how wholesale prices move before they are included in the final calculation. The cost of energy for prepayment meter and credit customers will be even higher.

The scale of these increases is likely to have a significant impact on poorer and middle-income households, with commentators suggesting that the government is likely to want to intervene in some way to cushion the blow. Some have argued for cutting VAT from 5% to zero, although the Institute for Fiscal Studies, the Resolution Foundation and HM Treasury have all noted that doing so would pass much of the benefit on to higher income households rather than helping those most affected. Others have argued for spreading higher wholesale prices over longer periods to reduce the hit to family budgets, while there are also calls for the taxpayer to provide temporary subsidies in order to keep bills down, potentially transferring some of the risk of higher wholesale costs on to the taxpayer.

Policymakers are unlikely to do nothing as – even if there was additional support provided to the very poorest through the welfare system – the anticipated prices are large enough to disturb household budgets for many middle-income families as well. This could have serious implications for the economy and for public finances, with a substantial proportion of households likely to cut back on spending in other areas just as the government is hoping for a post-pandemic bounce to drive economic growth. The government will also be acutely aware that energy prices are a key component of inflation indices, with the consumer prices index 5.4% higher in December than a year earlier, according to the Office for National Statistics, and expected to rise even further once the new price cap comes into force in April.

There may be trouble ahead.

This chart was originally published by ICAEW.

ICAEW chart of the week: UK electricity projections

6 November 2020: Renewables, imports and nuclear are expected to provide around 85% of UK electricity generation by 2040, but will that be good enough to achieve carbon neutrality a decade later in 2050?

UK electricity projections chart (reference scenario):
Nuclear: 48 TWh in 2008, 62 TWh in 2020, 86 TWh in 2040.
Imports: 11 TWh, 28 TWh, 74 TWh.
Renewables: 23 TWh, 125 TWh, 188 TWh.
Carbon: 297 TWh, 109 TWh, 58 TWh in 2040.

The latest official energy and emissions projections, released by the Department for Business, Energy & Industrial Strategy (BEIS) on 30 October 2020, now extend out to 2040 – a decade before the 2050 target set by the UK Government to reach net zero.

The #icaewchartoftheweek takes a look at the progress being made on decarbonising electricity generation, with renewables, nuclear and imported electricity (much of which comes from nuclear or renewable sources) expected to increase from around 20% in 2008 to 66% this year and to just over 85% in 2040.

Overall electricity demand is expected to fall over the first half of the coming decade as improved energy efficiency and energy conservation measures (such as better insulation) continue to offset more demand from a growing population and economy (caveats apply). Lower demand in the residential and services sectors are then expected to be outweighed by higher demand for industrial and transport, particularly the latter as electric vehicles take to the roads.

Coal has now been almost entirely eliminated from electricity generation, falling from 118 TWh in 2008 (when there was also 6 TWh from oil and 173 TWh from natural gas) to 2 TWh projected in 2020 alongside 107 TWh from natural gas. Even so, coal may remain a small part of the mix even in 2040 as part of a projected 5 TWh of electricity from carbon capture and storage (CCS) plants. This should leave just 53 TWh from low (but still not no) carbon natural gas generation to eliminate over the subsequent decade.

Unfortunately, electricity is only part of the energy picture, with the reference scenario calculated by BEIS projecting that carbon sources will provide 980 TWh of final energy consumption in 2040 outside of electricity supply and direct power from renewables. This includes the equivalent of around 370 TWh from natural gas used domestically, 250 TWh from diesel and petrol used in transport, and 160 TWh from aviation fuels.

So while there continues to be welcome progress in greening the electricity supply, achieving net zero overall is not going to be as easy.

This chart was originally published on the ICAEW website.

ICAEW chart of the week: UK electricity usage

24 April 2020: A dramatic decline in electricity usage confirms the scale of the economic downturn and the impact that will have on tax receipts.

Chart showing 7-day moving average electricity usage between 1 Feb and Apr 22 falling below the 5-year average.

The coronavirus pandemic is having a huge impact on all of us, including in our usage of electricity as illustrated by the #icaewchartofthemonth.

For example, the seven-day moving average electricity generated as of 21 April 2020 was 531 GWh, 23% lower than the 690 GWh supplied on average in the previous five years. This is a dramatic fall, reflecting the closure of much of our high streets, most offices and many factories across the country.

Admittedly, some of the decline will be down to weather, with April in particular being much warmer than usual. However, the collapse in demand since the Great Lockdown began is dramatic, demonstrating just how much has changed in just a few weeks.

A silver lining to the current situation is a significant reduction in carbon emissions, with zero electricity generated from coal or oil power plants in recent weeks. Gas-fired power stations are currently providing only around 20% of UK energy supply, with wind, solar and hydropower together providing in the order of 50% each day. Nuclear provides a further fifth, with the balance coming from biomass (around 5% or so) and imports from France, Belgium and Netherlands (a further 5%, much of which is either from nuclear power plants or from renewable sources in any case). This is very positive news for the environment, even if a bit of a headache for the National Grid electricity system operator in managing a very different mix of generation than normal.

Unfortunately, we will have to wait quite a while to see how this translates into economic statistics, with the OBR amongst others suggesting that the economy could contract by as much as 35% in the second quarter of 2020. This will have major implications for tax receipts and government borrowing, which are rapidly moving in opposite directions.

This chart was originally published by ICAEW.