ICAEW chart of the week: BBC finances

22 January 2020: The BBC’s finances are in the spotlight for this week’s chart, as it struggles to generate the income it needs to fund its public service broadcasting mission.

National Audit Office report out this week on the BBC’s strategic financial management highlights the financial pressures facing the BBC as it seeks to deliver on its universal public service broadcasting obligation in the face of a rapidly changing media landscape.

The #icaewchartoftheweek illustrates how the BBC generated revenue of £4.9bn in the year ended 31 March 2020. This is less than the £9bn or so generated by Sky in the UK & Ireland each year, but more than ITV’s £3bn or Channel 4’s £1bn. 

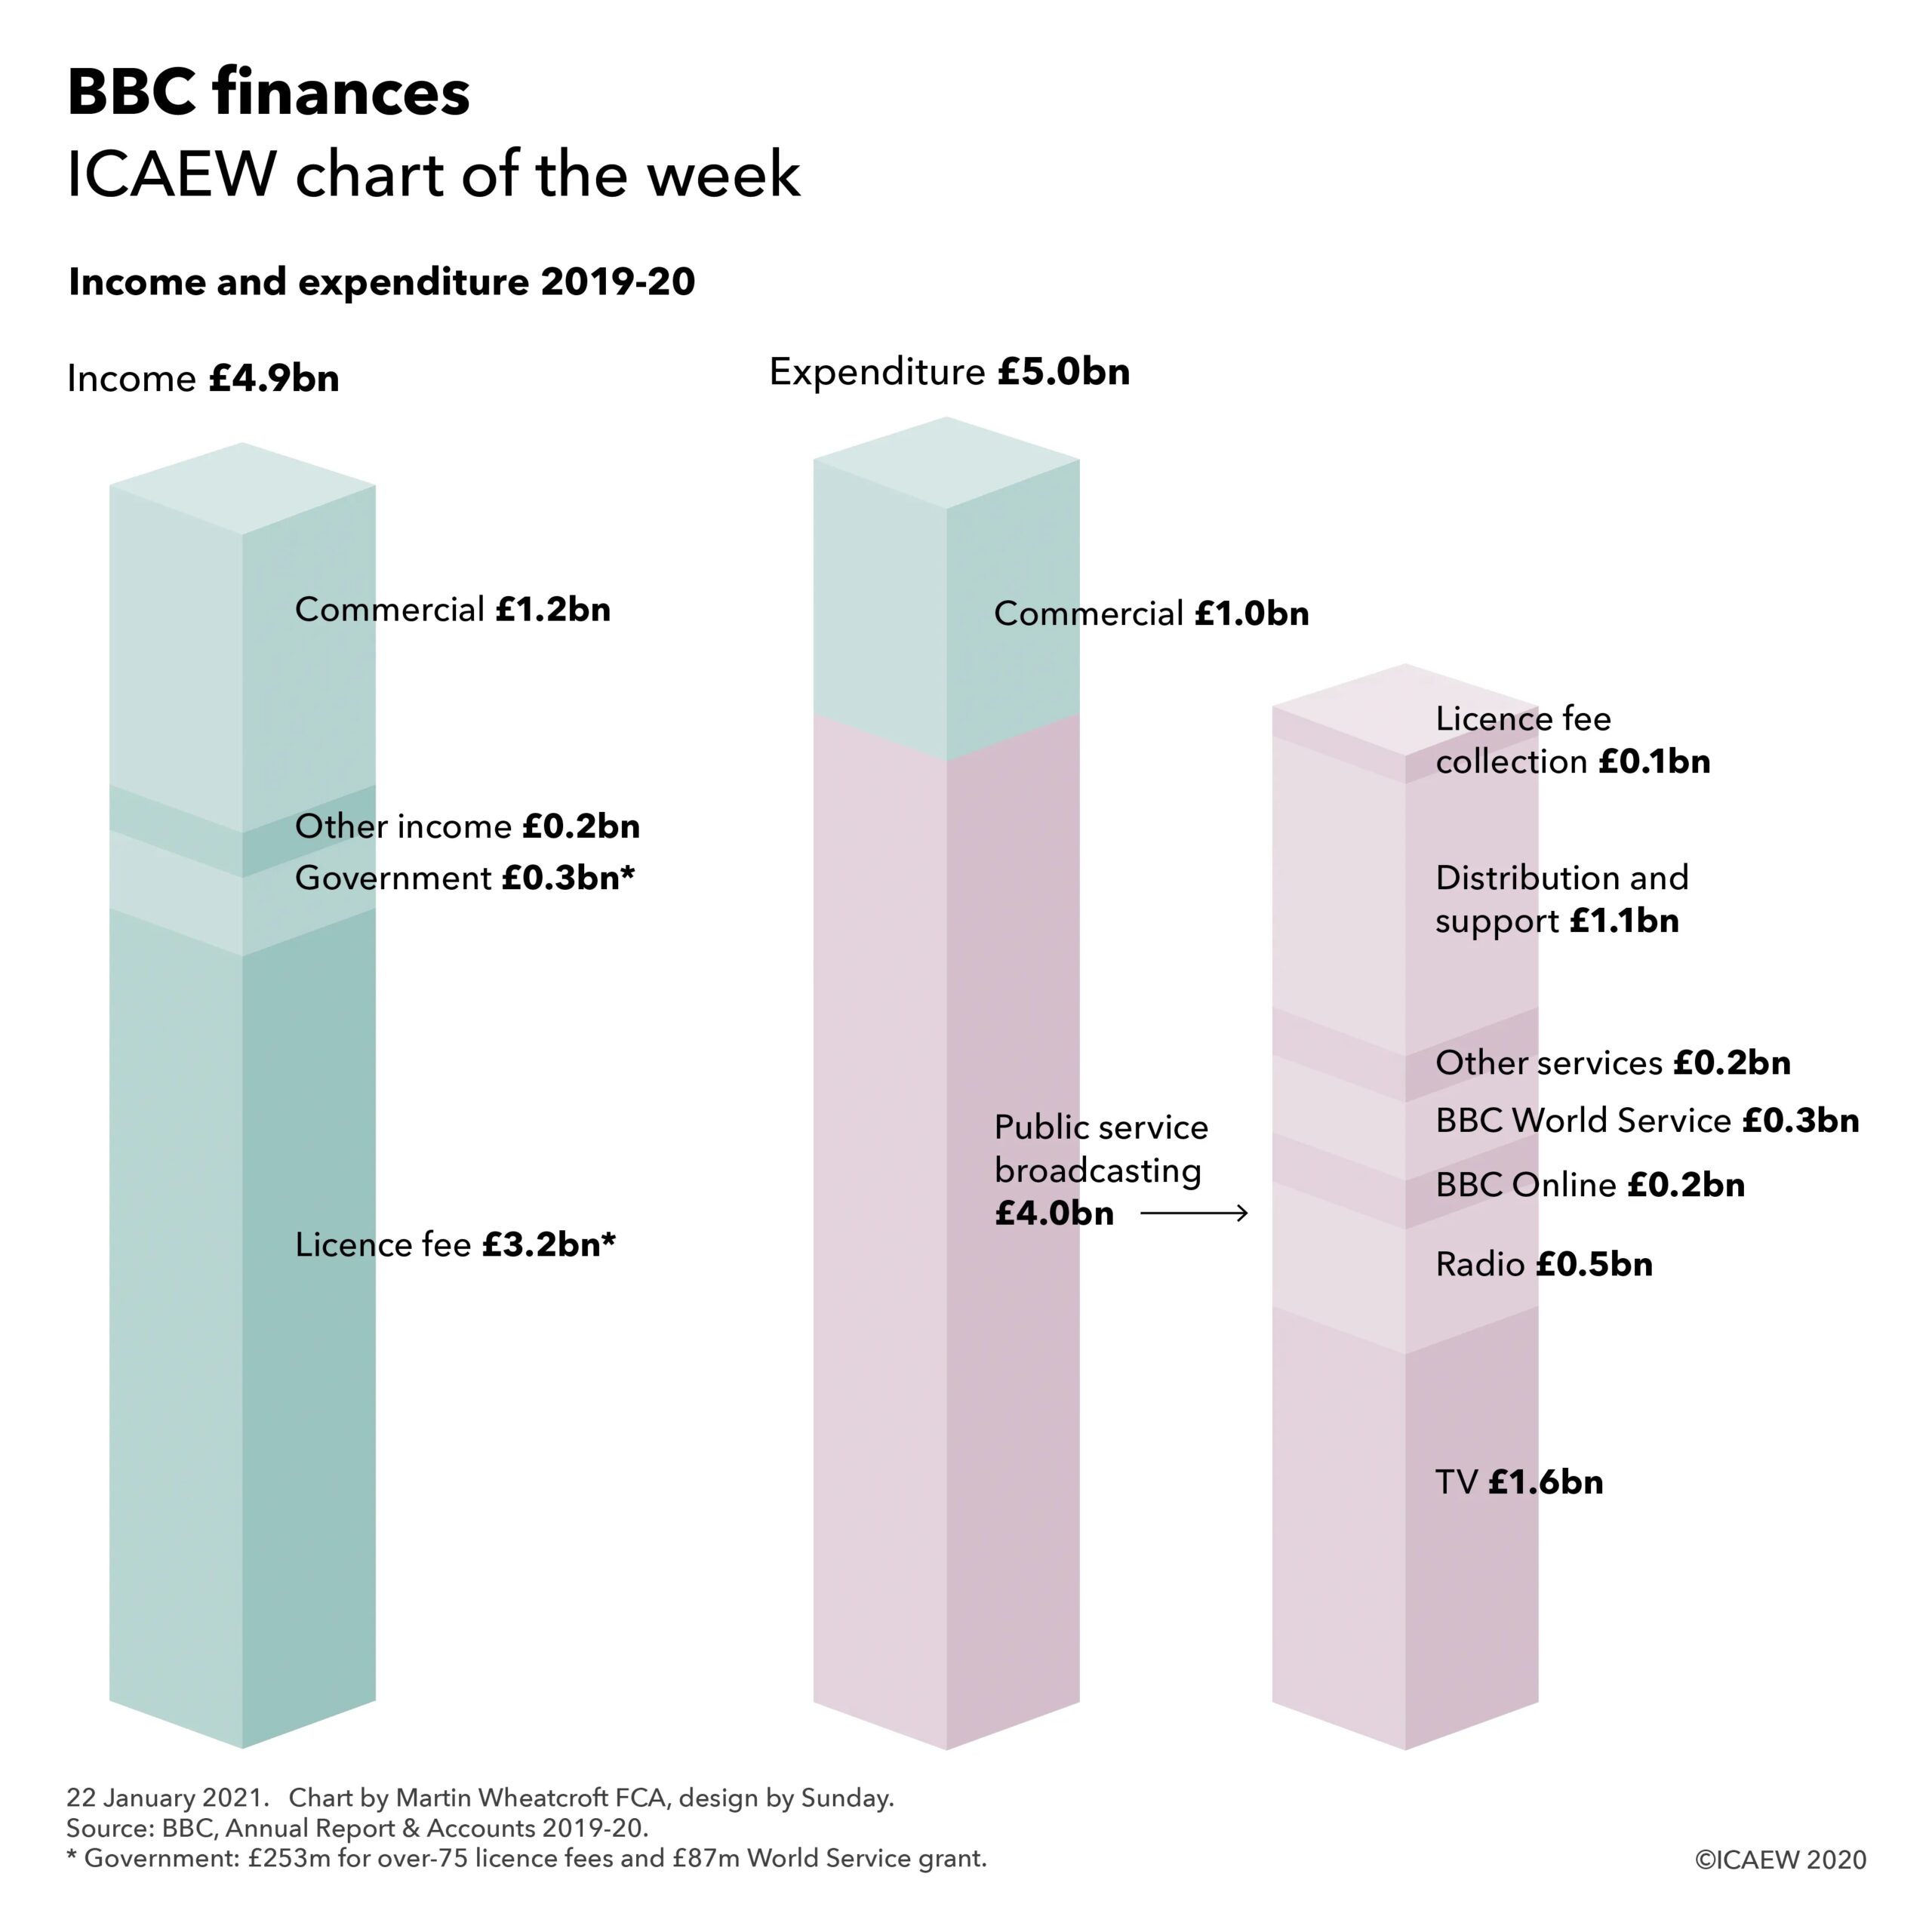
The principal source of income is the TV licence fee, which generated £3.2bn in 2019-20 from 21.2m households. This excludes 4.5m households that received free licences, with the government providing £253m to cover this in addition to an £87m grant for the World Service. Other income generated by the public service broadcasting arm amounted to £0.2bn, while BBC Studios and other commercial activities had external revenues of £1.2bn.

Expenditure of £5.0bn included £4.0bn incurred on public service broadcasting, paying for eight TV channels and 60 radio stations in the UK, radio services around the world in more than 40 languages and extensive online services – most notably BBC iPlayer. 

The BBC’s domestic TV and radio channels cost £1,609m and £494m respectively, while £238m was spent on BBC Online and £315m on the BBC World Service, of which £228m was funded from the licence fee. £204m was incurred on other services (including a contribution to S4C), while distribution, support and other costs incurred amounted to £1,070m, excluding £119m of licence fee collection costs.

A colour TV licence in 2019-20 cost £154.50, equivalent to £12.88 per month and the BBC estimates that £6.83, £2.22, £1.24 and £1.24 of each licence fee went on TV, radio, BBC Online and the World Service respectively, while £1.35 paid for other services, distribution and support, licence fee collection and other costs.

Commercial activities contributed £176m to the bottom line, providing a small subsidy to licence fee payers, with attempts by the BBC to start a global subscription service for British TV content in partnership with ITV (Britbox) yet to bear much fruit. The principal commercial revenue stream remains sales by BBC Studios to broadcasters around the world, together with advertising from the seven UKTV channels now wholly owned by BBC Studios and declining amounts from DVD sales. 

At the bottom line, the BBC incurred a loss of £119m in 2019-20, following on from a loss of £69m in the previous year and a profit of £180m in 2017-18. An improved contribution from commercial activities was not enough to offset the cut in the government funding for free TV licences for over-75s, which fell from £656m in 2017-18 to £253m in 2019-20. This funding has now ceased and from 1 August 2020 the BBC reintroduced licence fees for around three million over-75s households, retaining free licences for 1.5m or so over-75s households receiving pension credit (a welfare benefit for pensioners on low incomes).

There is a lot of debate both inside and outside the BBC about the future of the licence fee model and whether it can survive in a landscape of global streaming services. As it approaches its 100th anniversary in October 2022, the BBC will be hoping it can find a way to extend its public service broadcasting mission for a second century.

This chart was originally published by ICAEW.

NAO says £190bn Defence Equipment Plan 2020-30 is unaffordable

21 January 2021: The National Audit Office (NAO) says additional funding provided in the November 2020 Spending Review will still not be enough to plug shortfalls in the 10-year Defence Equipment Plan.

The NAO has issued a report on the £190bn Defence Equipment Plan for the 10 years from 2020 to 2030. For the fourth consecutive year, the NAO reports that the plan by the Ministry of Defence (MoD or the Department) to procure and support defence equipment is unaffordable.

The Equipment Plan is a rolling 10-year set of programmes that currently comprises £87bn in planned procurement, £97bn in support costs and £6bn for contingencies, with the total of £190bn representing a £9bn increase over the previous year’s plan. Excluding contingencies, the plan includes £44bn for the Defence Nuclear Organisation, £35bn for Air Command, £33bn for Army Command, £31bn for Navy Command, £29bn for Strategic Command and £12bn for Strategic Programmes.

The MoD’s forecast assessment is that the 2020-30 plan will cost £214bn if delivered as expected, with £17bn in adjustments and planned savings to bring that down to £197bn, some £7bn more than the allocated budget. The NAO also notes that the Equipment Plan is fully allocated to existing and planned programmes, with no headroom for potential new projects that may be identified over the next few years, although there may be £9bn potentially available from other parts of the MoD’s budget between 2025-26 and 2029-30. 

The primary finding of the report is that not only is there an identified budgetary shortfall of £7bn, but there are potential cost pressures of at least £20bn that put delivery of the plan at significant risk. This includes significant uncertainty as to whether planned efficiency savings can be achieved as well as concerns about escalating costs on major procurement programmes and the impact of fluctuating exchange rates on long-term forward purchases.

The NAO states in the report that the Department “has still not established a reliable basis to assess the affordability of equipment projects and its estimate of the funding shortfall in the 2020–30 plan is likely to understate the growing financial pressures that it faces. The plan does not include the full costs of the capabilities that the Department is developing, it continues to make over-optimistic or inconsistent adjustments to reduce cost forecasts and is likely to have underestimated the risks across long-term equipment projects. 

In addition, the Department has not resolved weaknesses in its quality assurance of the plan’s affordability assessment. While the Department has made some improvements to its approach and the presentation of the plan over the years, it has not fully addressed the inconsistencies which undermine the reliability and comparability of its assessment.”

Additional funding of £16.5bn over four years announced in the Spending Review in November 2020 should, in theory, plug the gap. However, the MoD has indicated it intends to use a substantial proportion of this new money to invest in improving military capabilities, with investments in cyber warfare and drones at the top of the list. This likely means the Equipment Plan remains under significant pressure, with several major new procurements expected to be added this year, many of which will involve untested new technologies with their own set of risks.

This will require some tough decisions to be made as part of the Integrated Review expected to be published shortly. There are rumours this may see cuts in the size of the Army to free up resources for other priorities, with MoD officials informing the Defence Select Committee they were actively looking to “disinvest” from a number of existing capabilities they considered would not be needed in the future.

The NAO concludes, “The Department faces the fundamental problem that its ambition has far exceeded available resources. As a result, its short-term approach to financial management has led to increasing cost pressures, which have restricted top-level budget holders from developing military capabilities in a way that will deliver value for money. The growing financial pressures have also created perverse incentives to include unrealistic savings and to not invest in new equipment to address capability risks.

The recent government announcement of additional defence funding, together with the forthcoming Integrated Review, provide opportunities for the Department to set out its priorities and develop a more balanced investment programme. The Department now needs to break the cycle of short-termism that has characterised its management of equipment expenditure and apply sound financial management principles to its assessment and management of the Equipment Plan.”

Martin Wheatcroft, adviser to ICAEW on public finances, commented, “The Ministry of Defence has made significant strides over the last decade to improve how it procures and supports defence equipment, but there remain significant weaknesses in financial management that need to be addressed. It is concerning that issues highlighted in four successive NAO reports are still not resolved.

However, even the strongest financial management at the MoD would struggle to deliver on the UK’s current ambition to be a global military power on a limited budget. Managing complex procurement programmes effectively will continue to be extremely challenging without a major change in strategy – either to scale back the UK’s defence capabilities to a more modest level or to allocate a much larger share of public spending to defence.”

This article was originally published by ICAEW.

Crown Consultancy gains traction as UK government spending soars

19 January 2021: Plans for an in-house government consultancy sound sensible, but will insourcing really deliver value for money for taxpayers?

The UK government spends hundreds of millions of pounds on consultants each year for services ranging from strategic advice to service delivery. While ministers and senior civil servants often comment they feel too much is spent on consultants, there continues to be a stream of new contracts awarded to the major professional service firms and consultancy practices.

This is a particularly high-profile issue in the context of the huge amounts of pandemic-related contracts awarded over the course of the last year.

Recent examples include bringing in procurement specialists and forensic accountants to sort out the audit trail for panic purchases of personal protective equipment or using a range of IT consultants to help rapidly design and build new border and customs systems following the UK’s exit from the EU Customs Union and Single Market.

In practice, there are many reasons why a government department – or any organisation for that matter – might want to engage external consultants. They can provide expertise not available in-house, as well as providing a flexible resource that can be mobilised quickly to achieve critical objectives. After more than a decade of tightening budgets in the public sector, it is unsurprising there is a limit to how many of the existing team can be diverted from day-to-day activities in order to (say) implement a major new IT system, transform the organisation or respond to a global crisis such as a pandemic.

Partly that is sensible human resource management. It does not make sense to employ hundreds, if not thousands, of staff across the civil service ‘just in case’ their expertise might be needed on a future project. At the same time, it also makes sense to bring in experience gained elsewhere from experts who know what works and what doesn’t.

Using external service providers also enables resources to be mobilised quickly and at scale. Again, a capability most organisations will not have – or normally need to have – internally. There are also other benefits, such as the ability to change team members at will, charge contractual penalties for non-performance or the ability to sue over poor service or bad advice: options generally not available when employing in-house teams.

However, those benefits come at a cost. Not only are salaries for consultants generally higher than those of staff in the public sector, but there is a premium on top to cover technical resources, overheads, insurance and margin that together mean than the per-hour rate can be a significant multiple of the cost of in-house staff, even when the civil services’ own overheads are factored in. 

Justifying this premium can be difficult, particularly in major projects involving very large teams of consultants. Another perceived issue can be where individual consultants are former civil servants apparently being re-employed at a much greater cost, even if that comes with technical and other resources not available when they were on the payroll.

recent report by the Public Accounts Committee argues that the extensive use of consultants is driven by an underlying lack of skills in the civil service, with the development of fourteen cross-government functions (such as the Project Delivery Service and the Government Finance Function) not having had the desired effect of strengthening internal capabilities sufficiently to reduce the need to bring in external consultancy support.

One solution that has often been mooted (and is now being considered more actively) is to establish an in-house consultancy organisation. This would have the scale to be able to employ technical experts and experienced consultants to help deliver priorities across the whole of government, both centrally and locally.

Of course, this is not a new phenomenon and there are a range of consultancy services already in existence inside the government. Examples include the Government Legal Department (originally the Treasury Solicitor’s Department, founded in 1876), the Government Actuary’s Department (founded in 1919) and the consultancy arm of the Government Property Agency (founded 2018). These all provide expert advice and support that government departments and agencies can utilise as needed, with any profit that might be generated coming back to the exchequer to be reinvested in public services.

The proposals for a Crown Consultancy ‘firm’ within government would be different both in terms of scale and also in the range of activities it would cover. Such an organisation would have many benefits in being able to utilise existing expertise within the civil service more effectively, while also bringing in private sector expertise and experience to bear on difficult challenges. There would also be opportunities to provide a wider range and depth of experience for civil servants with secondments as part of their development, providing career opportunities not currently available, particularly in technical specialities.

There are a number of hurdles to be overcome in establishing a Crown Consultancy. One of the more significant will be how to address pay disparities that may make it difficult to recruit individuals with the skills and experience required. Another will be in replicating the tools, techniques and resources that private sector firms have spent decades creating and that enable them to mobilise quickly to meet client needs.

Plans remain at an early stage, but of course, there are a number of external consultants available that can help move them forward!

This article was originally published by ICAEW.

A difficult winter ahead for the public finances

23 December 2020: The UK public sector incurred a £31.6bn deficit in November, bringing the total shortfall over eight months to £240.9bn. Debt reached an all-time high of £2.1tn.

Commenting on the latest public sector finances for November 2020, published on Tuesday 22 December 2020 by the Office for National Statistics (ONS), Alison Ring sector director at ICAEW, said: 

“A slightly more optimistic forecast for GDP from the Office for Budget Responsibility last month resulted in the UK’s debt to GDP ratio being revised downwards, despite public sector debt having reached an all-time high of £2.1tn in November. However, this optimism may prove to have been premature, with reports suggesting another national lockdown in the new year and disruption in international trade foretelling a potentially difficult winter ahead for the economy and the public finances. 

Prospects for the spring will depend on how quickly the vaccine can be rolled out, whether testing and tracing can deliver rapid and reliable results, and the extent to which disruption at borders now and after 1 January can be minimised.”

Public sector finances for November

The latest public sector finances reported a deficit of £31.6bn in November 2020, a cumulative total of £240.9bn for the first eight months of the financial year. This is £188.6bn more than the £52.3bn recorded for the same period last year.

Falls in VAT, corporation tax and income tax drove lower receipts, while large-scale fiscal interventions resulted in much higher levels of expenditure. Net investment is greater than last year, as planned, while the interest line has benefited from ultra-low interest rates.

Public sector net debt increased to £2,099.8bn or 99.5% of GDP, an increase of £301.6bn from the start of the financial year and £303.0bn higher than in November 2019. This reflects £60.7bn of additional borrowing over and above the deficit, most of which has been used to fund coronavirus loans to business and tax deferral measures.

Table of results for the month of November and for the 8 months then ended, together with variances against the prior year. Click on the link at end of post to visit the original ICAEW article for a readable version.

The combination of receipts down 8%, expenditure up 29% and net investment up 26% has resulted in a deficit for the eight months to November 2020 that is over four times the budgeted deficit of £55bn for the whole of the 2020-21 financial year set in the Spring Budget in March, despite interest charges being lower by 26%. The cumulative deficit is approaching five times as much as for the same eight-month period last year.

Cash funding (the ‘public sector net cash requirement’) for the month was £20.7bn, bringing the cumulative total this financial year to £295.8bn, compared with £14.9bn for the same eight-month period in 2019. 

Interest costs have fallen despite much higher levels of debt, with extremely low interest rates benefiting both new borrowing to fund government cash requirements and borrowing to refinance existing debts as they have been repaid.

The deficit remains on track to approach the £393.5bn forecast for the financial year to March 2021 by the Office for Budget Responsibility in the Spending Review once bad debts not yet recognised on coronavirus loans are included.

Upwards revisions to GDP based on the latest Office for Budget Responsibility forecasts have reduced the debt to GDP ratio for this and previous months to below 100% of GDP. However, the likelihood of a further national lockdown in the new year and for disruption in international trade with the end of the EU transition period could depress prospects for GDP growth in 2021.

Table of results each of the 8 months to November 2020. Click on the link at end of post to visit the original ICAEW article for a readable version.
Table of results each of the 8 months to November 2019 and of the 12 months ended 31 March 2020. Click on the link at end of post to visit the original ICAEW article for a readable version

Caution is needed with respect to the numbers published by the ONS, which are expected to be repeatedly revised as estimates are refined and gaps in the underlying data are filled.

The ONS made a number of revisions to prior month and prior year fiscal numbers to reflect revisions to estimates and changes in methodology. These had the effect of reducing the reported fiscal deficit in the first seven months from the £214.9bn reported last time to £209.3bn and increasing the reported deficit for 2019-20 from £56.1bn to £57.4bn.

This article was originally published by ICAEW.

ICAEW chart of the week: 40 years of technology

18 December 2020: Our last chart this year takes a look at how technology has advanced over the last forty years, using the number of transistors in central processing unit microprocessors as a proxy for technological advancement.

Transistors on chips: 2020 Apple M1 16bn, 2010 Intel Xeon 2.3bn, 2000 Intel Pentium IV 42m, 1990 Motorola 68040 1.2m and 1980 Motorola 68000 68,000.

As we look back over the course of a difficult year, the contribution of technology to keeping the economy working has become apparent. Working from home instead of the office, joining video calls instead of in-person meetings and collaborating using online tools have made it possible for most businesses to continue to operate, albeit perhaps not quite as normal. Similarly, consumers have been able to turn to online retail, streaming services and cashless technology to cope with closed stores and shuttered entertainment venues during lockdowns and tiered restrictions.

This has only been possible as a consequence of huge advancements in technology over the past forty years, with the arrival of affordable personal computers in the 1980s, mobile phones in the 1990s, practical laptops and broadband connections in the 2000s, and smartphones and tablets in the 2010s.

We have used the number of transistors in central processing unit (CPU) microprocessors as a proxy for technological advancement in the #icaewchartoftheweek, but of course there have been many other advancements that have been just as significant, from processing capabilities, memory size, data storage, video quality and broadband speeds.

Back in 1980, the Motorola 68000 chip with 68,000 transistors was the leading chip. It was originally used in high-end business computers before lower production costs enabled it to be included in the original Apple Macintosh launched in 1984. That first Macintosh had separate chips to provide 64K of read-only-memory (ROM), 128k of random-access memory (RAM), a built-in 400KB floppy disk drive and 512 x 342 monochrome display.

A decade later, Intel had caught up with Motorola in chip design, with the Intel 80486 containing 1,180,235 transistors, matching Motorola’s 68040 chip that contained approximately 1.2 million transistors. The Intel 80486 was used in many IBM-compatible PCs while the Motorola 68040 was used in the Commodore Amiga 4000 and HP Series 400 desktops.

Intel was the leading chip-maker in 2000 with the Pentium series of microprocessors being the core of many PCs, albeit against strong competition from AMD’s Athlon x86 compatible CPUs. The Pentium 4 had 42 million transistors, while by 2010, Intel had taken over from Motorola in Apple’s range of computers, although its Xeon series of chips (with 2.3 million transistors in 2010) was primarily used in high-end workstations and servers rather than in desktops or laptops.

In 2020, Apple has started to replace Intel in its computers with the launch of its ARM-based M1 chip. This has 16 billion transistors, more than 235,000 times as many as there were in the leading edge Motorola 68000 of 40 years ago. Processing power and capability is expected to continue to expand: for example, we didn’t have enough room on the chart to fit in AMD’s Epyc Rome microprocessor with 39.5billion transistors on a single chip.

The recently launched M1-based edition of the Apple MacBook Air has a specification that would unimaginable to the personal computer owner of four decades past, with a base configuration containing 8Gb of memory (62,500 times as much RAM as the original Macintosh desktop), 256 GB of storage (640,000 times) and a 2560 x 1600 colour display. 

Our ability to cope with the pandemic would have been much harder even a mere decade ago when smartphones were only just emerging, let alone if we had been back in the world of dial-up modems and fax machines of 40 years ago. This demonstrates just how much technology has improved our ability to deal with a global crisis such as the coronavirus pandemic.

The #icaewchartoftheweek is taking a break for a couple of weeks in order to enjoy socially-distanced Christmas and New Year celebrations and will be returning on 8 January 2021. After such a difficult year, we hope you will be able to take some time off to recharge and return to your home-office (and eventually your actual office) energised for what we hope will be a much improved 2021!

This chart was originally published by ICAEW.

ICAEW chart of the week: Government bond yields

11 December 2020: Ultra-low or negative yields provide governments with an opportunity to borrow extremely cheaply, but what will happen if and when interest rates rise?

Government 10-year bond yields

Germany -0.61%, Switzerland -0.59%, Netherlands -0.53%, France -0.36%, Portugal -0.02%, Japan +0.01%, Spain +0.02%, UK +0.26%, Italy +0.58%, Greece +0.60%, Canada +0.76%, New Zealand +0.91%, USA +0.95%, Australia +1.02%

On 9 December, the benchmark ten-year government bond yield for major western economies ranged from -0.61% for investors in German Bunds through to 0.95% for US Treasury Bonds and 1.02% for Australia Government Bonds, as illustrated in the #icaewchartoftheweek.

One of the more astonishing developments of the last decade or so has been the arrival of an era of ultra-low or negative interest rates, even as governments have borrowed massive sums of money to finance their activities. This is not only a consequence of weak economic conditions and the slowing of productivity-led growth, but it has also been driven by the monetary policy actions of central banks through quantitative easing operations that have driven down yields by buying long-term fixed interest rate government bonds in exchange for short-term variable rate central bank deposits.

For bond investors this has been a wild ride, with the value of existing bonds sky-rocketing as central banks have come calling to buy a proportion of their holdings, crystallising their gains. The downside is the extremely low yields available to debt investors on fresh purchases of government bonds, which in some cases involve paying governments for the privilege of doing so.

Yields vary according to maturity, with yields on UK gilts ranging from -0.08% on two-year gilts through to 0.26% for 10-year gilts (as shown in the chart) up to 0.81% on 30-year gilts. In practice, the UK issues debt with an average maturity between 15 and 20 years, so the current average cost of its financing is higher than that shown in the chart at between 0.48% and 0.77% being the yields on 15-year and 20-year gilts respectively. This has the benefit of locking in low interest rates for longer, in contrast with most of the other countries shown that tend to issue debt with an average maturity of less than ten years.

Quantitative easing complicates the picture, as by repurchasing a significant proportion of government debt and swapping it for central bank deposits, central banks have reversed the security of fixed interest rates locked in to maturity with a variable rate exposure that will hit the interest line immediately if rates change. 

In theory, this should not be a problem, as higher interest rates are most likely to accompany stronger economic growth and hence higher tax revenues with which to pay the resultant higher debt interest bills, but in practice treasury ministers are not so sanguine. In leveraging public balance sheets to finance their responses to COVID-19 – on top of the legacy of debt from the financial crisis – governments have significantly increased their exposure to movements in interest rates, just as other fiscal challenges are growing more pressing.

Expect to hear a lot more over the coming decade about the resilience of public finances as governments seek to reduce gearing and reduce their vulnerability to the next unexpected crisis, whenever that may occur.

This chart was originally published on the ICAEW website.

Test and trace in England falls short despite £22bn budget

11 December 2020: Despite achieving significant increases in testing activity, the Department of Health and Social Care’s test and trace service failed to meet recommended effectiveness rates, according to the NAO.

The rapid scale-up of COVID-19 test and trace service saw 23 million tests carried out, 630,000 of 850,000 people testing positive reached and 1.4 million of their contacts traced up to 4 November. However, at 66% the close contact trace rate is below the 80% needed to be effective.

The National Audit Office (NAO) has issued an interim report on the NHS Test and Trace Service set up by the Department of Health and Social Care (DHSC or the Department) to test for COVID-19 and to trace close contacts of those testing positive. 

The NAO reports that between 28 May and 4 November 2020, only 41% of test results were provided within the target time of 24 hours and only 66% of close contacts of those testing positive were reached and asked to self-isolate, compared with the 80% rate recommended by the Scientific Advisory Group for Emergencies (SAGE) for an effective test and trace system.

Test and trace programmes are a core public health response in epidemics that can be used with other measures, such as social distancing, barriers (such as masks) and handwashing, to reduce infections. At the start of the COVID-19 outbreak, Public Health England carried out comprehensive testing and tracing on the relatively low numbers of initial infections, but this was suspended at the start of the first national lockdown in mid-March. The Department scaled-up testing capacity from April onwards and on 28 May 2020 launched the NHS Test and Trace Service covering England.

The NAO’s key findings include:

  • The Department has achieved significant increases in testing activity, set up a national contact tracing service scratch and has tested millions of people.
  • The delivery model chosen for the national test and trace programme, which excluded local public health teams from the response, was only documented in a retrospective business case written in September 2020.
  • The Department spent £4bn up to October 2020, around £2bn less than forecast, due to underspending on laboratories, machines and mass testing. The total budget for 2020-21 is now £22bn with a significant expansion in mass testing planned in the remaining months of the financial year ending in March 2021.
  • 407 contracts worth £7bn have been signed with 217 public and private organisations, with a further 154 contracts worth £16bn expected to be signed by next March (this includes spend going into the next financial year). An internal government review of test and trace systems in 15 other countries confirmed that the UK approach was atypical, as although some countries had used private sector outsourcing to increase testing capacity, none had done so to increase tracing capacity, which was generally built up from existing public health expertise.
  • Connecting discrete services provided by different organisations into an effective end-to-end process has been challenging, with the initial focus on creating a ‘minimum viable process’ shifting to refining, integrating and stabilising the process so it operates reliably at scale.
  • Accountability is unclear, with the executive chair of the test and trace service reporting directly to the Prime Minister and the Cabinet Secretary, bypassing normal reporting lines within the Department.
  • There are now 593 testing sites and 15 laboratories, with plans to add a further 15 lighthouse laboratories and two high-capacity ‘mega-laboratories’ in January 2021. Testing capacity expanded rapidly in line with the public target of 500,000 available tests per day on 31 October, but the average number of tests since May has been only 68% of capacity, below the 85% expected level. The ambition is to increase testing capacity to 800,000 tests a day by the end of January.
  • Turnaround of test results peaked in June with 93% of community (pillar 2) test results provided in 24 hours, but this had deteriorated to 14% around mid-October before improving to 38% by the beginning of November. Turnaround times for hospital and care homes have consistently been about 90%, albeit measured on a different basis.
  • The Department did not plan for a sharp rise in testing demand in early autumn when schools and universities reopened, resulting in the number of tests available being limited, longer turnaround times and extra assistance being commissioned.
  • Initial problems in sharing data with local authorities have now been largely resolved, but there are a number of significant data risks to be managed pending a planned upgrade of contact tracing software scheduled for January 2021.
  • High reported levels of non-compliance with self-isolation rules represent a key risk to the success of test and trace, and national and local government have been trying to increase public engagement.

The NAO concludes by commenting that although a rapid scale-up in activity has been achieved with new infrastructure and capacity built from scratch, issues with implementation and potentially the initial choice of delivery model mean that the government is not yet achieving its objectives.

The NAO also highlights the most significant risks remaining, including in how to increase utilisation of testing capacity, manage spikes in testing demand and expand the use of local authority public health teams. There are challenges to be overcome in delivering mass testing across the country, increasing public engagement to improve compliance with self-isolation and in ensuring contracts awarded contain sufficient flexibility to respond to changing requirements at reasonable cost.

Finally, the NAO stresses the importance of embedding strong and sustainable management structures, controls and lines of accountability, addressing arrangements where accountability does not clearly align with organisational and strategic objectives in other aspects of the government’s COVID-19 response.

Alison Ring, director for public sector at ICAEW, commented: “While the need to move quickly in response to an out-of-control pandemic was always likely to prove extremely challenging, the NAO has highlighted how consequential the initial decisions made under pressure can be. 

The NAO hints (without being explicit) that the choice to exclude local public health teams and local expertise from the initial roll-out of national test and tracing was a major mistake that the government is still struggling to recover from. They also do not sound entirely comfortable with the governance arrangements for the test and trace service and intend to look at value-for-money and contract management in their second report expected in spring 2021.

Despite an eye-watering £22bn price tag, the investment in test and trace will be worthwhile if it saves lives ahead of the roll-out of vaccines and enables restrictions on our freedom and on economic activity to be lifted as quickly as possible in 2021.”

Read the full report here.

This article was originally published on the ICAEW website.

ICAEW chart of the week: UK trade in goods

With less than a month to go before the UK leaves the EU Single Market and Customs Union, trade is high on the agenda as negotiations between the UK and the EU go down to the wire.

UK trade in goods in the year to September 2020: exports £338bn & imports £420bn

EU: £153bn & £230bn
Continuity deals: £49bn & £43bn
USA: £53bn & £38bn
China: £32bn & £54bn
Other: £51bn & £54bn

The #icaewchartoftheweek this week is on international trade, illustrating how exports and imports of goods amounted to £338bn and £420bn respectively in the year to 30 September 2020. This excludes £289bn and £181bn of services exports and imports over the same period that are also extremely important, but which are not the principal subjects of the free trade deal currently being negotiated.

The UK’s largest trading partnership for goods is with the members of the EU Customs Union (together with Turkey for non-agricultural products), with the UK exporting £153bn (45% of total goods exports) and importing £230bn (55% of total goods imports). 

This is followed by a further £49bn (15%) of exports to and £43bn (10%) of imports from 52 countries that have trade deals with the EU that the UK has been able to agree replacement trade arrangements with. These include Norway, Switzerland, Japan, South Korea, Canada and South Africa, with discussions underway to roll-over trade deals with a further 13 countries not included in these numbers, in particular with Singapore and Vietnam.

The UK’s two largest individual trading partners are the USA and China, where the UK will continue to trade on World Trade Organisation (WTO) terms. The UK exported £53bn (16%) of goods to the USA and imported £38bn (9%) in the year to September, while it exported £32bn (9%) to China and imported £54bn (13%).

The balance of goods trade, comprising exports of £51bn (15%) and imports of £54bn (13%), is with over 130 other countries and territories where the UK does not have a trade deal in place for after 1 January 2021, including India, Russia, Vietnam, Taiwan, the UAE, Saudi Arabia, Qatar, Thailand, Singapore, Australia, Malaysia and Nigeria.

Both exports and imports of goods have reduced in the year to September 2020 compared with a year previously, with exports down 7% and imports down 18%. The principal driver of the fall is the coronavirus pandemic, although reconfiguration of cross-border supply chains ahead of the end of the transition period may also be a factor.

Although global trade is expected to pick up in 2021 once covid-19 vaccines are widely available, there is significant uncertainty as to the effect on trade of the UK’s departure from the Single Market and Customs Union – with or without a deal. Either way, increased trade frictions are likely to have at least some impact, while the imposition of tariffs in the event of no deal could cause significant additional problems for key sectors such as car manufacturing and agriculture.

The size and closeness of the EU economy means that it will continue to be the most important trading partner for the UK whatever is agreed. If only we knew on what terms we are going to be trading in less than a month’s time and what the major changes that are coming in January will mean for the future!

This chart was originally published on the ICAEW website.

ICAEW chart of the week: Spending Review 2020

In the wake of the government’s Spending Review, this week’s chart focuses on the bigger picture and looks at the scale of public spending in relation to the size of the overall economy.

Spending Review 2020: Public spending as % of GDP

2019-20: Department spending 17.0% + other spending 12.3% + welfare 10.3% + covid 0.2% = 39.8%

2020-21: 19.3% + 13.3% + 11.5% + 12.2% = 56.3%

2021-22: 19.5% + 12.4% + 10.6% + 2.6% = 45.1%

2022-23: 19.2% + 12.2% + 10.6% = 42.0%

2023-24: 19.2% + 12.1% + 10.5% = 41.8%

2024-25: 19.3% + 12.1% + 10.5% = 41.9%

2025-26: Departmental spending 19.3% + other spending 12.0% + welfare 10.5% = 41.8%

There was a lot of substance in the Spending Review 2020 announced this week, with a lot more going on under the surface with – for example – the launch of the National Infrastructure Strategy. However, we thought we would focus on the bigger picture for the #icaewchartoftheweek and to look at the scale of public spending in relation to the size of the overall economy.

Of course, the current financial year has seen a massive expansion in the amount of public spending – up from £884bn or 39.8% of GDP of £2,218bn in 2019-20 to a revised budget of £1,165bn or 56.3% of GDP of £2,069bn. The combination of higher spending and a smaller economy this year makes for an eye-watering percentage.

Next financial year will see further COVID support measures adding to public spending, but the key takeaway from the chart is that public spending is expected to persist at around 42% of GDP from 2022-23 onwards, reflecting a permanently smaller economy following the pandemic combined with slightly higher spending in real terms. This is 2% higher than the just under 40% seen in 2019-20 and 3%-4% higher than the 38%-39% longer-run average.

Around half of the increase in departmental spending seen in the chart relates to capital investment in line with the government’s infrastructure plans, while the remainder relates to operational spending with more for health, education and defence being partially offset by the reduction in development spending and the one-off public sector pay freeze.

With scope for substantial reductions in public spending seen to be limited, there are two main routes for covering this increase in costs – economic growth to boost the size of the economy or higher taxes. The government will be hoping that its increase in capital investment will help to deliver on the former, but it appears increasingly likely that tax rises will be needed over the course of the coming decade.

This chart was originally published on the ICAEW website.

Spending Review 2020: public finances dominated by COVID aftermath

26 November 2020: The Office for Budget Responsibility presented its latest economic and fiscal forecasts to accompany yesterday’s Spending Review. As expected, the forecasts were far from pretty.

In its latest economic and fiscal outlook, the Office for Budget Responsibility (OBR) confirmed that economic and fiscal damage from the pandemic is severe and will have a lasting effect. 

The fiscal watchdog now expects to see a sea of red ink across the first half of the coming decade: a £394bn deficit (19% of GDP) this year and the UK still running a fiscal deficit of over £100bn in five years’ time. This will be a decade after the point at which a previous Chancellor, George Osborne, hoped to have eliminated the deficit completely.

This is the highest ever fiscal deficit experienced in peacetime by the UK and reflects an additional £21bn for the cost of extending the furlough scheme across the winter and £30bn in anticipated write-offs of CBILS and other lending packages.

The fiscal pain is expected to continue into the next financial year starting on 1 April 2021, with the government planning an additional £55bn in COVID-related spending. This is offset to an extent by £10bn in lower departmental budgets, partly as a consequence of the one-year public sector pay freeze. The government says that despite this, ‘core day-to-day department spending’ is growing at 3.8% a year on average in real terms from 2019-20 to 2021-22.

Deficit to remain high for years to come

Table 1 below highlights how the deficit is forecast to be £164bn next year and to remain at over £100bn over the rest of the forecast period. This is despite GDP recovering in 2021-22 to the same level as last year (about 4% lower once inflation is taken into account) with the Chancellor hoping for strong growth to continue into 2022-23 before returning to trend after that.

Table 1 - OBR November 2020 summary economic and fiscal forecasts to 2025-26.

Click on link to ICAEW website for a readable version of this table.

The Spending Review boasts that it includes £100bn of central government capital investment in 2021-22, a £27bn real-terms increase compared with 2019-20. This reflects planned increases in previous budgets, with no new funding included in yesterday’s announcement. There are concerns about how deliverable the government’s capital investment plans are, with the OBR increasing its estimate for capital budget underspends and scaling back expectations of local authority and public corporation capital expenditure by £4bn in 2021-22 and by £3bn in subsequent years. These are both likely to reduce any positive impact that may come from the £4bn ‘levelling up fund’ announced by the Chancellor

Table 2 summarises the changes between the pre-pandemic forecasts presented in the Spring Budget in March 2020 and the latest forecasts published yesterday.

Table 2 - OBR November 2020 changes since March 2020 pre-pandemic forecasts

Click on link to ICAEW website for a readable version of this table.

Table 3 illustrates how debt is expected to increase from £1.8tn in March 2020 to £2.3tn in March 2021 and to continue to grow to £2.8tn by March 2026, in excess of 100% of GDP throughout the next five years.

Fortunately for the government, the cost of the additional borrowing required to fund the deficit has continued to fall dramatically, with central government debt interest falling from £37bn in 2019-20 to £18bn in 2021-22, before gradually rising to £29bn in 2025-26.

Table 1 - OBR November 2020 public sector net debt to 2025-26

Click on link to ICAEW website for a readable version of this table.

Martin Wheatcroft FCA, external adviser to ICAEW on public finances, commented: “The Spending Review was pretty much as expected, with COVID-related spending extended into the next financial year and the trailed public sector pay freeze allowing the government to maintain its capital investment ambitions.

However, buried in the detail is an expectation by the OBR that it will be difficult to deliver those plans on schedule. Combined with lower capital expenditure by local government and public corporations, the hoped-for economic boost could prove elusive.

With the spending side buttoned-down for now, the focus will move to how the Chancellor plans to close the gap between receipts and spending, with the prospect of tax rises on the horizon. It is important the government takes this opportunity to develop a long-term fiscal strategy to address the long-term unsustainability of the public finances that needed addressing even before the pandemic added to the scale of the challenge.”

This article was originally published on the ICAEW website.