Public finances continue to disappoint ahead of the Budget

The cumulative budget overrun has widened from £7bn to £10bn in seven months, reveals latest data from the Office for National Statistics.

The monthly public sector finances release, published by the Office for National Statistics (ONS) on 21 November 2025, reported a provisional shortfall between receipts and public spending of £17bn in October and a cumulative deficit of £117bn for the seven months then ended. 

Martin Wheatcroft, external adviser on public finances to ICAEW, says: “The monthly public finances continue to disappoint, with the cumulative budget overrun widening from £7bn in the last release to £10bn for the seven months to October

“While only slightly worse than expected, there were no rays of sunshine in these numbers for a beleaguered Chancellor trying to navigate her way through a series of political, economic and fiscal minefields surrounding the Autumn Budget.”

Month of October 2025

There was a £17bn shortfall between provisional receipts of £96bn and total public spending of £113bn in October 2025. This was £2bn better than the £19bn deficit incurred in October last year (£89bn receipts less £108bn total spending), but £3bn more than the budget of £14bn for the month.

Current spending of £108bn and net investment of £5bn in October were both in line with the £108bn and £5bn monthly averages incurred respectively during the first six months of the financial year.

October’s semi-annual advance tax payments meant that public sector net debt fell by £12bn during the month (from £2,917bn on 30 September to £2,905bn on 31 October 2025), with a net inflow of £29bn from working capital movements and lending activities more than offsetting the £17bn absorbed by the deficit.

Seven months to October 2025

The provisional £117bn deficit for the seven months to October 2025 was £9bn or 8% more than in the same seven months last year, and £10bn more than the £107bn that was budgeted. The £10bn overrun can be analysed as a £15bn adverse variance on the current budget deficit, offset by a £5bn underspend on net investment. 

Table 1 highlights how year-to-date receipts of £672bn were 7% higher than the same period last year, with income tax up 8% from a combination of inflation and fiscal drag from frozen tax allowances. National insurance was up 19% as a result of the increase in employer national insurance from April 2025 onwards, and VAT receipts were up 4%, broadly in line with consumer price inflation.

Compared to last year, the 8% increase in spending to £756bn in the first seven months to October 2025 has principally been driven by public sector pay rises, higher supplier costs, the uprating of welfare benefits and higher debt interest. 

Debt interest of £88bn was £9bn higher than for the first seven months of 2024/25, comprising a £7bn increase in indexation on inflation-linked debt as inflation rose again in 2025 and a £2bn increase in interest on variable and fixed-interest debt. The latter reflects a higher level of debt compared with a year ago, offset by a lower Bank of England base rate.

Net investment of £33bn in the first seven months of 2025/26 was £2bn or 6% higher than the same period last year. This comprised capital expenditure of £55bn (up by £2bn or 4%) and capital transfers (capital grants, research and development funding and student loan write-offs) of £20bn (up £2bn or 11%), less depreciation of £42bn (up by £2bn or 5%).

Table 1: Summary receipts and spending 

7 months
to Oct
2025/26
£bn
2024/25
£bn

Change
Income tax167154+8%
VAT122117+4%
National insurance11496+19%
Corporation tax6056+7%
Other taxes135130+4%
Other receipts7473+1%
Current receipts672626+7%
Public services(424)(393)+8%
Welfare(181)(171)+6%
Subsidies(21)(20)+5%
Debt interest(88)(79)+11%
Depreciation(42)(40)+5%
Current spending(756)(703)+8%
Current deficit(84)(77)+9%
Net investment(33)(31)+6%
Deficit(117)(108)+8%

Budget for the rest of the financial year

The deficit is budgeted to be £118bn for the full year ending 31 March 2026, comprising £107bn in the first seven months of the year to October 2025 and £11bn in the remaining five months.

The latter comprises budgeted deficits of £9bn and £11bn in November and December 2025, a forecast surplus of £23bn in January, and deficits of £1bn and £13bn in February and March 2026.

Borrowing and debt

Table 2 summarises how the government borrowed £95bn in the first seven months of the financial year to take public sector net debt to a provisional £2,905bn on 31 October 2025. This comprised £117bn in public sector net borrowing (PSNB) to fund the deficit, less a £22bn net inflow from working capital movements and government lending.

The table also illustrates how the debt to GDP ratio increased by 1.0 percentage points from 93.5% of GDP at the start of the financial year to 94.5% on 31 October 2025. Incremental borrowing of £95bn, equivalent to 3.2% of GDP, was partly offset by 2.2 percentage points from the ‘inflating away’ effect of inflation and economic growth on GDP, the denominator in the net debt to GDP ratio.

Table 2: Public sector net debt and net debt/GDP 

7 months
to Oct
2025/26
£bn
2024/25
£bn
PSNB117108
Other borrowing(22)10
Net change9598
Opening net debt2,8102,686
Closing net debt2,9052,784
PSNB/GDP4.0%3.8%
Other/GDP(0.8%)(0.4%)
Inflating away(2.2%)(3.1%)
Net change1.0%0.3%
Opening net debt/GDP93.5%94.4%
Closing net debt/GDP94.5%94.7%

Public sector net debt on 31 October 2025 of £2,905bn comprised gross debt of £3,352bn, less cash and other liquid financial assets of £447bn. 

Public sector net financial liabilities were £2,583bn, which included public sector net debt plus other financial liabilities of £715bn, less illiquid financial assets of £1,037bn. Public sector negative net worth was £926bn, comprising net financial liabilities less non-financial assets of £1,657bn.

Revisions

Caution is needed with respect to the numbers published by the ONS, which are repeatedly revised as estimates are refined and gaps in the underlying data are filled. This includes local government, where the numbers are only updated in arrears and are based on budget or high-level estimates in the absence of monthly data collection.

This month was no different, with the ONS revising previously reported numbers for six months to September 2025 and for previous financial years. However, on this occasion, the changes made did not affect the aggregate totals when rounded to the nearest billion pounds.

Regular updates to economic statistics resulted in an upward revision to nominal GDP and a consequential 0.2 percentage point reduction in the ratio of public sector net debt to GDP from 95.3% to 95.1% as of 30 September 2025.  

For further information, read the public sector finances release for October 2025.

This article was written by Martin Wheatcroft on behalf of ICAEW and was originally published by ICAEW.

ICAEW chart of the week: Controlling for debt

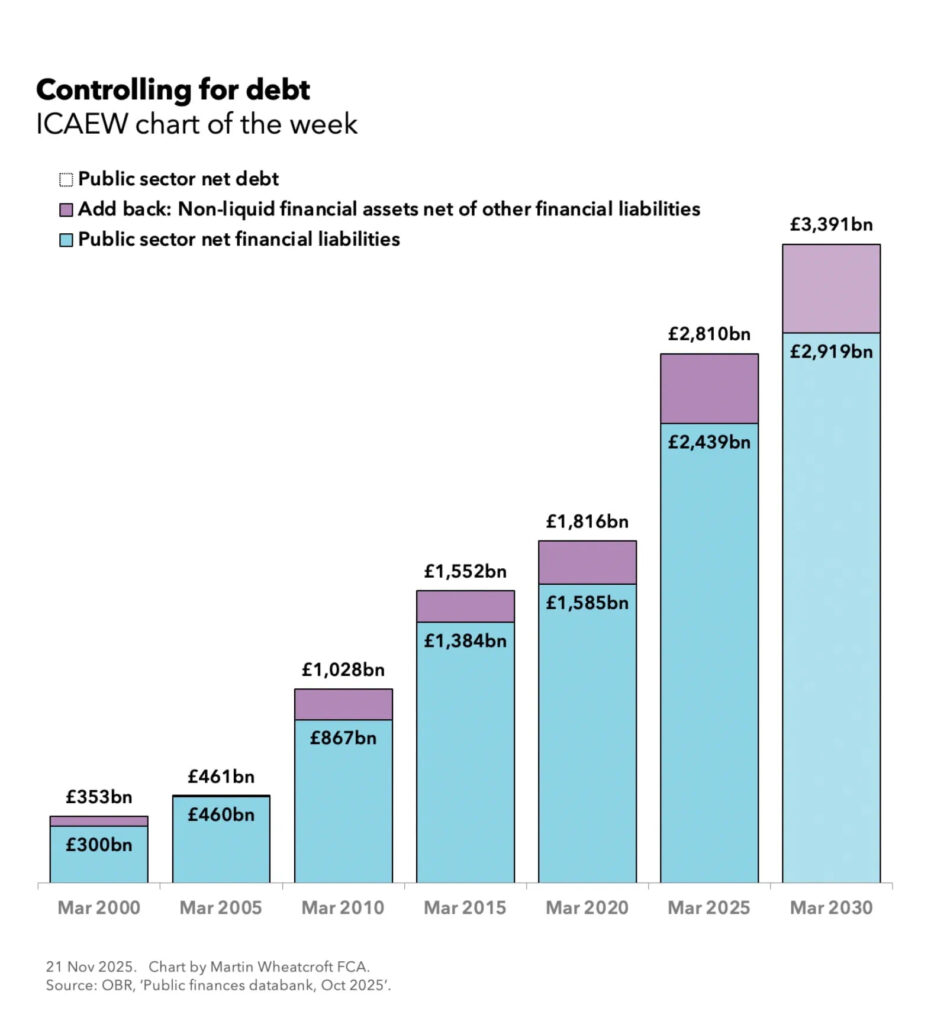
My chart for ICAEW this week shows how the high level of public debt is the main factor shaping next week’s Autumn Budget.

ICAEW chart of the week: Controlling for debt. 

Seven column chart showing public sector net financial liabilities and public sector net debt, with the difference (the add back of non-liquid financial assets net of other financial liabilities) shown without numbers. 

Public sector net financial liabilities: £300bn, £460bn, £867bn, £1,384bn, £1,585bn, £2,439bn and £2,919bn in Mar 2000, 2005, 2010, 2015, 2020, 2025 and 2030 respectively. 

Public sector net debt: £353bn, £461bn, £1,028bn, £1,552bn, £1,816bn, £2,810bn and £3,391bn in Mar 2000, 2005, 2010, 2015, 2020, 2025 and 2030 respectively. 

21 Nov 2025. Chart by Martin Wheatcroft FCA. 
Source: OBR, 'Public finances databank', Oct 2025.

In the run up to next week’s Autumn Budget it has become clear that the Chancellor has very little room for manoeuvre. 

In past fiscal events, a moderate downgrade in the economic and fiscal forecasts (see last week’s chart of the week) would typically be dealt with by allowing borrowing to rise, albeit in combination with a small cut in planned public spending (often to capital expenditure) and perhaps some minor tax rises. 

This time is different. Borrowing – the normal safety valve for adverse forecast changes – is constrained by the existing high level of debt and by government’s existing plan to borrow substantial sums over the next five years, as illustrated by our chart of the week.

As my chart for ICAEW sets out, public sector net debt has risen over the past quarter of a century from £353bn on 31 March 2000 to £461bn in 2005, £1,028bn in 2010, £1,552bn in 2015, £1,816bn in 2020 and £2,810bn in 2025. It is forecast to rise further to £3,391bn on 31 March 2030.

Although the planned increase of £581bn over the coming five years is less than the £994bn increase over the previous five years, the latter included both the pandemic and an unexpected energy crisis.

The chart also shows how public sector net financial liabilities (PSNFL), the measure of debt that the Chancellor uses for her fiscal rules, increased from £300bn on 31 March 2000 to £2,439bn on 31 March 2025, with a planned rise of £480bn to £2,919bn due to take place on 31 March 2030.

The Chancellor’s debt fiscal rule is for the ratio of PSNFL to GDP starting to fall by 2029/30, or – in other words – for the rate at which debt is increasing to be slower than the rate of growth in the economy in four years’ time. The hope is that the borrowing the government is doing now to invest in infrastructure and economic development will speed up economic growth over that time, but unfortunately that is not yet showing up in the forecasts, which are going in the opposite direction.

With higher borrowing ruled out, the next option would be to look at spending. This also looks difficult as the Spending Review earlier this year locked in departmental budgets for the next few years (to 2028/29 for current spending and to 2029/30 for capital investment). Likewise, significant cuts in welfare spending also appear unlikely given the government’s failure to persuade its MPs to back a plan to cut back on disability and illness benefits and hints that the government wants to lift the two-child benefit cap. The Chancellor could potentially re-open the Spending Review, but that would risk spending going up not down given the continued pressures on health and the criminal justice systems, not to mention the international pressure from President Trump and others to accelerate increases in defence spending.

With other options such as raising the level of net inward migration also ruled out, that leaves taxation as the only real lever available to the Chancellor. 

The flood of speculation ahead of next week’s Autumn Budget 2025 has ranged from manifesto-busting increases in one of the ‘big three’ taxes (income tax, VAT and national insurance) and fiscal drag (from the extension of freezes in tax allowances), to a long list of tax raising ideas to bring in just a little bit more money here and there that might together add up to a substantial amount.

At this point it seems that little can be ruled out.

This chart was originally published by ICAEW.

ICAEW chart of the week: A big Autumn Budget hole to fill?

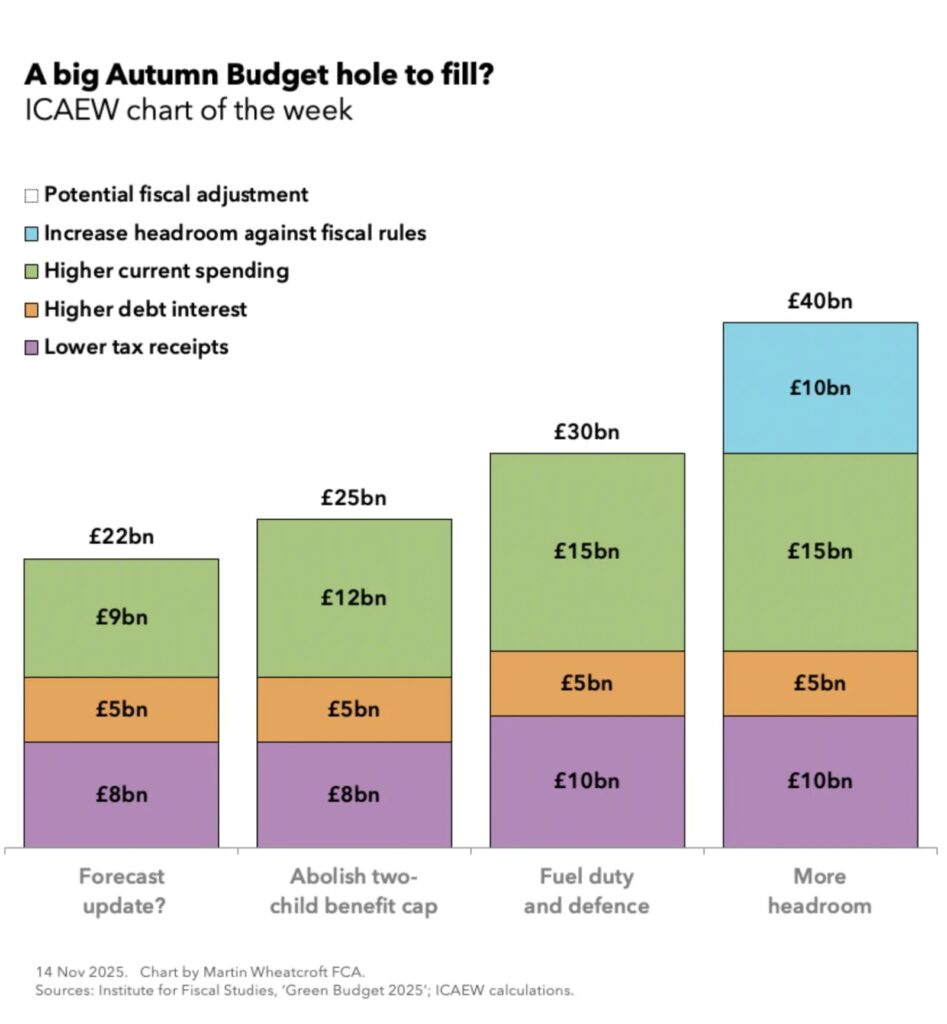
My chart for ICAEW this week takes a look at the £40bn ‘hole’ in the public finances that the Chancellor may have to fill when she presents the Autumn Budget 2025 to Parliament on Wednesday 26 November.

ICAEW chart of the week: A big Autumn Budget hole to fill? 

A column chart showing four cumulative scenarios: 

1. Forecast update?: £8bn lower tax receipts + £5bn higher debt interest + £9bn higher current spending = £22bn potential fiscal adjustment. 

2. Abolish two-child benefit cap: £8bn lower tax receipts + £5bn higher debt interest + 129bn higher current spending = £25bn potential fiscal adjustment. 

3. Fuel duty and defence: £10bn lower tax receipts + £5bn higher debt interest + £15bn higher current spending = £30bn potential fiscal adjustment. 

4. More headroom: £10bn lower tax receipts + £5bn higher debt interest + £15bn higher current spending + £10bn increase headroom against fiscal rules = £40bn potential fiscal adjustment. 

14 Nov 2025. Chart by Martin Wheatcroft FCA. 
Sources: Institute for Fiscal Studies, 'Green Budget 2025'; ICAEW calculations.

There are two really big questions that most of us have for the Chancellor about the Autumn Budget 2025. Firstly, just how much money does she need to find? Secondly, where is she is going to find it?

My chart for ICAEW this week focuses on the first question – how much will the Chancellor need to find (in tax rises or spending cuts) to stick within her fiscal rules?

Speculation ranges from just under £20bn a year up to as much as £50bn depending on who you talk to, with the consensus being somewhere in the region of £30bn or £40bn.

The starting point for the chart is the official OBR projection that the Chancellor has already received. As we don’t have access to that, we have cribbed from the Institute for Fiscal Studies (IFS) Green Budget 2025 report, an independent ‘green paper’ pre-legislative report that provides an in-depth analysis of the economic and fiscal situation facing the UK that also takes a look at potential options available to the Chancellor. 

Based on an updated economic forecast prepared by Barclays, the IFS think that the OBR’s March 2025 projected current budget surplus of £10bn in 2029/30 could be revised down to a projected current budget deficit of £12bn – a £22bn deterioration.

The numbers calculated by the IFS indicate £8bn lower tax receipts, £5bn higher debt interest, and £9bn higher current spending. The lower tax receipts and higher debt interest reflect a less favourable economic outlook than anticipated by the OBR back in March, while the latter consists of £1bn from the partial roll-back of cuts to the winter fuel allowance, £5bn from the failure to enact previously planned cuts to disability benefits, and £3bn from the effect of higher than previously forecast inflation on the uprating of the state pension and other welfare benefits.

If the OBR’s updated projections were to align with this scenario, then the Chancellor would need to find £22bn to get back to a projected current budget surplus of £10bn in 2029/30, assuming she decides again to give herself £10bn of headroom against her primary fiscal rule of a current budget balance.

We don’t know how these numbers compare with the numbers that the OBR are working on, but we do know that the OBR has been reviewing its assumptions for productivity growth, where it has proved consistently over-optimistic in previous forecasts. The IFS estimate that just a 0.1 percentage point downgrade in annual productivity growth would reduce the current budget balance by around £7bn in 2029/30, highlighting how sensitive the numbers are to relatively small changes. The IFS assume a downgrade of between 0.1 and 0.2 percentage points in their projection, although some rumours suggest the OBR has been considering a downgrade of as much as 0.3 percentage points.

The Chancellor has dropped a clear hint that she is going to abolish the two-child limit in the Autumn Budget as part of the government’s efforts to tackle child poverty, with the IFS and the Resolution Foundation both estimating that this could cost the exchequer between £3bn and £4bn a year by 2029/30. This would take the potential ‘hole’ up to £25bn.

For the purposes of the chart, I have also added in £5bn for further policy changes. Firstly, there is a good chance that the Chancellor will choose to make the existing 5p ‘temporary’ cut in fuel duties permanent at a cost of £2bn a year. This is currently scheduled to be reversed on 1 April 2026, alongside the expected end of the annual freeze in fuel duties – a measure that, if continued, could cost a further £3 billion a year by 2029/30.

The government is also under significant pressure – from President Trump and other NATO allies in particular – to accelerate increases in the defence budget to meet the new NATO target for spending on defence and security of 3.5% of GDP. Although the NATO target includes capital expenditure (which is not part of the current budget surplus or deficit), we have included a proxy amount of £3bn a year by 2029/30 for additional operating expenditure on defence.

This brings the potential funding requirement to roughly £30 billion, if the Chancellor aims to maintain £10bn of headroom against her fiscal rule of achieving a current budget balance in the fourth year of the forecast.

Unfortunately, as the government has discovered over the past year, such a small margin – less than 0.3% of GDP – is hugely problematic. Relatively small changes in the OBR’s assumptions or in actual economic performance can easily use up all the headroom, leading (as we have seen) to endless speculation about what the Chancellor is going to have to do to bring the public finances back under control. 

The Chancellor is therefore expected to provide herself with a bigger cushion to reduce the risk of having to come back to raise taxes for a third time. The chart thinks she is likely to choose to double the level of headroom as a minimum – from £10bn to £20bn – with some economic commentators suggesting that an even larger cushion might be necessary.

The IFS point out in their report that extra headroom may be needed in any case because of the Chancellor’s second ‘debt’ fiscal rule, which is for public sector net financial liabilities to be falling as a share of GDP by the fourth year of the fiscal forecasts. Although she could cut the capital expenditure already budgeted for 2029/30 to remain within the fiscal rule, the Chancellor has said she wishes to avoid doing so.

Whatever happens, it looks like the Autumn Budget 2025 is going to be a pretty big deal.

This chart was originally published by ICAEW.

Government deficit hits £100bn in the first half of the financial year

Revisions and corrections help reduce the budget overrun to £7bn for the six months to September 2025, but the outlook remains bleak.

The UK government deficit hit £100bn in the six months to September 2025, according to the latest Office for National Statistics’ (ONS) monthly public sector finances release for September 2025, published on 21 October 2025. 

The report also revealed a provisional shortfall between receipts and public spending of £20bn last month. The deficit for the month was £1bn higher than the previous year, in line with the budget. The cumulative deficit was £12bn higher than the first half of 2024/25, and £7bn more than budgeted.

Month of September 2025

Provisional receipts and total public spending for September – £95bn and £115bn respectively – were each 8% more than the previous year.

Current spending included depreciation of £108bn, comparable to the £108bn monthly average in the first five months of the financial year. Net investment was £7bn, higher than the £4bn monthly average investment between April and August 2025.

Excluding net investment, the current budget deficit for the month was £13bn – £2bn more than in the same month last year, £1bn more than budgeted. This was offset by a £1bn underspend on net investment.

Six months to September 2025

The provisional deficit for the six months to September 2025 was £12bn (14%) more than in the same six months last year. This was £7bn higher than budget, which can be analysed as a £13bn budget overrun on the current budget deficit (current receipts less current spending), less a £6bn underspend on net investment.

Table 1 highlights the changes in year-to-date receipts, up 7% overall on last year’s equivalents. These increases were mostly driven by factors such as inflation and fiscal drag from frozen tax allowances. The 20% increase in national insurance revenues reflects the increase in employers’ national insurance.

The 9% increase in current spending over the year has been driven by public sector pay rises, higher supplier costs, and the uprating of welfare benefits.

Net investment of £28bn in the first six months of 2025/26 was £1bn, or 4% higher than the same period last year. Capital expenditure of £46bn was up by £2bn and capital transfers (capital grants, research and development funding, and student loan write-offs) of £18bn were up by £1bn, offset by depreciation of £36bn, up by £2bn.

Table 1  Summary receipts and spending

6 months to Sep2025/26
£bn
2024/25
£bn
Change
%
Income VAT145133+9%
VAT104100+4%
National insurance9882+20%
Corporation tax5248+8%
Other taxes115112+3%
Other receipts6362+2%
Current receipts577537+7%
Public services(363)(334)+9%
Welfare(155)(146+6%
Subsidies(18)(17)+6%
Debt interest(77)(67)+15%
Depreciation(36)(34)+6%
Current spending(649)(598)+9%
Current deficit(72)(61)+18%
Net investment(28)(27)+4%
Deficit(100)(88)+14%

Budget for the rest of the financial year

The deficit is budgeted to be £118bn for the full year ending 31 March 2026, comprising £93bn in the first half of the year to September 2025 and £25bn in the second half of the year.

Borrowing and debt

Table 2 summarises government borrowing in the first six months of the financial year, taking public sector net debt to a provisional £2,916bn on 30 September 2025. This comprised £100bn in public sector net borrowing (PSNB) to fund the deficit and a further £6bn to fund government lending and working capital requirements.

The table also illustrates how the debt-to-GDP ratio increased by 1.6 percentage points, from a revised 93.7% of GDP at the start of the financial year to 95.3% on 30 September 2025, with incremental borrowing of £106bn, equivalent to 3.5% of GDP. It was partly offset by 1.9 percentage points due to inflation and economic growth adding to GDP.

Table 2  Public sector net debt and net debt/GDP

6 months to Sep2025/26
£bn
2024/25
£bn
PSNB10088
Other borrowing6(14)
Net change10674
Opening net debt2,8102,686
Closing net debt2,9162,760
PSNB/GDP3.3%3.1%
Other/GDP0.2%(0.5%)
Inflating away(1.9%)(2.7%)
Net change1.6%(0.1%)
Opening net debt/GDP93.7%94.4%
Closing net debt/GDP95.3%94.3%

Public sector net debt on 30 September 2025 of £2,916bn comprised gross debt of £3,368bn less cash and other liquid financial assets of £452bn. 

Public sector net financial liabilities were £2,565bn, comprising the net debt plus other financial liabilities of £715bn, less illiquid financial assets of £1,066bn. Public sector negative net worth was £908bn – net financial liabilities of £2,565bn less non-financial assets of £1,657bn.

Revisions

Caution is needed with ONS figures, which are repeatedly revised as estimates are refined, and gaps in the underlying data are filled. This includes local government, where numbers are updated in arrears and are based on budget or high-level estimates in the absence of monthly data collection.

This month, the ONS revised down the previously reported deficit for the five months to August 2025 by £4bn, including a £2bn error correction for understated VAT receipts. The ONS also increased the reported deficit for the previous financial year (2024/25) by £4bn to £150bn to incorporate estimates of local government actual expenditure.

More significantly, the ONS revised its methodology for calculating economic activity, resulting in an increase in GDP of 1%. Doing so causes historical percentages for deficit and debt as a proportion of GDP to be revised downwards. This includes a 1.1 percentage reduction in public sector net debt/GDP at the start of the financial year on 1 April 2025, from the previously reported 94.8% to the 93.7% shown in Table 2.  

Martin Wheatcroft, external advisor on public finances to ICAEW, said that public finances were broadly as expected, with the £20bn deficit for the month in line with budget.

“Borrowing to fund the deficit was a fraction under £100bn in the six months to September, the second-highest half-year deficit on record after the pandemic year. This was despite a narrowing of the year-to-date budget overrun to £7bn, as a consequence of error corrections and other revisions to previous months. In addition, statistical revisions to the size of the economy resulted in around a percentage point fall in the ratio of public sector net debt to GDP.”

Tepid economic growth and high debt interest costs will continue to weigh on prospects for the rest of the financial year, he added. “The revisions do very little to alter the bleak outlook for the public finances that is driving the need for a significant fiscal correction in the Autumn Budget 2025.”

This article was written by Martin Wheatcroft for ICAEW and was originally published by ICAEW.

ICAEW chart of the week: Tax burden rising

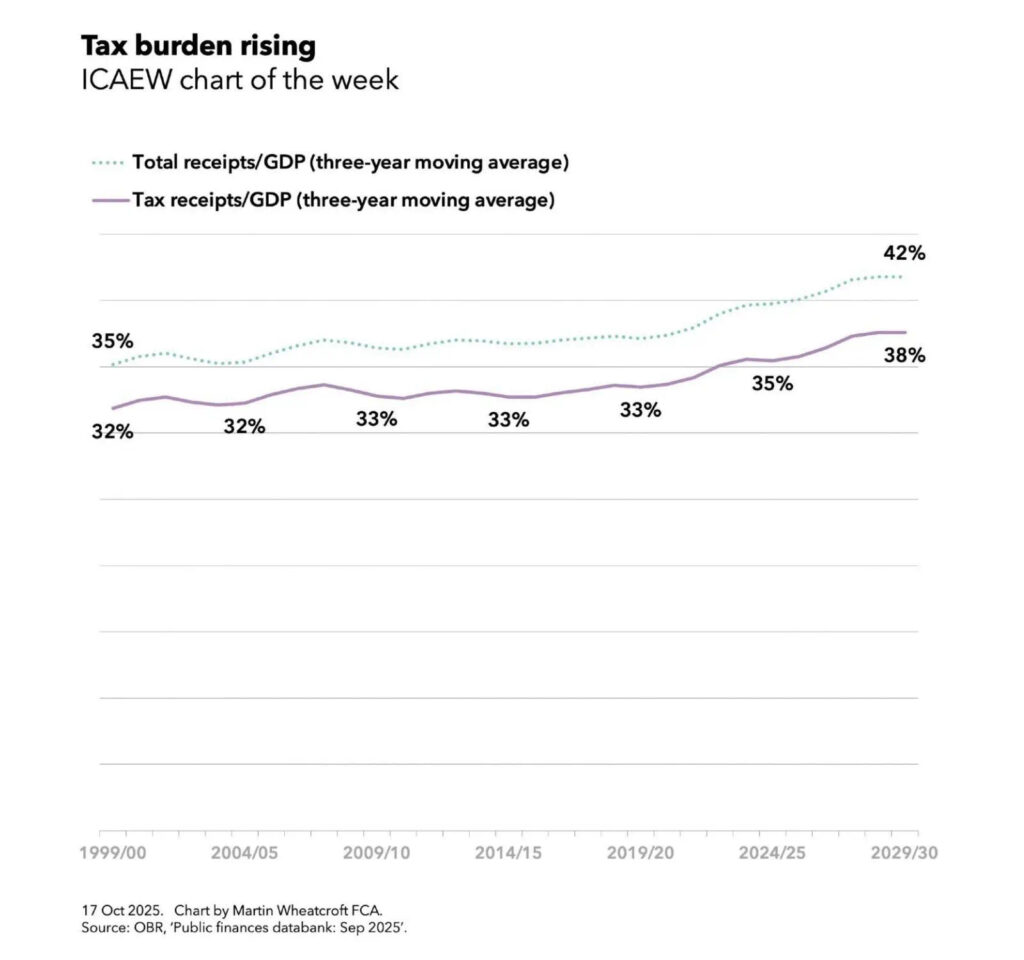
My chart for ICAEW this week shows how tax receipts as a proportion of national income have risen significantly since the turn of the century, begging the question as to whether taxes are too high or the UK economy is too small?

ICAEW chart of the week: Table burden rising. 

A line chart with a solid purple line for tax receipts/GDP (three-year moving average) and a dotted teal line for total receipts/GDP (three-year moving average). 

Tax receipts/GDP (solid purple line) zigs and zags between 32% in 1999/00 to 32% in 2004/05 to 33% in 2009/10 to 33% in 2014/15 to 33% in 2019/20 to 35% in 2024/25 to 38% in 2029/30. 

Total receipts/GDP (dashed teal line) broadly tracks the purple from 35% in 1999/00 to 42% in 2029/30. 

17 Oct 2025. Chart by Martin Wheatcroft FCA. 
Source: OBR, 'Public finances databank: Sep 2025'.

My chart of the week for ICAEW illustrates how tax receipts as a percentage of GDP averaged 32% over the three years to 1999/00, 32% to 2004/05, 33% to 2009/10, 33% to 2014/15, 33% to 2019/20, 35% to 2024/25 and are projected to hit 38% over the three years to 2029/30, based on data from the Office for Budget Responsibilities’ public finances databank for September 2025.

The chart also shows how total receipts including non-tax income averaged 35% in the three years to 1999/00 and a projected 42% to 2029/30.

The one caveat to these percentages is that they do not reflect recent revisions by the Office for National Statistics that increase GDP by the order of 1% across multiple years, which will cause the reported percentages to be a little smaller when they are recalculated by the OBR for the Autumn Budget 2025.

Either way, a projected rise of approaching 20% in the proportion of the economy taken in taxes since the end of last century is pretty significant, even if the projected tax burden will be lower than those of many countries in Europe. 

The chart doesn’t show public spending as a proportion of national income. This averaged 35% of GDP over the three years to 1999/00 and 45% of GDP over the three years to 2024/25, with more people growing older driving up the cost of pensions, health and social care significantly and a much higher bill for debt interest being two of the main factors driving up costs.

Public spending as a share of national income is projected to fall slightly to an average of 44% over the three years to 2029/30 as the government tries to reduce the shortfall between total receipts and spending (aka the deficit) through a combination of higher taxes (as announced in the Autumn Budget 2024) and some constraint in public spending over the next five years.

Unfortunately, a lack of fiscal headroom, a disappointing economic outlook, and cost pressures are now expected to lead the Chancellor to increase taxes even further in the Autumn Budget 2025. This suggests that taxes may be too low, at least if the government is to deliver the level of public services and welfare provision it is committed to.

If taxes are not too high, then the problem must be that the economy is too small. This is evidenced by low productivity growth since the financial crisis and successive economic shocks that have together resulted in a UK economy that has not grown at anywhere near the speed it might have.

If tax cuts are unlikely, at least in the medium-term, the principal route to reduce the tax burden must be to drive up economic growth, as called for in ICAEW’s business growth campaign. This calls for the government to focus on business growth by addressing the many factors that make it too uncertain, too difficult and too expensive to do business in the UK.

This chart was originally published by ICAEW.

Public finances turn ugly just as Chancellor needs good news

Weaker receipts than expected combined with prior month corrections resulted in a £12bn year-to-date budget overrun in the August monthly public finances.

The monthly public sector finances release for August 2025 published by the Office for National Statistics (ONS) on 19 September reported a provisional shortfall between receipts and total public spending of £18bn in August 2025 and £84bn for the five months then ended. These were £6bn and £12bn over budget respectively and £4bn and £16bn higher than in the same periods in 2024.

Martin Wheatcroft, external adviser on public finances to ICAEW, says: “This month’s public finance numbers took a turn for the worse as not only did weaker than expected receipts drive a £6bn budget overrun in August, but revisions to prior months added a further £6bn to the deficit to turn a broadly neutral position a month ago into a £12bn year-to-date budget overrun for the first five months of the 2025/26 financial year.

“These numbers are far from helpful to a Chancellor in desperate need of some good financial news, adding to the prospect of even higher tax rises in the Autumn Budget 2025 than previously feared.”

Month of August 2025

Receipts of £93bn in August 2025 were £5bn or 5% higher than the same month last year, while total public spending was £111bn, £8bn or 8% more than in August 2024. The latter can be analysed between current spending including depreciation of £107bn, slightly below the £108bn monthly average in the first four months of the financial year, and net investment of £4bn, in line with the monthly average incurred between April and July 2025.

Excluding net investment, the current budget deficit for the month of £14bn represented a £4bn deterioration over the current budget deficit of £10bn in the same month last year, highlighting how receipts have failed to keep pace with increases in current spending.

The overall £18bn fiscal deficit for the month was £6bn over budget and £4bn more than in August 2024.

Five months to August 2025

Table 1 highlights how year-to-date receipts of £477bn were up 6% on last year’s equivalents. This included income tax receipts, up 8% from a combination of inflation and fiscal drag from frozen tax allowances, and national insurance receipts, up 18% as a consequence of the increase in employer national insurance from April 2025. VAT receipts were flat year-on-year, in effect a 3% to 4% fall after taking account of consumer price inflation, highlighting the weak economic conditions facing the UK.

Meanwhile, the 8% increase over last year in current spending including depreciation to £539bn in the first five months to August 2025 has principally been driven by public sector pay rises, higher supplier costs, and the uprating of welfare benefits.

This included a £7bn or 12% increase in debt interest to £64bn, which comprised a £6bn increase in indexation on inflation-linked debt as inflation resurged and a £1bn increase in interest on variable and fixed-interest debt. The latter reflects a higher level of debt compared with a year ago being partially offset by a lower Bank of England base rate.

The resulting current budget deficit of £62bn to August 2025 was 29% higher than the £48bn for the same five months last year, a major concern given that the government’s plan was to reduce the cumulative current budget deficit to £47bn at this point.

Net investment of £22bn in the first five months of 2025/26 was £2bn or 10% higher than the same period last year with capital expenditure of £39bn up by £3bn and capital transfers (capital grants, research and development funding, and student loan write-offs) of £13bn up by £1bn, offset by depreciation of £30bn up by £2bn.

The overall provisional deficit for the five months to August 2025 of £84bn is £16bn or 24% more than in the same five months last year and £12bn higher than budget. The latter can be analysed as a £15bn budget overrun on current receipts less current spending for the year-to-date, less a £3bn saving on net investment.

Table 1: Summary receipts and spending

5 months to Aug2025/26
£bn
2024/25
£bn
Change
%
Income tax122113+8%
VAT8484
National insurance8068+18%
Corporation tax4340+7%
Other taxes9693+3%
Other receipts5251+2%
Current receipts477449+6%
    
Public services(301)(276)+9%
Welfare(129)(122)+6%
Subsidies(15)(14)+7%
Debt interest(64)(57)+12%
Depreciation(30)(28)+7%
Current spending(539)(497)+8%
Current deficit(62)(48)+29%
Net investment(22)(20)+10%
Deficit(84)(68)+24%

Borrowing and debt

Table 2 summarises how the government borrowed £99bn in the first five months of the financial year to take public sector net debt to a provisional £2,909bn on 31 August 2025. This comprised £84bn in public sector net borrowing (PSNB) to fund the deficit and a further £15bn to fund government lending and working capital requirements.

The table also illustrates how the debt to GDP ratio increased by 1.6 percentage points from 94.8% of GDP at the start of the financial year to 96.4% on 31 August 2025, with incremental borrowing of £99bn, equivalent to 3.3% of GDP, being partly offset by 1.7 percentage points from the ‘inflating away’ effect of inflation and economic growth adding to GDP, the denominator in the net debt to GDP ratio.

Table 2: Public sector net debt and net debt/GDP

5 months to Aug2025/26
£
bn
2024/25
£
bn
PSNB8468
Other borrowing157
Net change9975
Opening net debt2,8102,686
Closing net debt2,9092,761
   
PSNB/GDP2.8%2.4%
Other/GDP0.5%0.2%
Inflating away(1.7%)(2.3%)
Net change1.6%0.3%
Opening net debt/GDP94.8%95.6%
Closing net debt/GDP96.4%95.9%

Public sector net debt on 31 August 2025 of £2,909bn comprised gross debt of £3,339bn less cash and other liquid financial assets of £430bn. 

Public sector net financial liabilities were £2,550bn, comprising net debt of £2,909bn plus other financial liabilities of £715bn less illiquid financial assets of £1,074bn. 

Public sector negative net worth was £893bn, being net financial liabilities of £2,550bn less non-financial assets of £1,657bn.

Revisions

Caution is needed with respect to the numbers published by the ONS, which are repeatedly revised as estimates are refined and gaps in the underlying data are filled. This includes local government, where the numbers are only updated in arrears and are based on budget or high-level estimates in the absence of monthly data collection.

This month was no different, with the ONS revising the previously reported deficit for the four months to July 2025 up by £6bn, as well as updating prior year numbers for the annual results of the Bank of England and several other public bodies as well as other typical annual updates such as revised student loan calculations. 

More significantly, the ONS revised reported deficits back to 1998 for methodology and classification changes and back to 2011 for local government outturn numbers that had not previously been incorporated. The reported deficits for 2020/21 and 2021/22 were decreased by £3bn and £2bn to £311bn and £120bn respectively, 2022/23 remained unchanged at £127bn, 2023/24 was increased by £2bn to £134bn, and 2024/25 was reduced by £2bn to £146bn.

This article was written by Martin Wheatcroft for ICAEW and was originally published by ICAEW.

Little comfort for Chancellor as public finances stay in line

Borrowing to fund the deficit in the first four months of the financial year of £60bn was in line with expectations.

The monthly public sector finances release for July 2025 published by the Office for National Statistics (ONS) on 21 August reported a provisional shortfall between receipts and total public spending of £60bn for the four months ended 31 July 2025. This is in line with budget and £7bn more than in the same period last year.

Martin Wheatcroft, External Adviser on Public Finances to ICAEW, says: “This month’s ‘not bad’ result may provide a small amount of relief to a Chancellor under significant pressure.

“The monthly deficit for July was slightly better than expected, while the cumulative result for the first third of the financial year was almost exactly in line with the Office for Budget Responsibility’s prediction at the time of the Spring Statement 2025.

“Unfortunately, this does not change the dismal outlook for the public finances and the rising costs of public services, welfare provision and debt interest that means the Chancellor is again having to work out how she can ask Parliament to authorise higher levels of taxation.”

Month of July 2025

Receipts of £108.8bn in July 2025 were £9.2bn or 9% higher than in July 2024 and also higher than the £92.6bn average for the first three months of the financial year, principally as a result of a boost from income tax self-assessment collections in the month.

Meanwhile, current spending including depreciation of £105.5bn in July was £6.0bn or 6% more than in the same month a year previously. This was slightly lower than the £108.0bn monthly average incurred during April to June 2025.

The result was a current budget surplus for the month of £3.3bn, a £3.2bn improvement over the current budget surplus of £0.1bn in the same month last year.

Net investment of £4.4bn in July 2025 was £0.9bn more than the £3.5bn incurred in July 2024 and slightly higher than the £4.2bn average incurred during the three months to June 2025.

The provisional fiscal deficit for July 2025 was therefore £1.1bn, £1.0bn less than the £2.1bn budget for the month and a £2.3bn improvement over the £3.4bn deficit in July 2024.

Four months to July 2025

Table 1 highlights how year-to-date receipts of £387bn were up 7% on last year’s equivalents, with income tax receipts up 8% from a combination of inflation and fiscal drag from frozen tax allowances, and national insurance receipts up 19% as a consequence of the increase in employer national insurance that was implemented in April 2025.

Meanwhile, the 8% increase over last year in current spending including depreciation to £430bn in the first four months to July 2025 was primarily as a consequence of public sector pay rises, higher supplier costs, and the uprating of welfare benefits.

This included a £6bn or 13% increase in debt interest to £53bn, which comprised a £5bn increase in indexation on inflation-linked debt as inflation resurged and a £1bn increase in interest on variable and fixed-interest debt. The latter was primarily the result of a higher level of debt compared with a year ago partially offset by a lower Bank of England base rate.

The resulting current budget deficit of £43bn to July 2025 was 16% higher than for the same four months last year.

Net investment of £17bn in the first four months of 2025/26 was £1bn or 6% higher than the same period last year. Capital expenditure of £30bn was up by £1bn and capital transfers (capital grants, research and development funding, and student loan write-offs) of £11bn were up by £2bn, less depreciation of £24bn that was up by £2bn compared with the same four month period a year prior.

The consequence is a provisional deficit for the first third of the 2025/26 financial year of £60bn, which is £7bn or 13% more than in the same four month period last year. Despite being almost exactly in line with budget (only £0.1bn higher) this is the third-highest April-to-July deficit since monthly records began in 1993 (after 2020/21 and 2021/22 during the pandemic).

Table 1: Summary receipts and spending

4 months to July2025/26
£bn
2024/25
£bn
Change
%
Income tax10093+8%
VAT7067+4%
National insurance6454+19%
Corporation tax3532+9%
Other taxes7674+3%
Other receipts4241+2%
Current receipts387361+7%
    
Public services(239)(221)+8%
Welfare(103)(97)+6%
Subsidies(11)(11)
Debt interest(53)(47)+13%
Depreciation(24)(22)+9%
Current spending(430)(398)+8%
Current deficit(43)(37)+16%
Net investment(17)(16)+6%
Deficit(60)(53)+13%

Borrowing and debt

Table 2 summarises how the government borrowed £81bn in the first third of the financial year to take public sector net debt to a provisional £2,891bn on 31 July 2025. This comprised £60bn in public sector net borrowing (PSNB) to fund the deficit and £21bn to fund government lending activities and working capital movements.

The table also illustrates how the debt to GDP ratio increased from 94.8% of GDP at the start of the financial year to 96.1% on 31 July 2025, with the incremental borrowing partly offset by the ‘inflating away’ effect of inflation and economic growth adding to GDP, the denominator in the net debt to GDP ratio.

Table 2: Public sector net debt and net debt/GDP

4 months to July2025/26
£bn
2024/25
£bn
PSNB6053
Other borrowing21(1)
Net change8152
Opening net debt2,8102,686
Closing net debt2,8912,738
   
PSNB/GDP2.1%1.9%
Other/GDP0.7%
Inflating away(1.5%)(1.9%)
Net change1.3%
Opening net debt/GDP94.8%95.6%
Closing net debt/GDP96.1%95.6%

Public sector net debt on 31 July 2025 of £2,891bn comprised gross debt of £3,309bn less cash and other liquid financial assets of £418bn.

Public sector net financial liabilities were £2,525bn, comprising net debt of £2,891bn plus other financial liabilities of £707bn less illiquid financial assets of £1,073bn. Public sector negative net worth was £899bn, being net financial liabilities of £2,525bn less non-financial assets of £1,626bn.

Revisions

Caution is needed with respect to the numbers published by the ONS, which are repeatedly revised as estimates are refined and gaps in the underlying data are filled. This includes local government, where the numbers are only updated in arrears and are based on budget or high-level estimates in the absence of monthly data collection.

The latest release saw the ONS revise the previously reported deficit for the three months to June 2025 up by £1bn. The ONS also revised up its estimate of GDP in the first quarter of the financial year, resulting in a 0.4 reduction in the opening debt to GDP ratio on 1 April 2025 from 95.2% to 94.8% and the debt to GDP ratio for 30 June 2025 from 96.2% to 95.8%.

This article was written by Martin Wheatcroft FCA on behalf of ICAEW and was originally published by ICAEW.

ICAEW chart of the week: One Big Beautiful Bill Act 2025

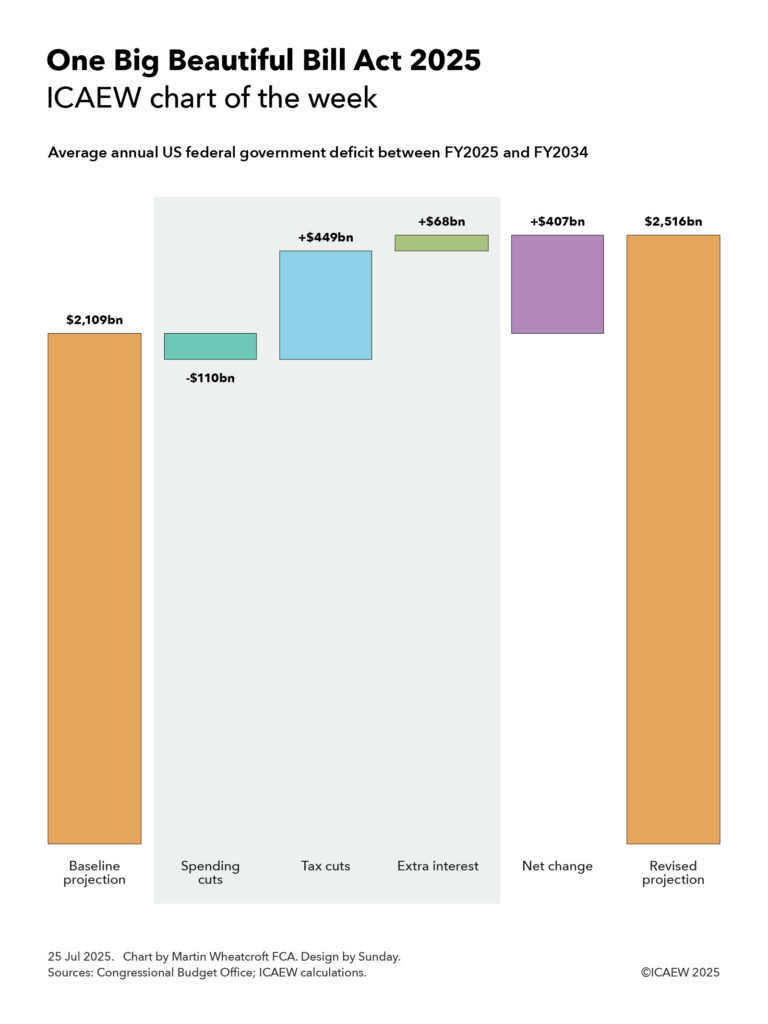
My chart for ICAEW this week looks at the impact on the US federal government deficit of the major tax and spending changes passed by Congress and signed into law by President Trump on 4 July 2025.

ICAEW chart of the week: A step chart showing the projected effect of the One Big Beautiful Bill Act 2025 on the average annual US federal government deficit between FY2025 and FY2034. 

Left hand column: Baseline projection $2,109bn. 

Steps 1 to 3 (shaded): Spending cuts -$110bn plus Tax cuts +$449bn plus Extra interest +$68bn. 

Step 4: Net change +$407bn (total of steps 1 to 3). 

Right hand column: Revised projection $2,516bn. 

25 Jul 2025. Chart by Martin Wheatcroft FCA. Design by Sunday. 
Sources: Congressional Budget Office; ICAEW calculations.

My chart this week looks at the impact on the US federal government deficit of the major tax and spending changes passed by Congress and signed into law by President Trump on 4 July 2025. 

The Congressional Budget Office (CBO) published on 21 July 2025 its assessment of Public Law 119-21 (the 21st law passed by Congress in its 119th session), also known as the One Big Beautiful Bill Act 2025 (OBBBA).

OBBBA was passed by Congress and signed into law by President Trump on 4 July 2025 and contains sweeping changes to the US federal tax system as well as a significant shift in spending priorities.

The chart this week attempts to illustrate the impact of OBBBA on the federal deficit by looking at how it changes the average annual projected deficit over the next 10 years from FY2025 (the current fiscal year ending on 30 September 2025) to FY2034, compared with the CBO’s baseline projection.

The baseline projection, published by the CBO in January 2025, was for the federal government deficit to increase from $1,865bn in FY2025 to $2,597bn in FY2034, an average deficit over the 10 years of $2,109bn or 5.8% of GDP.

According to the CBO, OBBBA is expected to increase the federal deficit each year by $339bn on average over the period to FY2034, with a net cut in federal spending of $110bn on average offsetting a net cut in revenues of $449bn. The CBO’s assessment does not take account of the additional cost of financing these higher deficits, which ICAEW calculates would add a further $68bn a year on average to the interest bill. 

The consequence is a net increase in the annual federal deficit of $407bn on average over 10 years, taking it to an average of $2,516bn or 7.0% of GDP.

Net spending cuts of $110bn comprise spending increases of $66bn a year on average, net of spending reductions of $164bn a year and incremental ancillary income that is deducted from spending of $12bn. Extra spending includes an extension of child tax benefits ($19bn a year on average) and more money for homeland security and immigration enforcement ($18bn), the military and coastguard ($17bn), farm subsidies ($5bn), air traffic control ($1bn), the mission to Mars ($1bn) and other items ($5bn). 

Spending reductions include cuts in Medicaid and Medicare programmes ($106bn on average each year), education and student loan relief ($30bn), other welfare and health programmes ($19bn), clean energy subsidies ($8bn) and other cuts ($1bn), while ancillary income comprises $9bn on average from spectrum auctions, $2bn from oil and gas leases, and $1bn extra from higher visa fees.

Net tax cuts comprise $511bn a year in tax cuts less $62bn a year in tax increases.

Tax cuts include making previous temporary tax cuts permanent ($379bn), business tax reforms ($97bn), personal tax reforms ($26bn), energy related tax credits ($4bn), Medicaid and Medicare related tax deductions ($3bn), and other ($2bn). Tax increases include the termination of tax reliefs for clean energy ($47bn a year), addressing tax loopholes ($6bn), additional immigration fees included in revenue ($4bn), taxing low-value international shipments ($4bn) and other ($1bn).

The CBO doesn’t directly conclude what this will mean for the US national debt (debt held by the public), which was expected in January’s baseline projection to increase from $28.2tn or 98% of GDP at the start of the current financial year to $49.5tn or 117% of GDP on 30 September 2034. Adding $4.1tn over 10 years to that amount suggests this would increase to $53.6bn or 127% of GDP.

These numbers don’t take account of the anticipated economic boost of lower taxes that should partially offset some of the tax impacts set out in the CBO’s analysis, as well as increasing the denominator in the deficit to GDP ratio. However, they also don’t take account of other factors such as US trade policy – including the additional tax receipts from tariffs and the potential effect that those higher taxes will have on the US economy – or many other policies of the US administration. We will need to wait for the CBO’s next full economic and fiscal projections later in the year to understand more about what that might mean.

Either way, the OBBBA will go down as one of the most consequential legislative acts of the US Congress in recent years.

This chart was originally published by ICAEW.

First quarter fiscal deficit in line as Chancellor ponders tax rises

Despite borrowing to fund the deficit in the first three months of the financial year of £58bn being in line with expectations, it was still the third-highest first quarter result on record.

The monthly public sector finances release for June 2025 published by the Office for National Statistics (ONS) on 22 July reported a provisional deficit of £21bn for the month of June and £58bn for the three months then ended. This is £4bn more and in line with budget respectively, and £7bn and £8bn more in each case than the first fiscal quarter a year ago.

Alison Ring OBE FCA CPFA, ICAEW Director of Public Sector and Taxation, says: “Even if borrowing to fund the deficit in the month of June was only a little higher than expected and was in line with expectations in the first three months of the financial year, the first quarter was still the third highest since monthly records began. This trajectory will not have lightened the Chancellor’s mood as she decides which taxes to put up in the Autumn Budget later this year. 

“The government has two big problems with the public finances: the short-term outlook – which is bad – and their long-term prospects – which are worse. Public spending continues to outpace tax receipts by a significant margin, while the OBR has reiterated its conclusion that the public finances are unsustainable over the next 25 to 50 years if this and future governments continue on the current path. 

“Unfortunately, the major challenges facing the public finances over the next quarter of a century and beyond means that this will not be the last time a chancellor of the exchequer needs to come back asking for more. Now is the time to stop kicking the can down the road and develop a comprehensive long-term fiscal strategy to put the public finances onto a sustainable path.”

Month of June 2025

The fiscal deficit for June 2025 was £21bn, £4bn more than budgeted and £7bn more than a year previously. According to the ONS, this was the second-highest June deficit since monthly records began in 1993, with only June 2020 during the pandemic being higher.

First quarter to June 2025

The deficit for the first three months of the 2025/26 financial year was £58bn, £8bn more than a year previously. Despite being in line with budget, this is the third-highest first quarter deficit since monthly records began (after the first quarter deficits in 2020/21 and 2021/22). 

Table 1 highlights how total receipts and total current spending in the three months to June 2025 of £278bn and £323bn were up 7% and 8% respectively, compared with the same period last year.

Receipts were boosted by the employer national insurance increase from April 2025 onwards in addition to the effect of fiscal drag on income tax caused by the continued freeze in personal tax allowances. Meanwhile, the increase in current spending over the past year was primarily as a consequence of public sector pay rises, higher supplier costs and rises in welfare benefits.

The increase in debt interest of £5bn to £42bn consisted of a £6bn increase in indexation on inflation-linked debt as inflation returned less a £1bn reduction in interest on variable and fixed-interest debt. The latter was primarily the effect of a lower Bank of England base rate offsetting a higher level of debt compared with a year ago.

Net investment of £13bn in the first quarter of 2025/26 was £1bn or 8% higher than the same period last year. Capital expenditure of £22bn was up by £1bn and capital transfers (capital grants, research and development funding, and student loan write-offs) of £9bn were up by £1bn, less depreciation of £18bn up by £1bn.

Table 1: Summary receipts and spending

3 months to June2025/26
£bn
2024/25
£bn
Change
%
Income tax6460+7%
VAT5250+4%
National insurance4841+17%
Corporation tax2624+8%
Other taxes5756+2%
Other receipts3130+3%
Current receipts278261+7%
Public services(178)(165)+8%
Welfare(77)(72)+7%
Subsidies(8)(8)
Debt interest(42)(37)+14%
Depreciation(18)(17)+6%
Current spending(323)(299)+8%
Current deficit(45)(38)+18%
Net investment(13)(12)+8%
Deficit(58)(50)+16%

Borrowing and debt

Table 2 summarises how the government borrowed £64bn in the first quarter to take public sector net debt to £2,874bn on 30 June 2025. The movements comprised £58bn in public sector net borrowing (PSNB) to fund the deficit and £6bn to fund government lending activities and working capital movements.

The table also illustrates how the debt to GDP ratio increased from 95.2% of GDP at the start of the financial year to 96.3% on 30 June 2025, with the incremental borrowing partly offset by the ‘inflating away’ effect of inflation and economic growth adding to GDP, the denominator in the net debt to GDP ratio.

Table 2: Public sector net debt and net debt/GDP

3 months to June2025/26
£bn
2024/25
£bn
PSNB5850
Other borrowing6(3)
Net change6447
Opening net debt2,8102,686
Closing net debt2,8742,733
PSNB/GDP2.0%1.8%
Other/GDP0.2%(0.1%)
Inflating away(1.1%)(1.5%)
Net change1.1%0.2%
Opening net debt/GDP95.2%95.6%
Closing net debt/GDP96.3%95.8%

Public sector net debt on 30 June 2025 of £2,874bn comprised gross debt of £3,286bn less cash and other liquid financial assets of £412bn. 

Public sector net financial liabilities were £2,504bn, comprising net debt of £2,874bn plus other financial liabilities of £706bn less illiquid financial assets of £1,076bn. Public sector negative net worth was £878bn, being net financial liabilities of £2,504bn less non-financial assets of £1,626bn.

Revisions

Caution is needed with respect to the numbers published by the ONS, which are repeatedly revised as estimates are refined and gaps in the underlying data are filled. This includes local government where the numbers are only updated in arrears and are based on budget or high-level estimates in the absence of monthly data collection.

The latest release saw the ONS revise the previously reported deficit for the two months to May 2025 down by £1bn and revise public sector net debt on 31 May 2025 up by £7bn.

For further information, read the public sector finances release for June 2025.

This article was originally published by ICAEW.

ICAEW chart of the week: climate change and the public finances

My chart for ICAEW this week looks at how climate change is now expected to make the OBR’s dire predictions for the public finances even worse.

A line chart on climate change and the public finances, with three curved lines for public sector net as a share of GDP over fifty years. with labels from March 2034 onwards. 

Bottom line: Baseline public sector net debt/GDP. Falls from just under 100% of GDP to 90% of GDP in March 2034 and then rises to 100%, 130%, 188% and 274% of GDP in March 2044, 2054, 2064 and 2074 respectively. 

Middle line: Baseline + climate change (below 3°C scenario). Rises from 94% of GDP in March 2034 (label not shown) to 114%, 157%, 235% and 348% of GDP in March 2044, 2054, 2064 and 2074 respectively. 

Top line: Baseline + climate change + economic shocks. Rises from 104% in March 2034 to 134%, 187%, 275% and then 398% in March 2074. 

18 Jul 2025. Chart by Martin Wheatcroft FCA. Design by Sunday. Sources: OBR, 'Fiscal risks and sustainability', Sep 2024 and Jul 2025 reports.

ICAEW’s chart of the week is on climate change this week, illustrating how it could add a further 74 percentage points to the Office for Budget Responsibility (OBR)’s already disheartening baseline projection for public sector net debt of 274% of GDP to reach 348% of GDP, or potentially 398% if economic shocks are included.

The baseline projection, published by the OBR in September 2024, showed public sector net debt as a proportion of the size of the economy falling from just under 100% of GDP to 90% of GDP in March 2034 and then rising to 100%, 130%, 188% and 274% of GDP in March 2044, 2054, 2064 and 2074 respectively. 

One of the main drivers of the baseline projection is the expected rise in spending on pensions, health and social care as more people live longer, sometimes less healthy lives, combined with a falling fertility rate that means there will be proportionately fewer working age adults to pay the taxes needed to fund that rise.

Incorporating the OBR’s new central projection for climate change, public sector net debt would be 94% of GDP in March 2034 (not shown in the chart because of a lack of space between lines) and then 114%, 157%, 235% and 348% of GDP in March 2044, 2054, 2064 and 2074 respectively. Adding potential economic shocks on top would increase the projection for public sector net debt/GDP to 104% in March 2034 rising to 134%, 187%, 275% and then 398% in March 2074.

The September 2024 baseline projection included the loss of fuel duty receipts from the phasing out of petrol and diesel vehicles between now and 2050, but the OBR in its recent July 2025 fiscal and sustainability report has looked in more detail at both the incremental costs of transitioning to net zero and the damage that is likely to result from a much warmer and wetter climate in several different scenarios.

OBR’s central ‘below 3°C’ scenario is based on global average temperatures rising by 2.9°C above pre-industrial levels by 2100, of which weather and other damage associated with a much warmer and wetter climate is projected to add 17 percentage points to accumulated debt over the next half century from direct and indirect costs and revenue losses. Climate damage is also expected to result in slower economic growth that would add 27 percentage points over 50 years by reducing the denominator in the debt to GDP ratio. The government’s share of transition costs (including lower tax receipts from higher private sector spending) is projected to add 7 percentage points, while there is a 22 percentage point impact from the incremental debt interest that would be incurred on a higher level of debt.

This is before taking account of recessions and other potential economic shocks, which based on historical patterns are expected to add 10% of GDP to public sector net debt every decade or so.

The chart does not reflect other risks identified by the OBR in its latest report, where it reports that the exposures to the public finances have increased since its assessment last year. One risk they did look at in some detail is the prospect of higher interest rates on government borrowing on the basis that demand for gilts reduces as the Bank of England winds down its holdings of gilts (quantitative tightening) and defined benefit pension schemes gradually sell their holdings of gilts to fund pension payments. This risk might be mitigated by selling shorter-dated gilts, although shorter maturities would make the public finances less resilient by increasing the amount of debt needing to be refinanced each year.

The OBR’s dismal assessment of the prospects for the public finances highlights just how difficult a financial position the UK finds itself in, with a lot to do (and some luck needed) if it is to be restored to a sustainable path. At the same time, the costs of climate change are now becoming that much more apparent as extreme weather events and other climate-related costs start to show up in public finance and insurance data.

For more information about the role of the accountancy profession in climate change, visit ICAEW’s climate hub.

This chart was originally published by ICAEW.