Cancelled Budget must not be allowed to delay infrastructure plans

29 September 2020: Recently published figures show that the Government burnt through £224bn in the five months to August 2020. This should not stand in the way of an investment-led economic recovery, according to ICAEW’s Public Sector team.

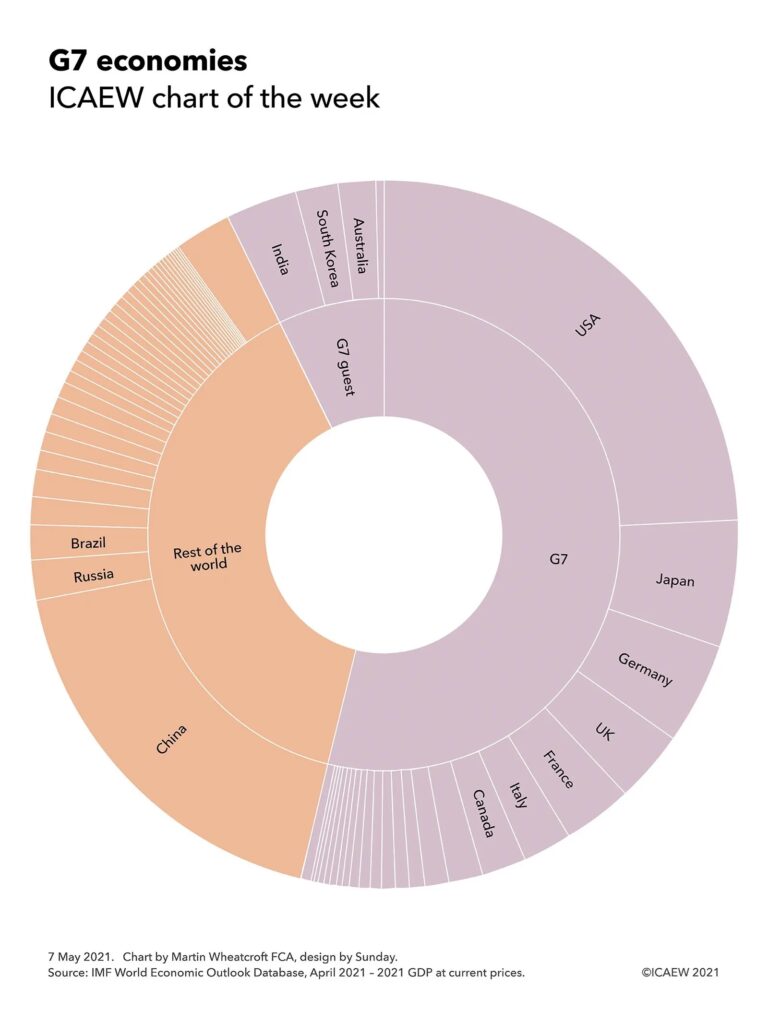
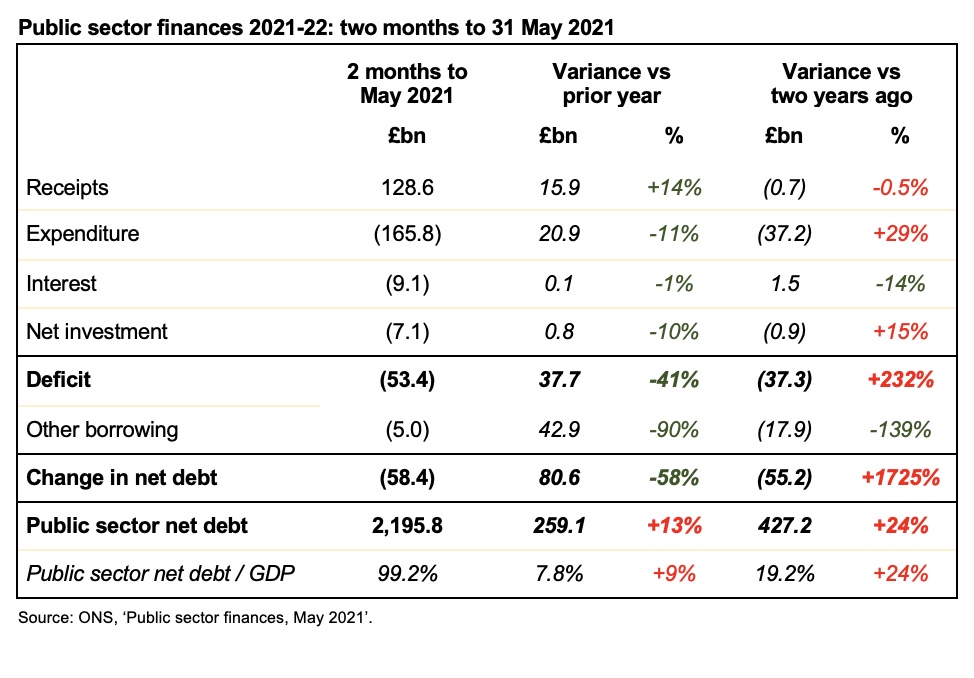
The latest public sector finances for August 2020 published by the Office for National Statistics (ONS) on Friday 25 September 2020 reported a deficit of £35.9bn in August 2020, a cumulative total of £173.7bn for the first five months of the financial year.

Falls in VAT, corporation tax and income tax drove lower receipts, while large-scale fiscal interventions resulted in much higher levels of expenditure. Net investment is greater than last year, as planned, while the interest line has benefited from ultra-low interest rates.

Public sector net debt increased to £2,023.9bn or 101.9% of GDP, an increase of £223.4bn from the start of the financial year and £249.5bn higher than in August 2019. This reflects £49.7bn of additional borrowing over and above the deficit, most of which has been used to fund coronavirus loans to business and tax deferral measures.

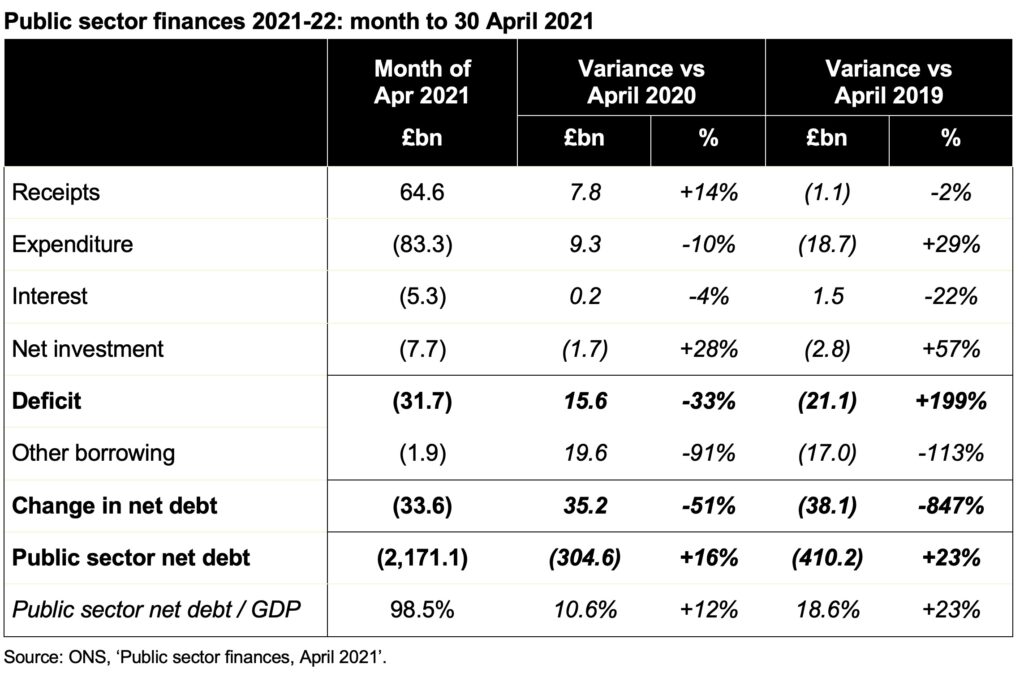
Image of table showing public sector finances for month of August and for 5 months to August 2020, together with variances against last year. Click on the link at the end of the article for a readable version.

The combination of receipts down 12%, expenditure up 35% and net investment up 40% has resulted in a deficit for the five months to August 2020 that is more than three times the budgeted deficit of £55bn for the whole of the 2020-21 financial year set in the Spring Budget in March, despite interest charges being lower by 34%. The cumulative deficit is more than six times as much as for the same five-month period last year.

Cash funding (the ‘public sector net cash requirement’) for the five months was £224.0bn, compared with £5.8bn for the same period in 2019.

Interest costs have fallen despite much higher levels of debt, with extremely low interest rates benefiting both new borrowing to fund government cash requirements and borrowing to refinance existing debts as they have been repaid.

Some caution is needed with respect to the numbers published by the ONS, which are expected to be repeatedly revised as estimates are refined and gaps in the underlying data are filled. In particular, the OBR points out that the ONS has yet to record any allowance for losses that might arise on the more than £100bn of tax deferrals, loans and guarantees provided to support businesses through the pandemic. 

Alison Ring FCA, director for public sector at ICAEW, commented: “The government continued to haemorrhage cash in August, despite furloughed employees returning to work and the warm weather encouraging people to spend money outside their homes. The Chancellor’s Eat Out to Help Out subsidy may have hit the headlines, but at £522m it was only a fraction of the total spending in the year to date of £470.5bn. Large sums were also spent on Test & Trace and PPE, as well on fiscal interventions such as the coronavirus job retention scheme.

While the decision to postpone the Budget until the Spring is understandable given the economic uncertainties as we enter the next phase of the pandemic, we hope that this will not mean further delays for the National Infrastructure Strategy and the green-lighting of infrastructure projects across the country, which will be vital for an investment-led economic recovery.”

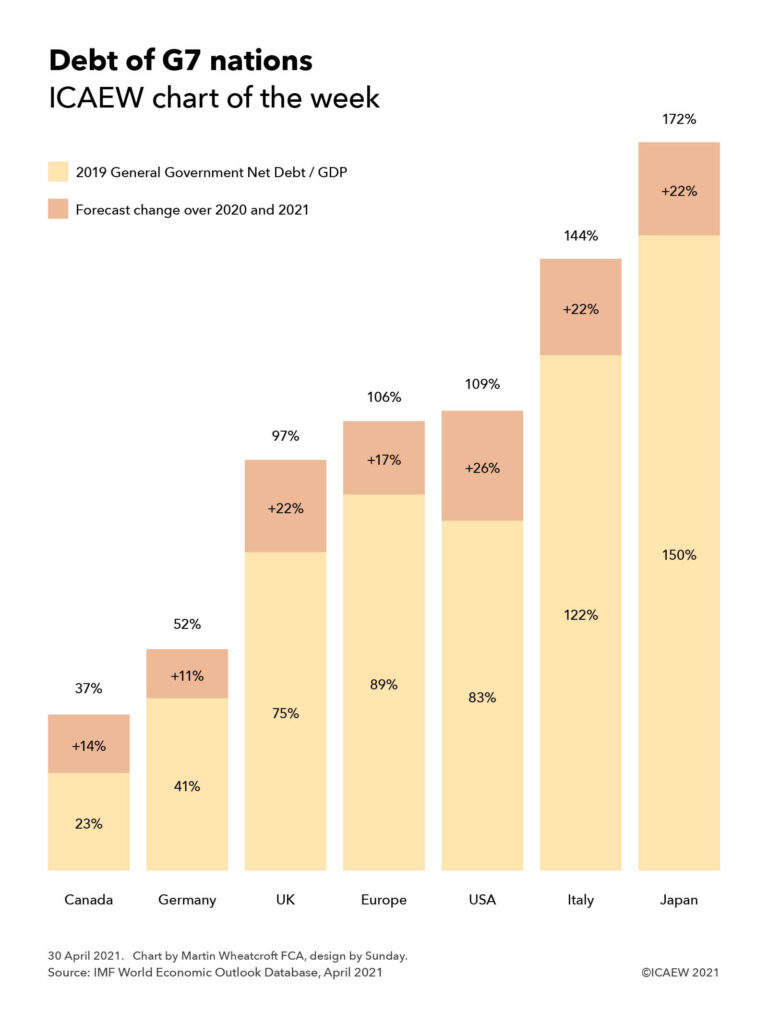
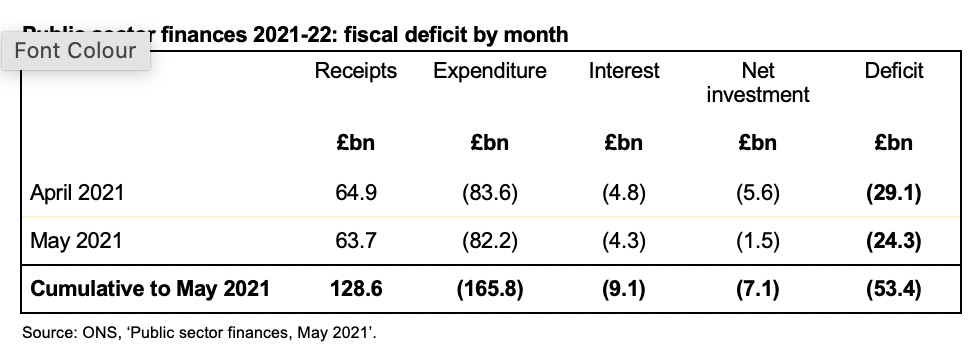
Image of table showing public sector finances for each month to August 2020 and to August 2019. 

Click on the link at the end of the article for a readable version.

The ONS made several revisions to prior month and prior year fiscal numbers to reflect revisions to estimates and changes in methodology and classification. These had the effect of reducing the reported fiscal deficit in 2019/20 from £59.7bn to £55.8bn and in 2018/19 from £41.0bn to £38.8bn. There was a reduction of £12.7bn in the estimated deficit in the first four months of the current financial year from that reported last month primarily because of overestimating central government procurement in those months.

This article was originally published by ICAEW.
Magnox contract exit cost: a small price to pay?

16 September 2020: The National Audit Office has issued a report on the £20m cost of exiting the failed Magnox contract to decommission nuclear research sites and power stations.

The National Audit Office (NAO) report covers the handling by the Nuclear Decommissioning Authority (NDA) of the failed Magnox contract to decommission two nuclear research sites and 10 Magnox power stations and the estimated £20m cost incurred on exiting the contract.

The NDA is a statutory body established in 2005 to take ownership of the decommissioning programme for the UK’s oldest fleet of nuclear power stations and other nuclear facilities. At 31 March 2020, the NDA had an estimated liability of £135bn in its accounts for the costs of decommissioning still to be incurred.

The NDA has awarded a series of contracts to clean up nuclear sites and deal with radioactive materials, including fuel. This includes the 14-year Magnox contract awarded in 2014 to Cavendish Fluor Partnership (CFP) which the High Court decided was wrongly awarded, with the NDA agreeing a £97m settlement with a bidder in 2017.

The NDA then decided to terminate the contract with CFP nine years early, and an earlier report by the NAO stated how £122m had been lost by that point. The Public Accounts Committee reported in 2018 that the NDA needed to improve its understanding of the state of the sites, its ability to monitor work carried out on them, and the capability and expertise of its executive team.

Since 2017, a revised contract has been agreed with CFP and further litigation avoided, with £2.7bn of decommissioning work completed before the contract ended in August 2019.

The NAO says there have been further costs to the taxpayer, including an estimated termination cost of £20m to negotiate the early exit from the contract and incentivise a smooth handover of sites without further legal challenge. This is a relatively small amount in the context of the £6.9bn to £8.7bn estimated cost for decommissioning the Magnox sites.

The NAO report stated: “With the NDA now taking more direct control over the management of its sites, it will be critically important that it builds and retains better knowledge of the condition of its sites to enable it to plan and deliver decommissioning work efficiently and effectively. The NDA considers that it will be better placed to achieve this under its revised delivery model, but it is too early for us to assess the effectiveness of these arrangements.”

Martin Wheatcroft FCA, adviser to ICAEW on public finances, commented: “The huge sums being spent on decommissioning nuclear facilities can hide many sins, but we are fortunate that the National Audit Office is able to dig around and analyse what is going on.

“On this occasion, the £20m cost of exiting the Magnox contract appears a relatively small price to pay for a second chance at getting the decommissioning of the Magnox fleet right. There are much larger sums – in the billions – riding on the as-yet unproven new delivery model being put in place by the Nuclear Decommissioning Authority.”

Image of front cover of NAO report 'Progress report: Terminating the Magnox contract'. Click on the image to go to the NAO website to download the report.

This article was originally published on the ICAEW website.

ICAEW chart of the week: Fiscal interventions

10 July 2020: Fiscal interventions reach £190bn as the Chancellor Rishi Sunak pours even more money into the economy in an attempt to keep it from stalling.

Components of £190bn in fiscal interventions - as set out in text below.

The Chancellor’s summer statement is the subject of this week’s #icaewchartoftheweek, with the £30bn ‘plan for jobs’ being the latest in a series of fiscal interventions in response to the coronavirus pandemic.
 
The measures announced included £9bn for a £1,000 job retention bonus for furloughed workers, £4bn for work placements and boosting work searching, skills training and apprenticeships, a £5bn boost for the hospitality and leisure industries in the form of a cut in VAT and discounts on eating out, and £12bn in economic stimulus. The latter includes over £5bn on infrastructure projects (as announced by the Prime Minister last week), £3bn to make homes energy-efficient and £4bn for a temporary cut in SDLT on housing sales under £500,000.
 
This brings the total amount of fiscal interventions to £190bn or around 9% of GDP, once an extra £33bn in spending on health and other public services is incorporated. This was also ‘announced’ yesterday, albeit by means of a small footnote buried inside one of the accompanying documents!
 
As a consequence, the fiscal interventions can be broadly split between £77bn being spent on supporting household incomes (£54bn on the furlough scheme, £15bn on the self-employed income support scheme and £8bn on universal credit), £30bn to support businesses (£13bn in business rates and other tax reliefs and £17bn in grants and other support), £53bn for public services and other (£39bn on health and social care and £14bn on public services and other spending), and £30bn in economic stimulus through the ‘plan for jobs’.
 
Businesses have also benefited from support with their cashflows through the deferral of £50bn in tax payments and £73bn of loans and guarantees.
 
This is not the end of the story for fiscal interventions. Not only are there are a number of sectors such as local government, universities, and manufacturing where rescue packages may be needed, but the Chancellor made clear that this announcement only covered the second of a three-phase response.
 
The third phase – rebuilding the economy – will be set out later in the year. How much additional money will be involved is anyone’s guess.

This article was originally published by ICAEW.
ICAEW chart of the month: Cabinet government

26 June 2020: The prime minister has announced a reduction in the number of government departments. How big is the cabinet compared to the rest of the world?

The news that the UK Government is reducing the number of government departments by one prompts the #icaewchartofthemonth to take a look at the size of government executives across the world.
 
As the chart highlights, with 26 members, the UK cabinet is one of the largest amongst major economies – comprising the prime minister Boris Johnson, 21 department ministers and four ‘ministers attending cabinet’. This does not include the Cabinet Secretary or other officials, meaning that cabinet meetings generally involve more than 30 people in total.
 
Compare that with the more compact 16-member German federal cabinet (Chancellor Angela Merkel and 15 departmental ministers) and the ten-member Chinese state council executive (comprising the premier Li Keqiang, five vice-premiers and four other senior departmental ministers).
 
It is certainly much larger than FTSE-100 company boards, where the average size is 11, and very few listed companies have more than 16 board members.
 
There is some debate around whether reducing the size of the UK cabinet would be more conducive to effective government. Some suggestions that the merger of the Department for International Development (DfID) with the Foreign & Commonwealth Office (FCO) to form the new Foreign, Commonwealth & Development Office (FCDO) in September is the first step on the way to that goal – with further mergers possible. However, although there will be one fewer departmental minister, there is a reasonable prospect of the minister responsible for development at the FCDO being invited to attend cabinet given its importance to the government’s global agenda.
 
Of course, merging departments is not the only way to achieve a slimmer cabinet – for example, the 31-member Russian cabinet (not shown in the chart) rarely meets as one body. Instead, there are regular meetings of the 10-strong prime ministerial group (the prime minister Mikhail Mishustin and nine deputy prime ministers) and occasional meetings of the 20-strong cabinet praesidium that includes the most senior ministers as well.
 
The UK Cabinet also works in this way to a certain extent, with critical decisions often being made in smaller groupings of senior ministers, such as the 9-member National Security Council, the 9-member Climate Change Committee or the 12-strong EU Exit Operations Committee for example. Canada, with its 37-member cabinet, also operates through a series of cabinet committees ranging from around 8 to 15 members. However, in both cases, the full cabinet still meets regularly and remains the formal executive body for authorising government actions.
 
With rumours of a cabinet reshuffle in the UK this autumn, it will be interesting to see whether moves to reduce the size of the cabinet will actually take place or whether we will see further development of cabinet committees as the places to be ‘in the room where it happens’.

This chart of the month was originally published by ICAEW.

ICAEW chart of the week: borrowing to exceed half a trillion pounds

29 May 2020: Government looks to financial markets to fund large-scale fiscal interventions in the economy.

The #icaewchartoftheweek shines a light on the massive expansion in borrowing being undertaken by the UK Government as it seeks to plug an expanding gap between tax receipts and spending and fund a huge amount of loans to banks and businesses in order to try and keep the economy from collapsing.

At the Spring Budget on 11 March, HM Treasury issued a financial remit to the Debt Management Office and National Savings & Investment amounting to £162bn, comprising £98bn to fund the repayment of existing debts, £55bn to fund a planned shortfall between tax receipts and public spending (the deficit), and £9bn to fund public lending to individuals and businesses.

Since then the fiscal situation has transformed, with the Office for Budget Responsibility (OBR) suggesting that the deficit could increase by as much as £243bn to £298bn in 2020-21, while lending activities could increase by a further £168bn to £177bn. Public sector net debt at 31 March 2021 might increase by £411bn from the Spring Budget forecast of £1,819bn to £2,230bn.

The good news is that the cost of this borrowing is relatively small, with yields on ten-year gilts as low as 0.20%.

To find about more about the global and UK fiscal crisis read the ICAEW Fiscal Insight on coronavirus and public finances.

ICAEW chart of the week: UK gilt issues

1 May 2020: The unsung heroes at the Debt Management Office (DMO) have swung into action as the UK Government has started to burn through cash at an astonishing rate, as illustrated by the #icaewchartoftheweek.

Chart. Cash raised 2019-20: £10bn, £10bn, £10bn, £13bn, £8bn, £12bn, £12bn, £12bn, £10bn, £13bn, £12bn, £15bn. Cash raised 2020-21: April £58bn.

The DMO, the low-profile unit within HM Treasury responsible for the national debt, raised an astonishing £58bn from selling gilt-edged government securities in April, compared with an average of £11bn obtained each month in the financial year to March. The size and frequency of gilt auctions went from an average of £2.6bn from one auction a week in 2019-20 to £3.2bn from four auctions a week in April.

The scale of the challenge became apparent in March as the Government announced a series of eye-watering fiscal interventions, with the DMO going overdrawn by £18.5bn to keep the Government supplied with cash in advance of ramping up gilt auctions in April.

Fortunately, the DMO is able to finance the Government at ultra-low rates of interest at the moment, with auctions oversubscribed and yields on 10-year gilts at just over 0.3% during the course of April. If maintained, the incremental cost of the additional £384bn in public sector net debt in 2020-21 set out by the Office for Budget Responsibility in its coronavirus reference scenario would be less than £2bn a year.

A legacy of debt for future generations to deal with, but – at least for now – a relatively cheap burden to service.

This chart of the week was originally published by ICAEW.

ICAEW chart of the week: deficit and debt

17 April 2020: The #icaewchartoftheweek is on the ‘coronavirus reference scenario’ put together by the Office for Budget Responsibility (OBR).

Fiscal deficit 2020-21: £55bn Budget 2020 + £130bn lower receipts +£88bn higher spending = £273bn. Net debt: £1,819bn Budget 2020 +£384bn more borrowing = £2,203bn.

It suggests that the deficit for the current fiscal year could end up somewhere in the region of £273bn, around five times as much as the official Spring Budget forecast of £55bn, while public sector net debt could exceed £2.2tn by 31 March 2021, £384bn more than previously expected.
 
This scenario, which the OBR stresses is not a forecast, is based on a three-month lockdown followed by restrictions for a further three months, resulting in a 35% contraction in the economy in the second quarter of 2020, before bouncing back relatively quickly to leave the economy 13% smaller in 2020 than in 2019.
 
Once the crisis has passed and policy interventions have unwound, the OBR thinks that annual borrowing could return to roughly the Spring Budget 2020 forecast. However, net debt would continue to be much higher, potentially £260bn (10% of GDP) more than the baseline forecast by 31 March 2025.
 
This is only of one many potential scenarios, but what is clear is that whatever actually happens, the damage to the public finances from the coronavirus pandemic will be extremely severe.
 
We can (and will) worry about the bill later, when the need for a long-term fiscal strategy to put the public finances onto a sustainable path will be more important than ever before.

This chart was originally published by ICAEW.

OBR: deficit could reach £273bn or more

15 April 2020: a report from the Office for Budget Responsibility (OBR) indicates that the fiscal deficit could increase to £273bn in 2020-21, but it cautions that this is only one of many plausible scenarios.

The OBR has produced its first analysis of the potential economic and fiscal impact of the coronavirus, based on a three-month lockdown followed by restrictions for a further three months. 

At the same time, the International Monetary Fund has warned that the global economic contraction underway is likely to be the worst since the Great Depression, dwarfing the financial crisis twelve years ago.  

In its ‘coronavirus reference scenario’, the OBR indicates that the UK economy could fall by 35% in the second quarter of 2020, before bouncing back to leave the economy 13% smaller in 2020 than in 2019. 

The consequence would be an increase in the deficit for the fiscal year ending 31 March 2021 to £273bn or 14% of GDP, while public sector net debt could be £384bn higher than budgeted for, reaching £2.2tn or 95% of GDP by the end of the fiscal year.

The OBR says that the economic impact of the coronavirus will derive much less from people falling ill or dying, than from the public health restrictions and social distancing required to limit its spread, severely reducing demand and supply at the same time. That means lower incomes, less spending and weaker asset prices, all of which reduce tax revenues, while job losses will raise public spending.

Once the crisis has passed and policy interventions have unwound, the OBR thinks that annual borrowing could return to roughly the Spring Budget 2020 forecast. However, net debt would continue to be much higher, potentially £260bn (10% of GDP) more than the baseline forecast by 31 March 2025. 

The OBR analysis assumes that increased public spending, tax cuts and holidays, loans and guarantees, and actions taken by the Bank of England, designed to support household incomes and to limit business failures and layoffs, will help prevent greater economic and fiscal damage in the long term. However, it warns that the longer the disruption lasts, the more likely it is that the economy’s future potential output will be ‘scarred’ with adverse consequences for future deficits and for fiscal policy.

The International Monetary Fund (IMF) now predicts that the global economy will contract by 3.0% in 2020, much worse than the 0.1% contraction seen during the financial crisis in 2009 and a cut of 6.3% from its previous prediction in January. The IMF prediction is based on a shallower, but longer recession than the OBR’s scenario for the UK. Overall, the IMF believes that the cumulative output loss in 2020 and 2021 from the pandemic could be as much as $9tn.

Alison Ring, Director, Public Sector for ICAEW, commented: “The analysis published by the OBR is not a forecast, but the scenario it presents is pretty startling; making clear that whatever actually happens, the damage to public finances from the coronavirus pandemic will be extremely severe.

“While the OBR suggests that the economy and tax receipts could recover relatively quickly, the additional debt burden will weigh on the public finances for many years for come.”

Fiscal deficit 2020-21: £55bn Spring Budget +£130bn lower receipts +£88bn higher spending = £273bn Reference scenario.  Net debt: £1,819bn +£384bn = £2,203bn.

This article was originally published by ICAEW.
ICAEW chart of the week: Public sector employment

Headcount / FTEs - Health and social work: 1,925,000 / 1,657,000; Education 1,500,000 / 1,105,000; Public administration 1,056,000 / 897,000; HM Forces and Police: 402,000 / 391,000; Other 505,000 / 464,000.

The #icaewchartoftheweek is about public sector employment, illustrating how just under 5.4m people work for public bodies in the UK or around 4.5m full-time equivalents (FTEs). This is 16.5% of the total UK workforce of 32.8m as of last September on a seasonally-adjusted basis.

The largest employer in the public sector is the NHS, with a headcount of 1.7m out of the 1.9m who work in the health and social work sector (1.5m FTEs). Included in the million or so people who work in public administration is the 451,000-strong Civil Service (419,000 FTEs) with most of the remaining 605,000 working for local authorities and non-departmental public bodies (FTEs 478,000).

Total public sector headcount has started to increase again in recent years with NHS and non-NHS headcount up 6.8% and 0.6% respectively over a nadir of 5.2m three years ago (up 2.5% overall), compared with an increase of 3.8% and a fall of 12.1% respectively over the previous seven years (down 7.8% overall between September 2009 and December 2016).

With increasing demand on the NHS from more people living longer and the ‘end of austerity’ we should expect to see further increases in public sector employment over the next few years.

ICAEW chart of the month: UK international trade

Imports £718bn: EU £369bn, EFTA £34bn, USA £87bn, Other Americas £26bn, Asia-Pacific £138bn, Other £64bn. Exports £673bn: EU £297bn, EFTA £29bn, USA £133bn, Other Americas £29bn, Asia-Pacific £108bn, Other £77bn.

With recent changes in ICAEW communications, the ICAEW Public Sector team has started an #icaewchartofthemonth to complement the #icaewchartoftheweek.

The first #icaewchartofthemonth was published on the ICAEW’s Insights Hub (icaew.com/insights) on Friday 31 January 2020 and is on the UK’s international trade. It highlights how important the £718bn in imports and £673bn in exports in the year to 30 September 2019 are to the economy of the UK.

As the UK Government starts to negotiate new trade arrangements with countries around the world, the EU will be the highest priority. Imports into the UK of £369bn represent 51% of total imports and exports to the 27 EU countries of £297bn are 44% of total exports. This is followed by the USA, where imports of £87bn and exports of £133bn represent 12% and 20% respectively.

Trade relationships with countries in the Asia-Pacific region will also be very important, in particular China (imports £60bn and exports £39bn), Japan (£17bn and £15bn) and the 10-country Association of South East Asian Nations (£22bn and £19bn).

https://www.icaew.com/insights/features/2020/jan-2020/uk-international-trade