GDP statistics have become much more exciting, with low but steady growth in per capita GDP before the pandemic giving way to large swings as the economy adjusts to a major shock.
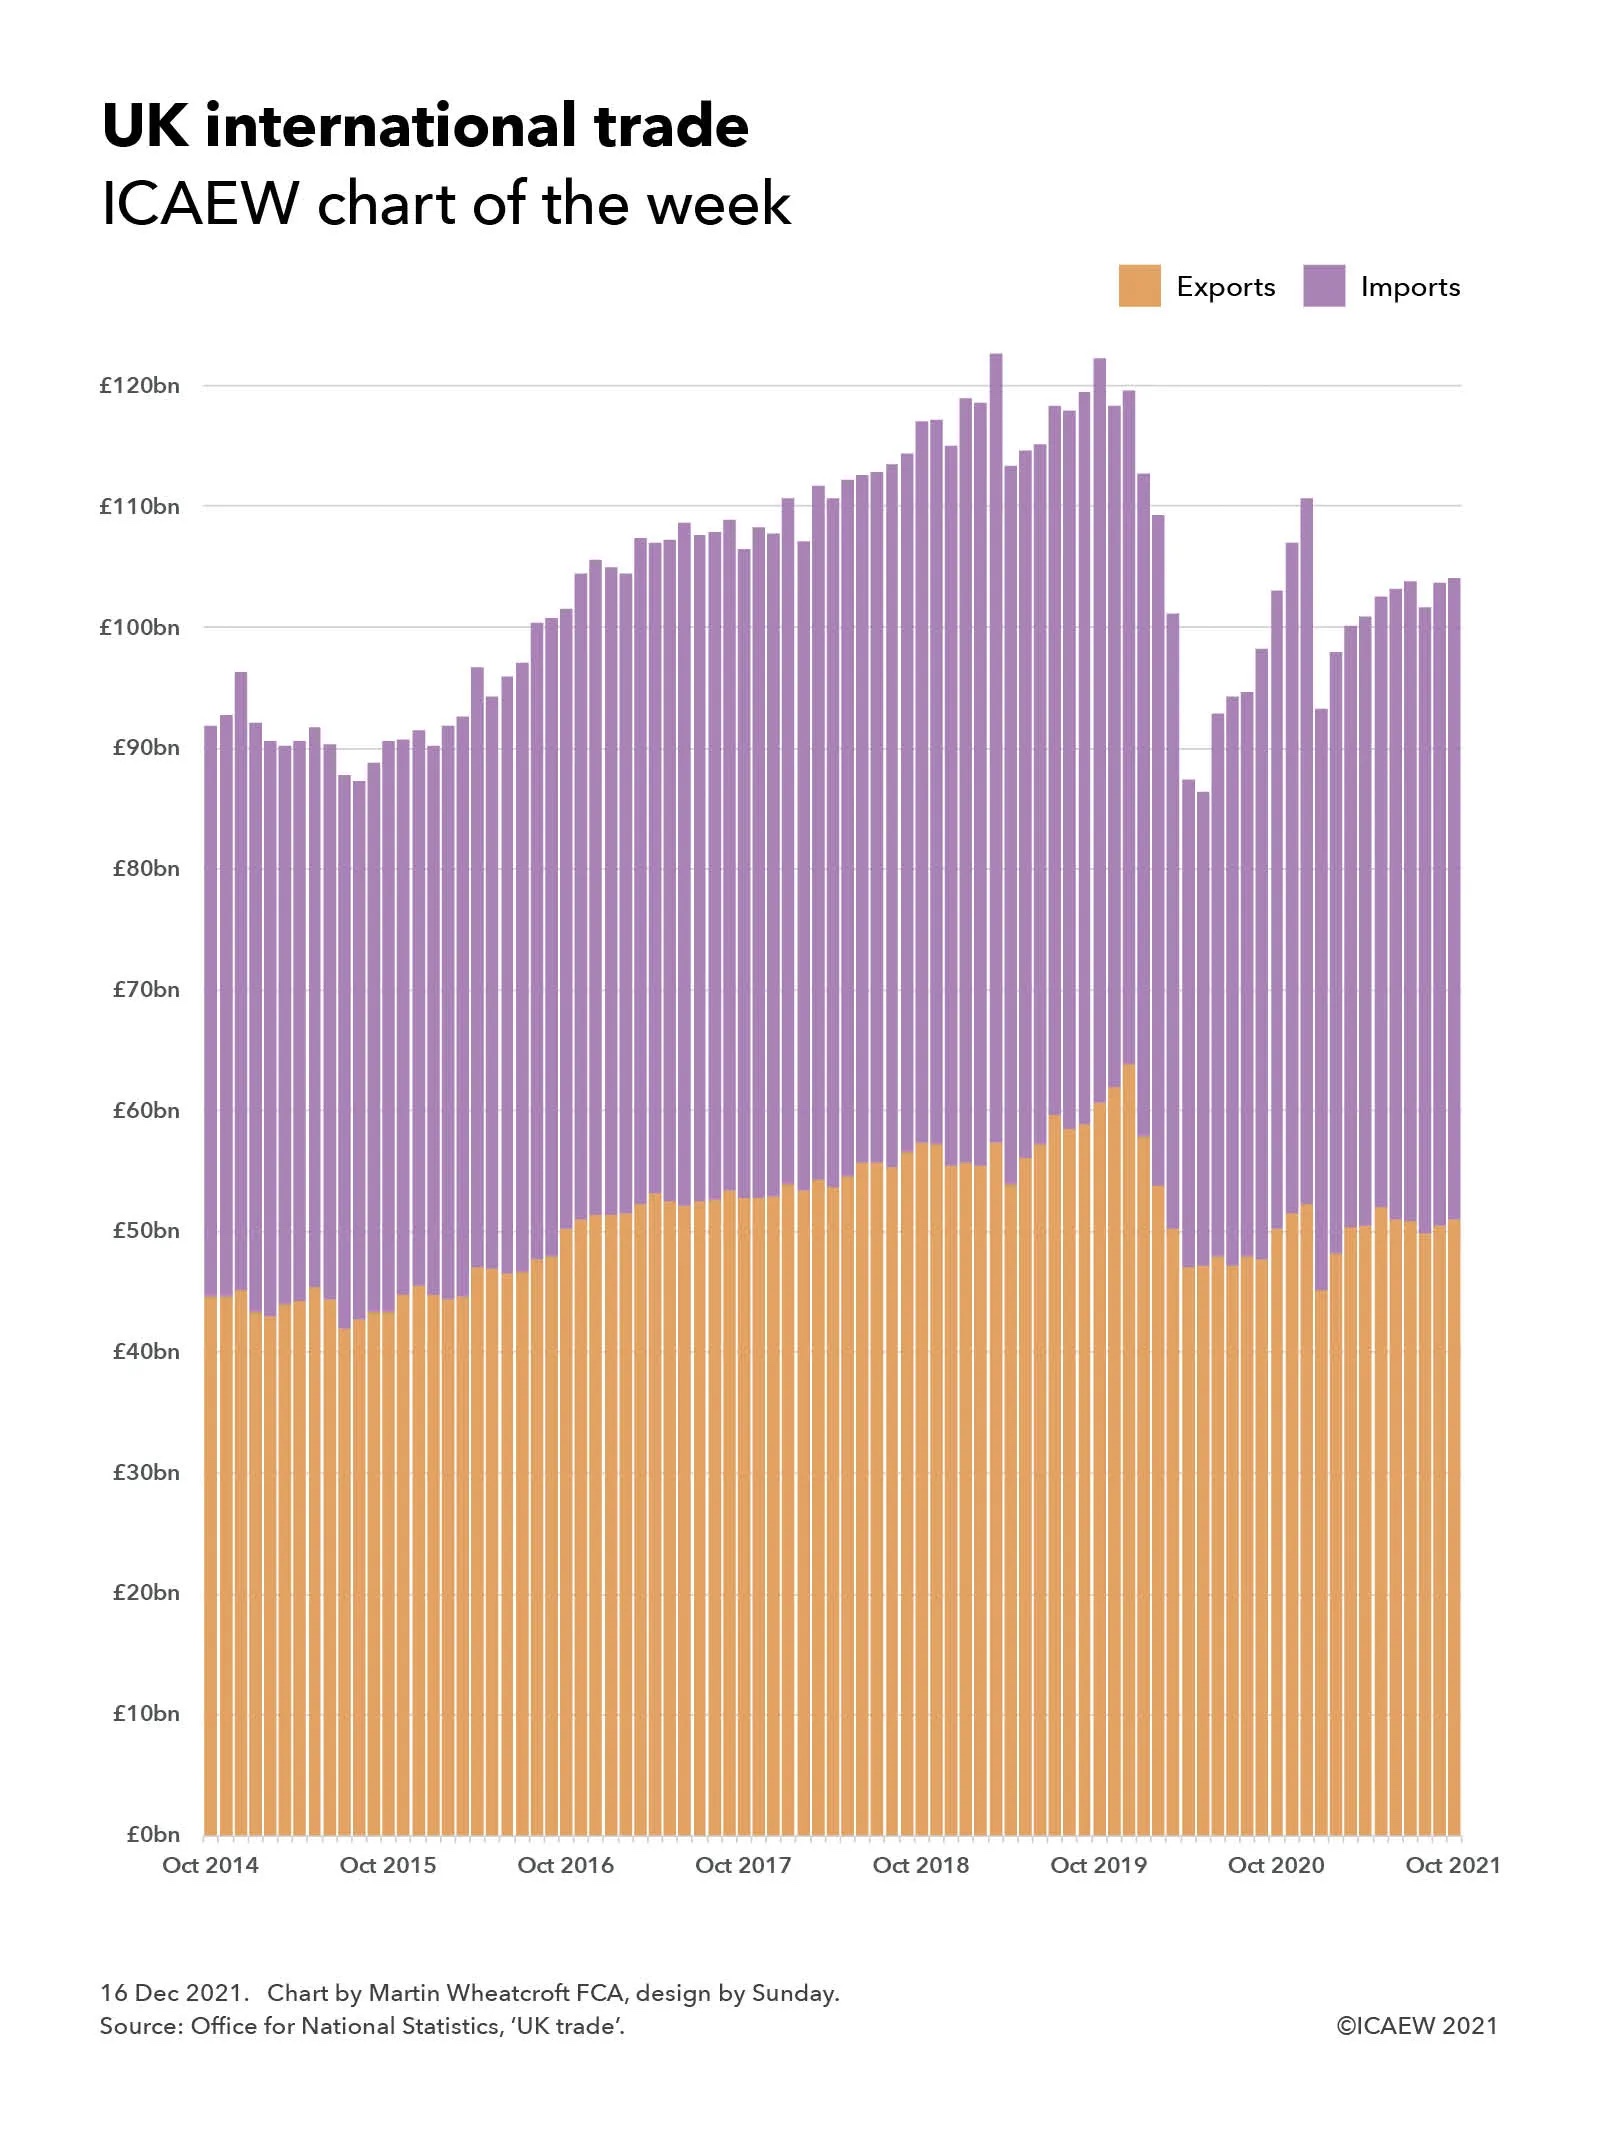
GDP for the fourth quarter of 2021 was calculated to be £596bn by the ONS in its first estimate of this statistic measuring economic activity in the UK, bringing the provisional estimate for the full year to £2,318bn for the 2021 calendar year. On a per capita basis, this was equivalent to approximately £8,820 per person for the fourth quarter and £34,330 per person for the year.
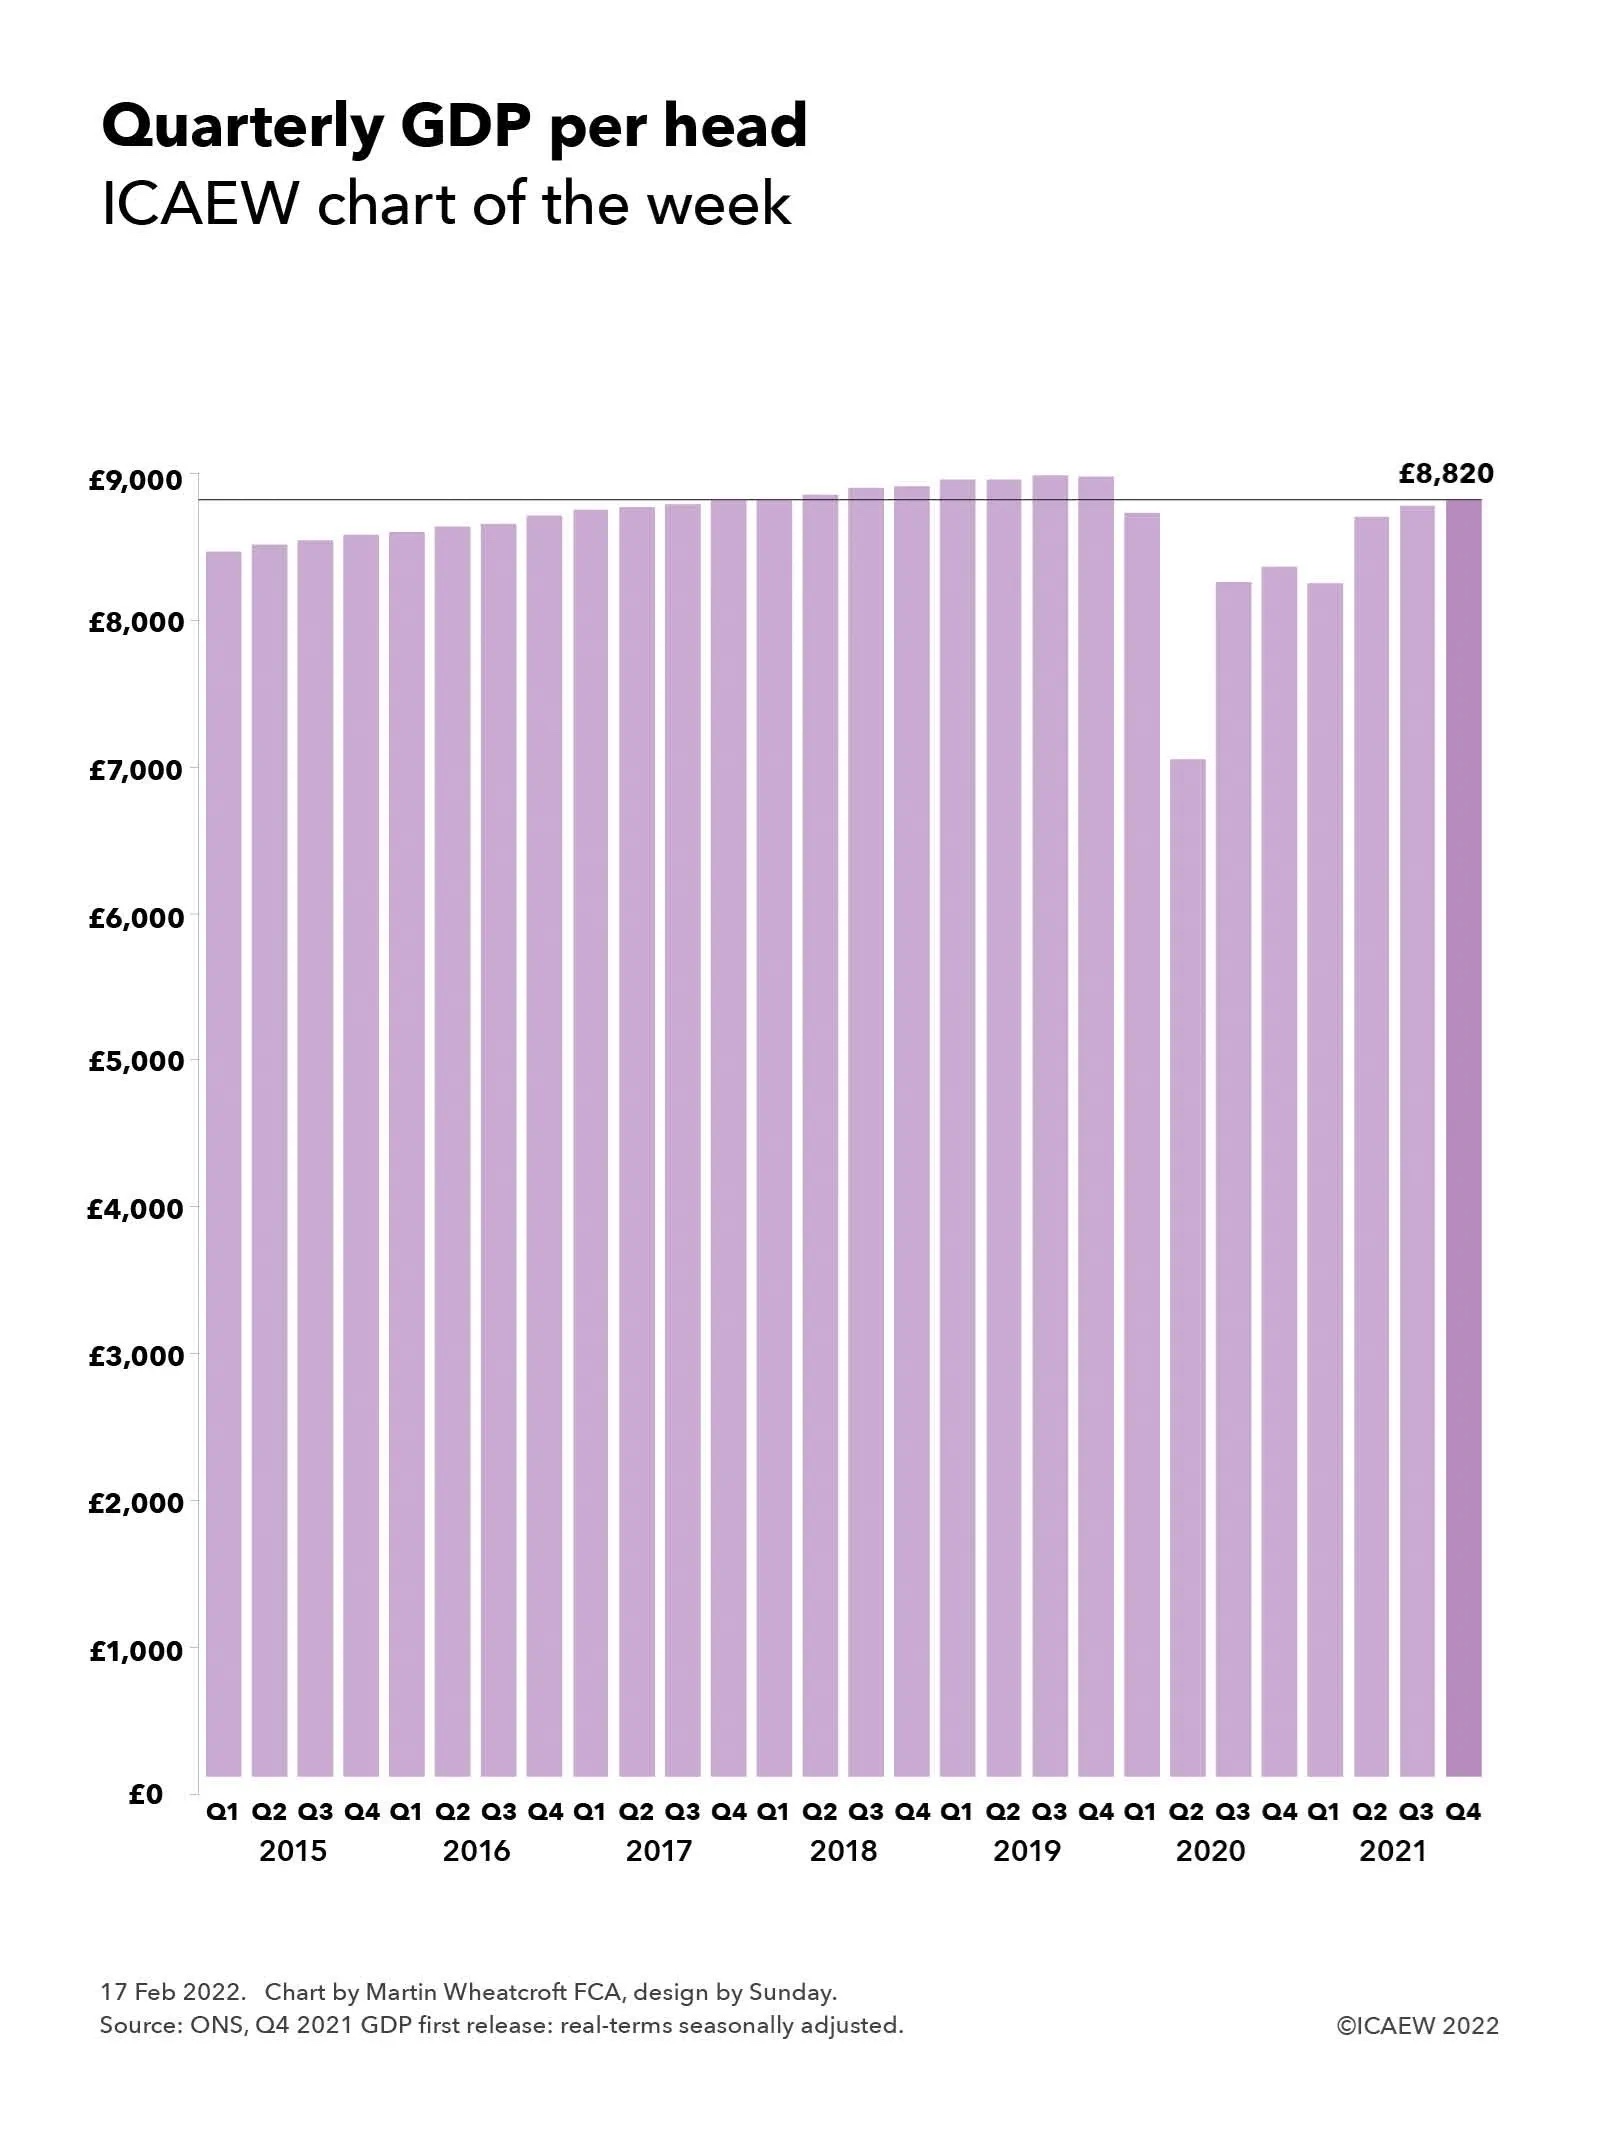
The ICAEW chart of the week looks at how quarterly GDP has changed in real-terms over the past few years on a seasonally adjusted basis – demonstrating how boring GDP statistical releases were in the ‘before times’. Then, a relatively steady average per capita increase of approximately 0.3% each quarter reflected the low but steady level of economic growth that has been seen since the financial crisis. The arrival of the pandemic has seen all that change, with a collapse in GDP during the last half of 2020, followed by a stop-and-start recovery over the past few quarters, with provisional GDP estimate growing by 0.9% in the fourth quarter – faster than the pre-pandemic years, but slower than the revised 1.0% reported for Q3 and the 5.5% rise in Q2 of 2021.
The change in real-terms quarterly GDP per head in 2020 and 2021 illustrated by the chart were -2.7%, -19.5%, +17.4%, +1.3% and -1.3%, +5.5%, +1.0%, +0.9% respectively. It is, of course, always important to note that the statistics reported by the ONS are subject to frequent revision, especially when trying to count up the trillions of transactions entered into each quarter in a large and complex economy like the UK’s. The population estimates used for calculating per capita amounts are also likely to be revised, in particular once the results of the 2021 census are finalised in a few months’ time.
Despite the recovery in the last three quarters, GDP and GDP per capita remained below their peaks in the third quarter of 2019 and more significantly below the trend the economy was on.
With rapidly rising inflation, supply chain disruptions and uncertainty regarding how society will transition from a coronavirus pandemic to an endemic, the likelihood is that quarterly GDP releases are likely to continue to be observed with some excitement by economists (and the rest of us) for some time to come.