Tax plans brought forward as Chancellor Rishi Sunak seeks to limit spending commitments and build fiscal headroom ahead of the Autumn Budget.
Inflation dominated the Spring Statement as the Chancellor added to his support package for households and businesses facing rapidly rising prices but held off giving any extra money for public services.
Despite a major tax cut from raising National Insurance thresholds, the OBR estimates that the measures announced by the Chancellor for the coming financial year will offset around a third of the fall in living standards. This will leave household budgets to take most of the strain of the rapidly rising prices, with the potential that the government will need to intervene again later in the year as the impact becomes clearer.
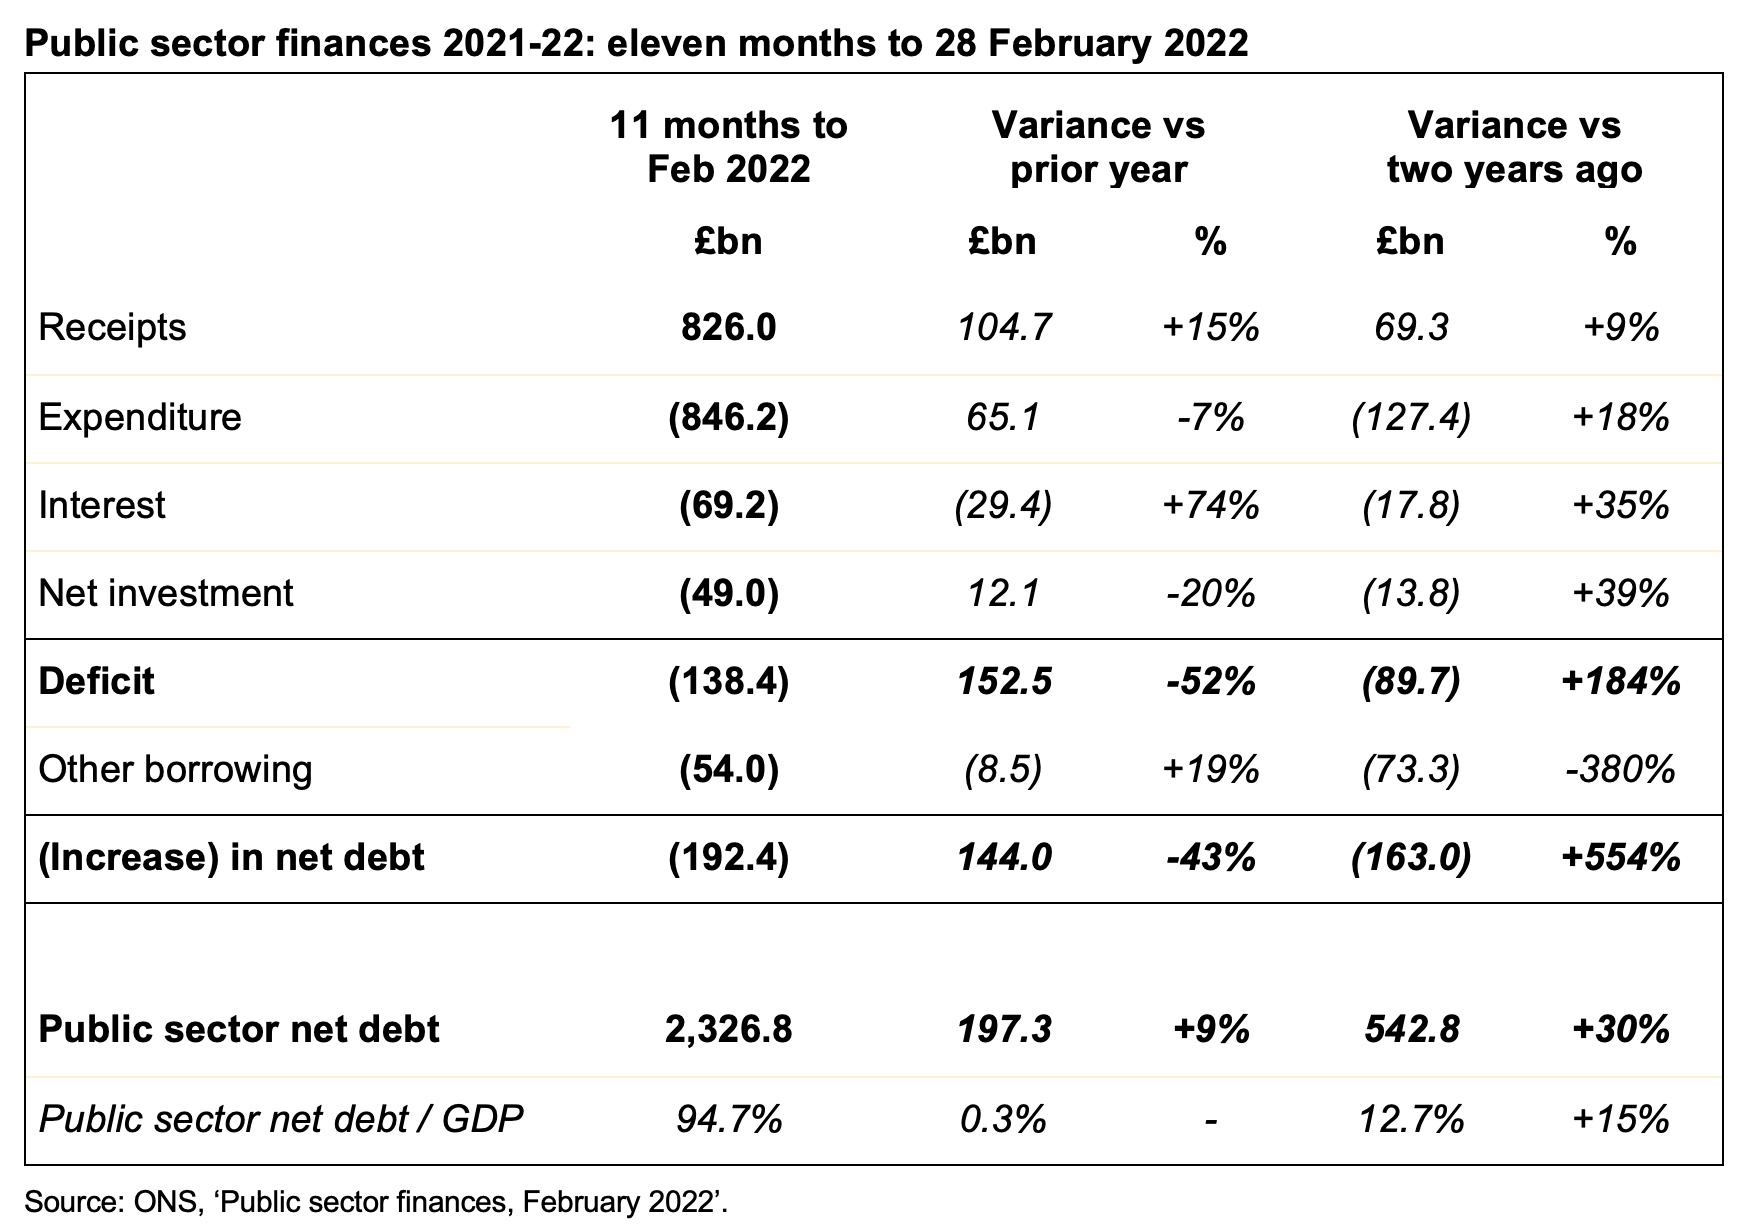
The biggest individual change in the government’s spending plans is the bill for interest on central government debt, which increases from £24bn in 2020/21 to £54bn this year and a forecast of £83bn for 2022/23. This is the biggest driver of an increase in the forecast deficit for next year from last October’s forecast of £62bn to a revised forecast of £99bn, despite an £11bn boost from restructuring the system for student loans that could see graduates paying back their loans almost up until retirement.
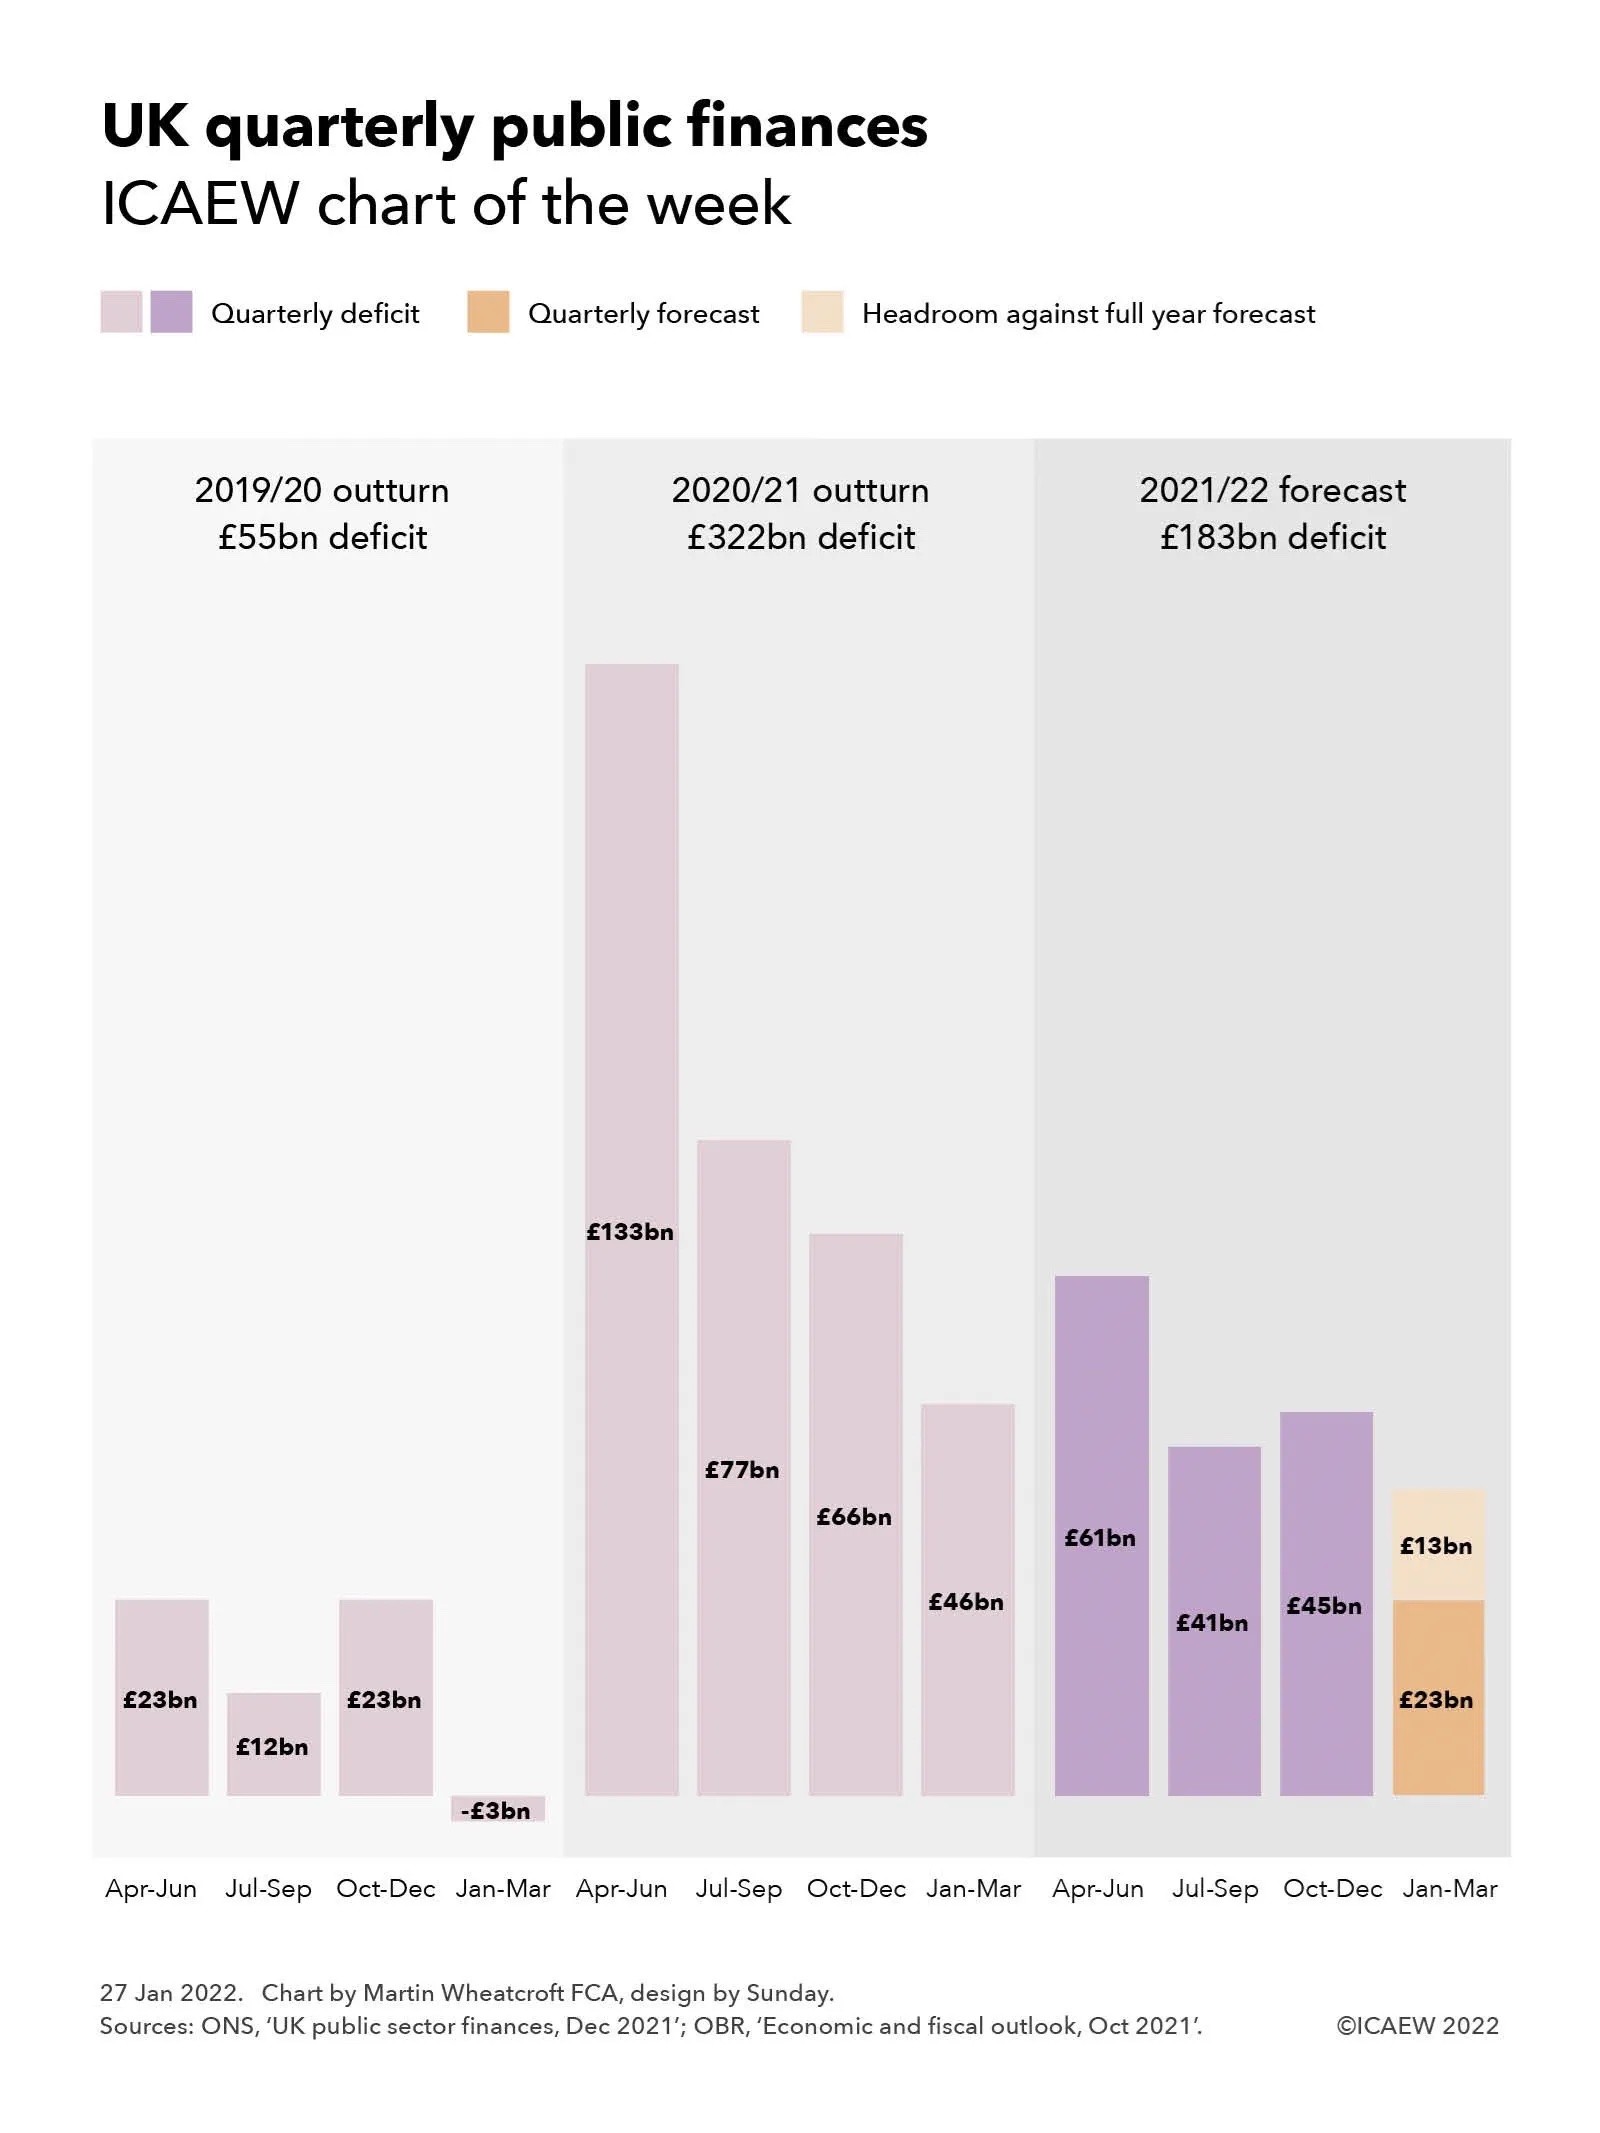
Despite the increase in the coming financial year, the OBR expects the deficit in the rest of the forecast period to be lower than before, with the projected deficits in the subsequent four years up to 2026/27 down from £62bn, £46bn, £46bn and £44bn to £50bn, £37bn, £35bn and £32bn – a net improvement of £11bn a year on average.
Higher tax receipts are the primary driver of a reduced forecast for public sector net debt at 31 March 2027 of £2,480bn, down from a previous forecast of £2,567bn, but still £687bn higher than the £1,793bn at 31 March 2020. The impact on the debt-to-GDP ratio is greater, with lower cash outflows and higher GDP driven by inflation combining to reduce the ratio from a previous forecast of 88% in 2027 to 83%, reversing a significant proportion of the increase caused by the pandemic.
The OBR calculates that the Chancellor has about £30bn of headroom against his fiscal targets, giving him more capacity to provide additional support for households and businesses later in the year if he thinks it necessary. Given the uncertainties surrounding the potential impact of Russia’s invasion of Ukraine on the UK economy, it is perhaps understandable for Rishi Sunak to want to accelerate the reduction in debt in relation to the size of the economy and build greater fiscal resilience. However, he will be conscious of the risk of a recession if households cut back their spending in the domestic economy by too much.
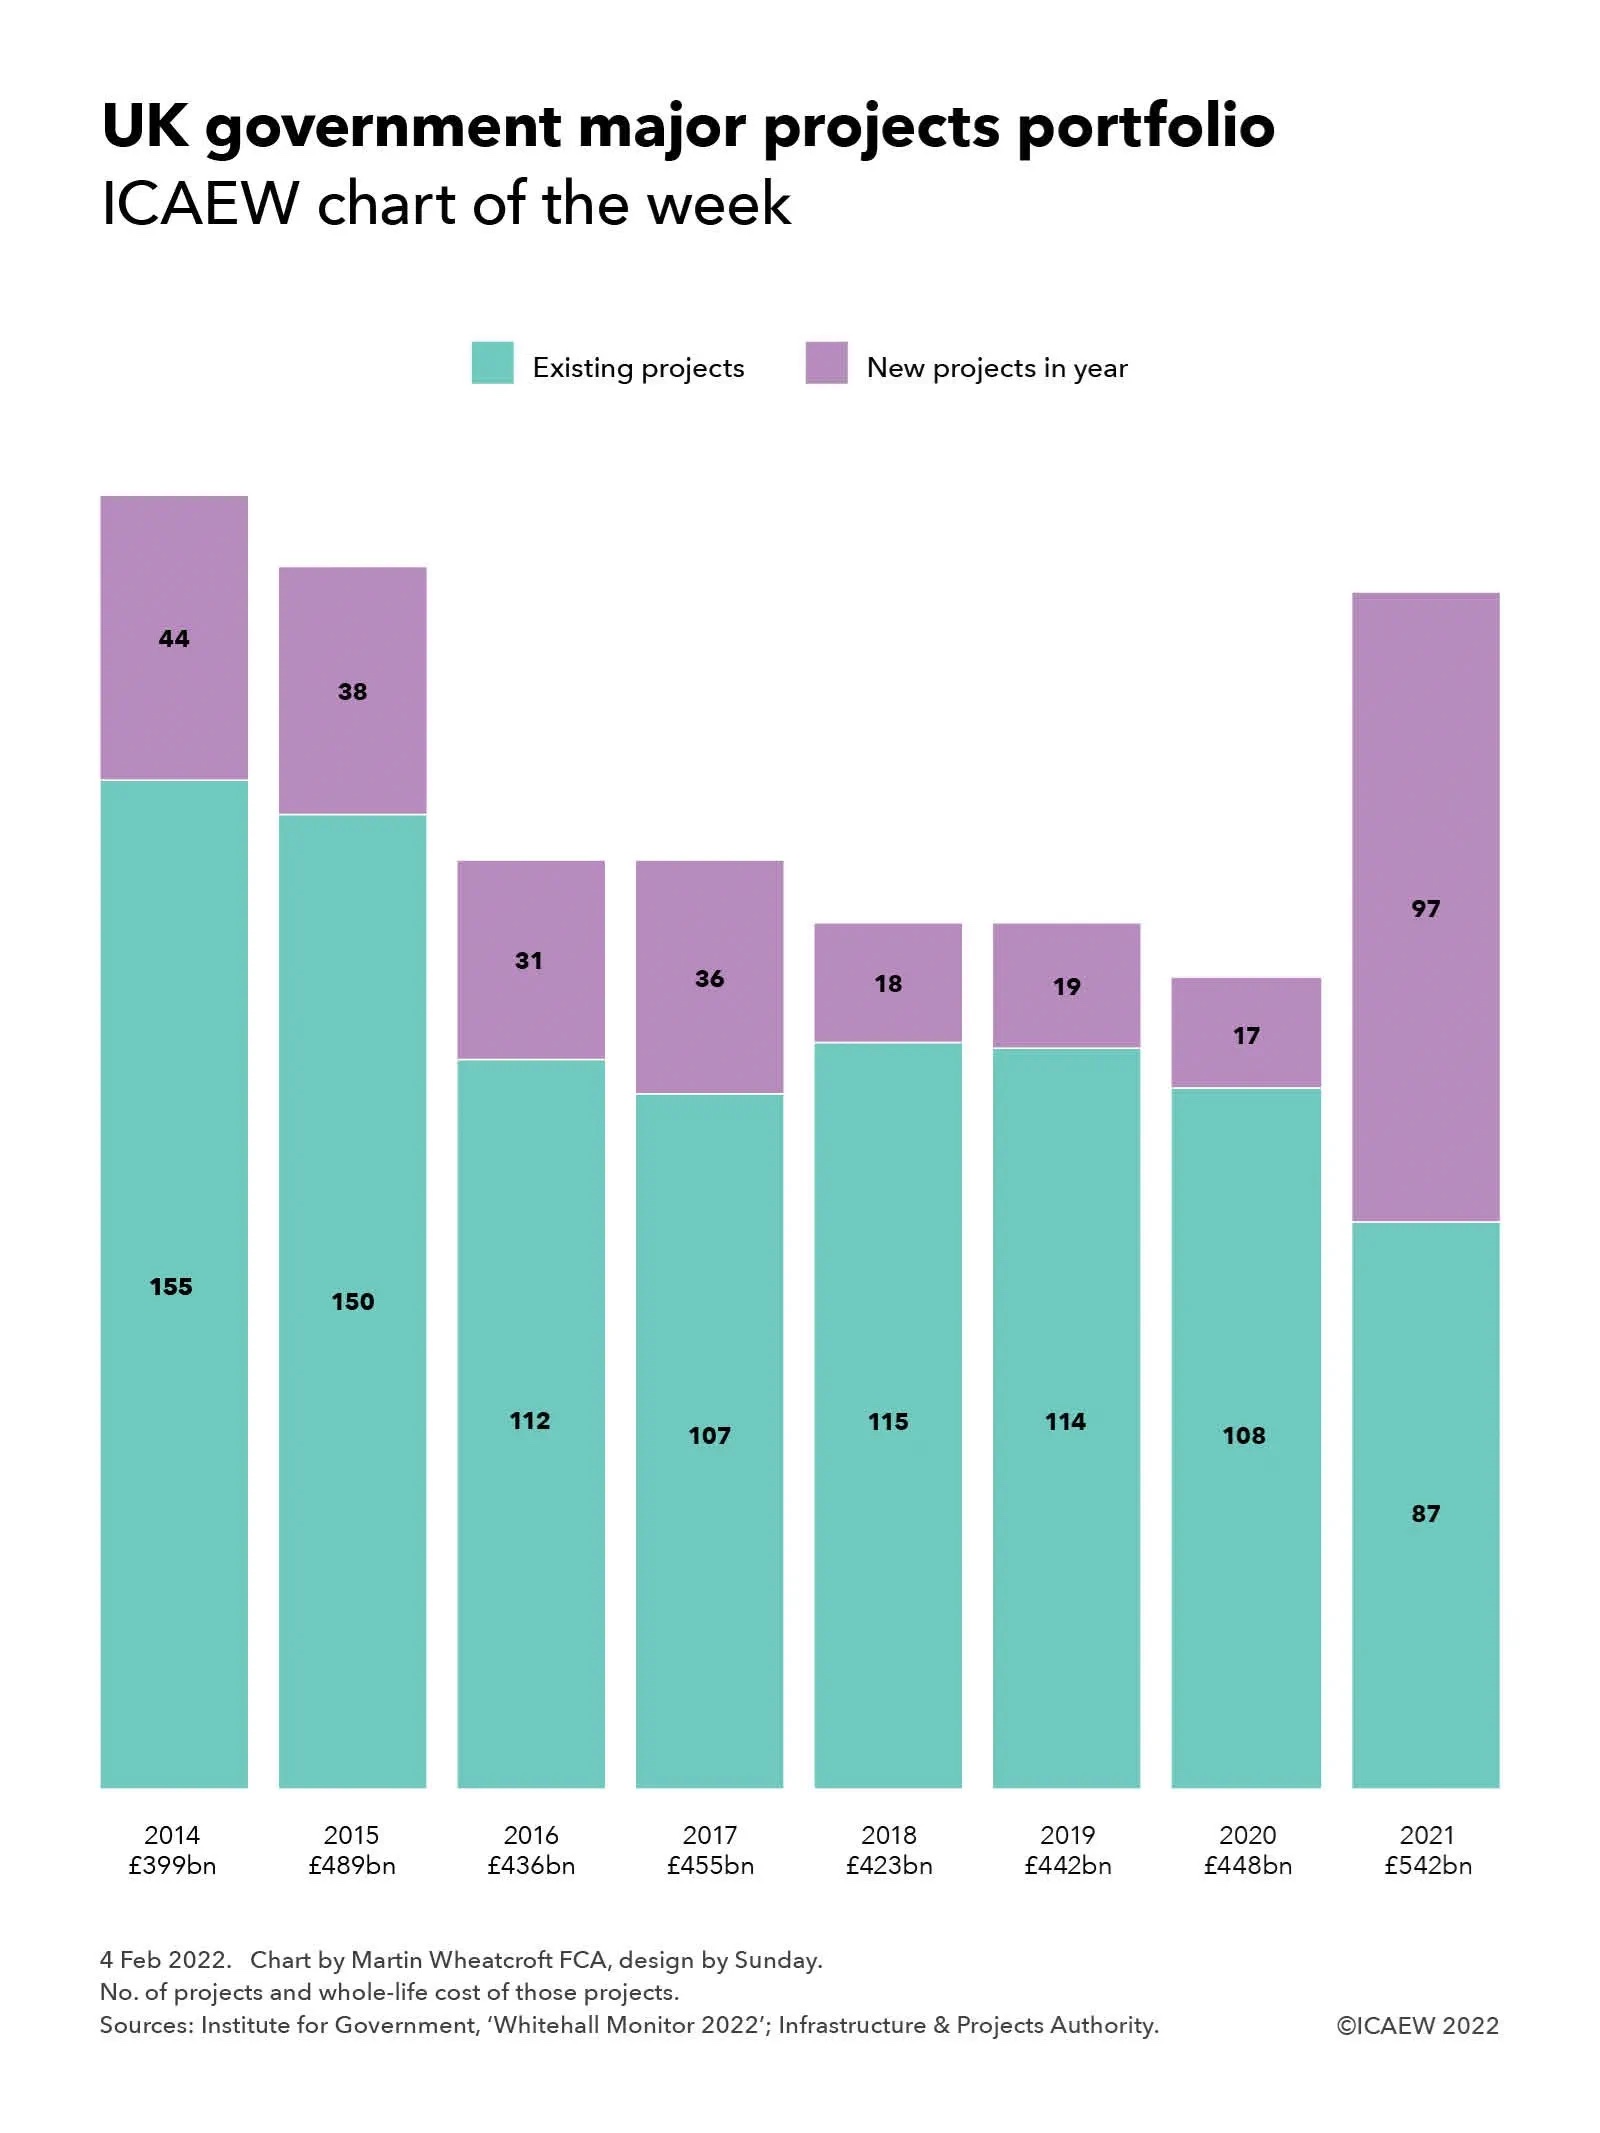
Other than some welcome additional funding to tackle fraud, there was no significant additional funding for departments or local authorities who will need to stick within their original budgets set by the three-year Spending Review announced last October. This could result in ‘unplanned austerity’ as they seek to find savings to offset rising costs, in particular the government’s capital investment plans, where the cost of building infrastructure is likely to increase significantly, potentially jeopardising priorities such as levelling up.
Alison Ring, Director of Public Sector and Taxation, commented: “The story of the Spring Statement is inflation, which is driving a sharp fall in living standards and is causing the interest bill on public debt to multiply. The government has responded with a package of measures that the OBR estimates offset about a third of the decline, but this still leaves household budgets exposed to the effect of rapidly rising prices. The Chancellor’s focus on building up fiscal resilience suggests he may be trying to preserve some firepower for possible further interventions later in the year.
“With public finances in a better shape than previously forecast, the Chancellor will hope that he is going to be able to make good on his pledge to cut income tax in 2024.”