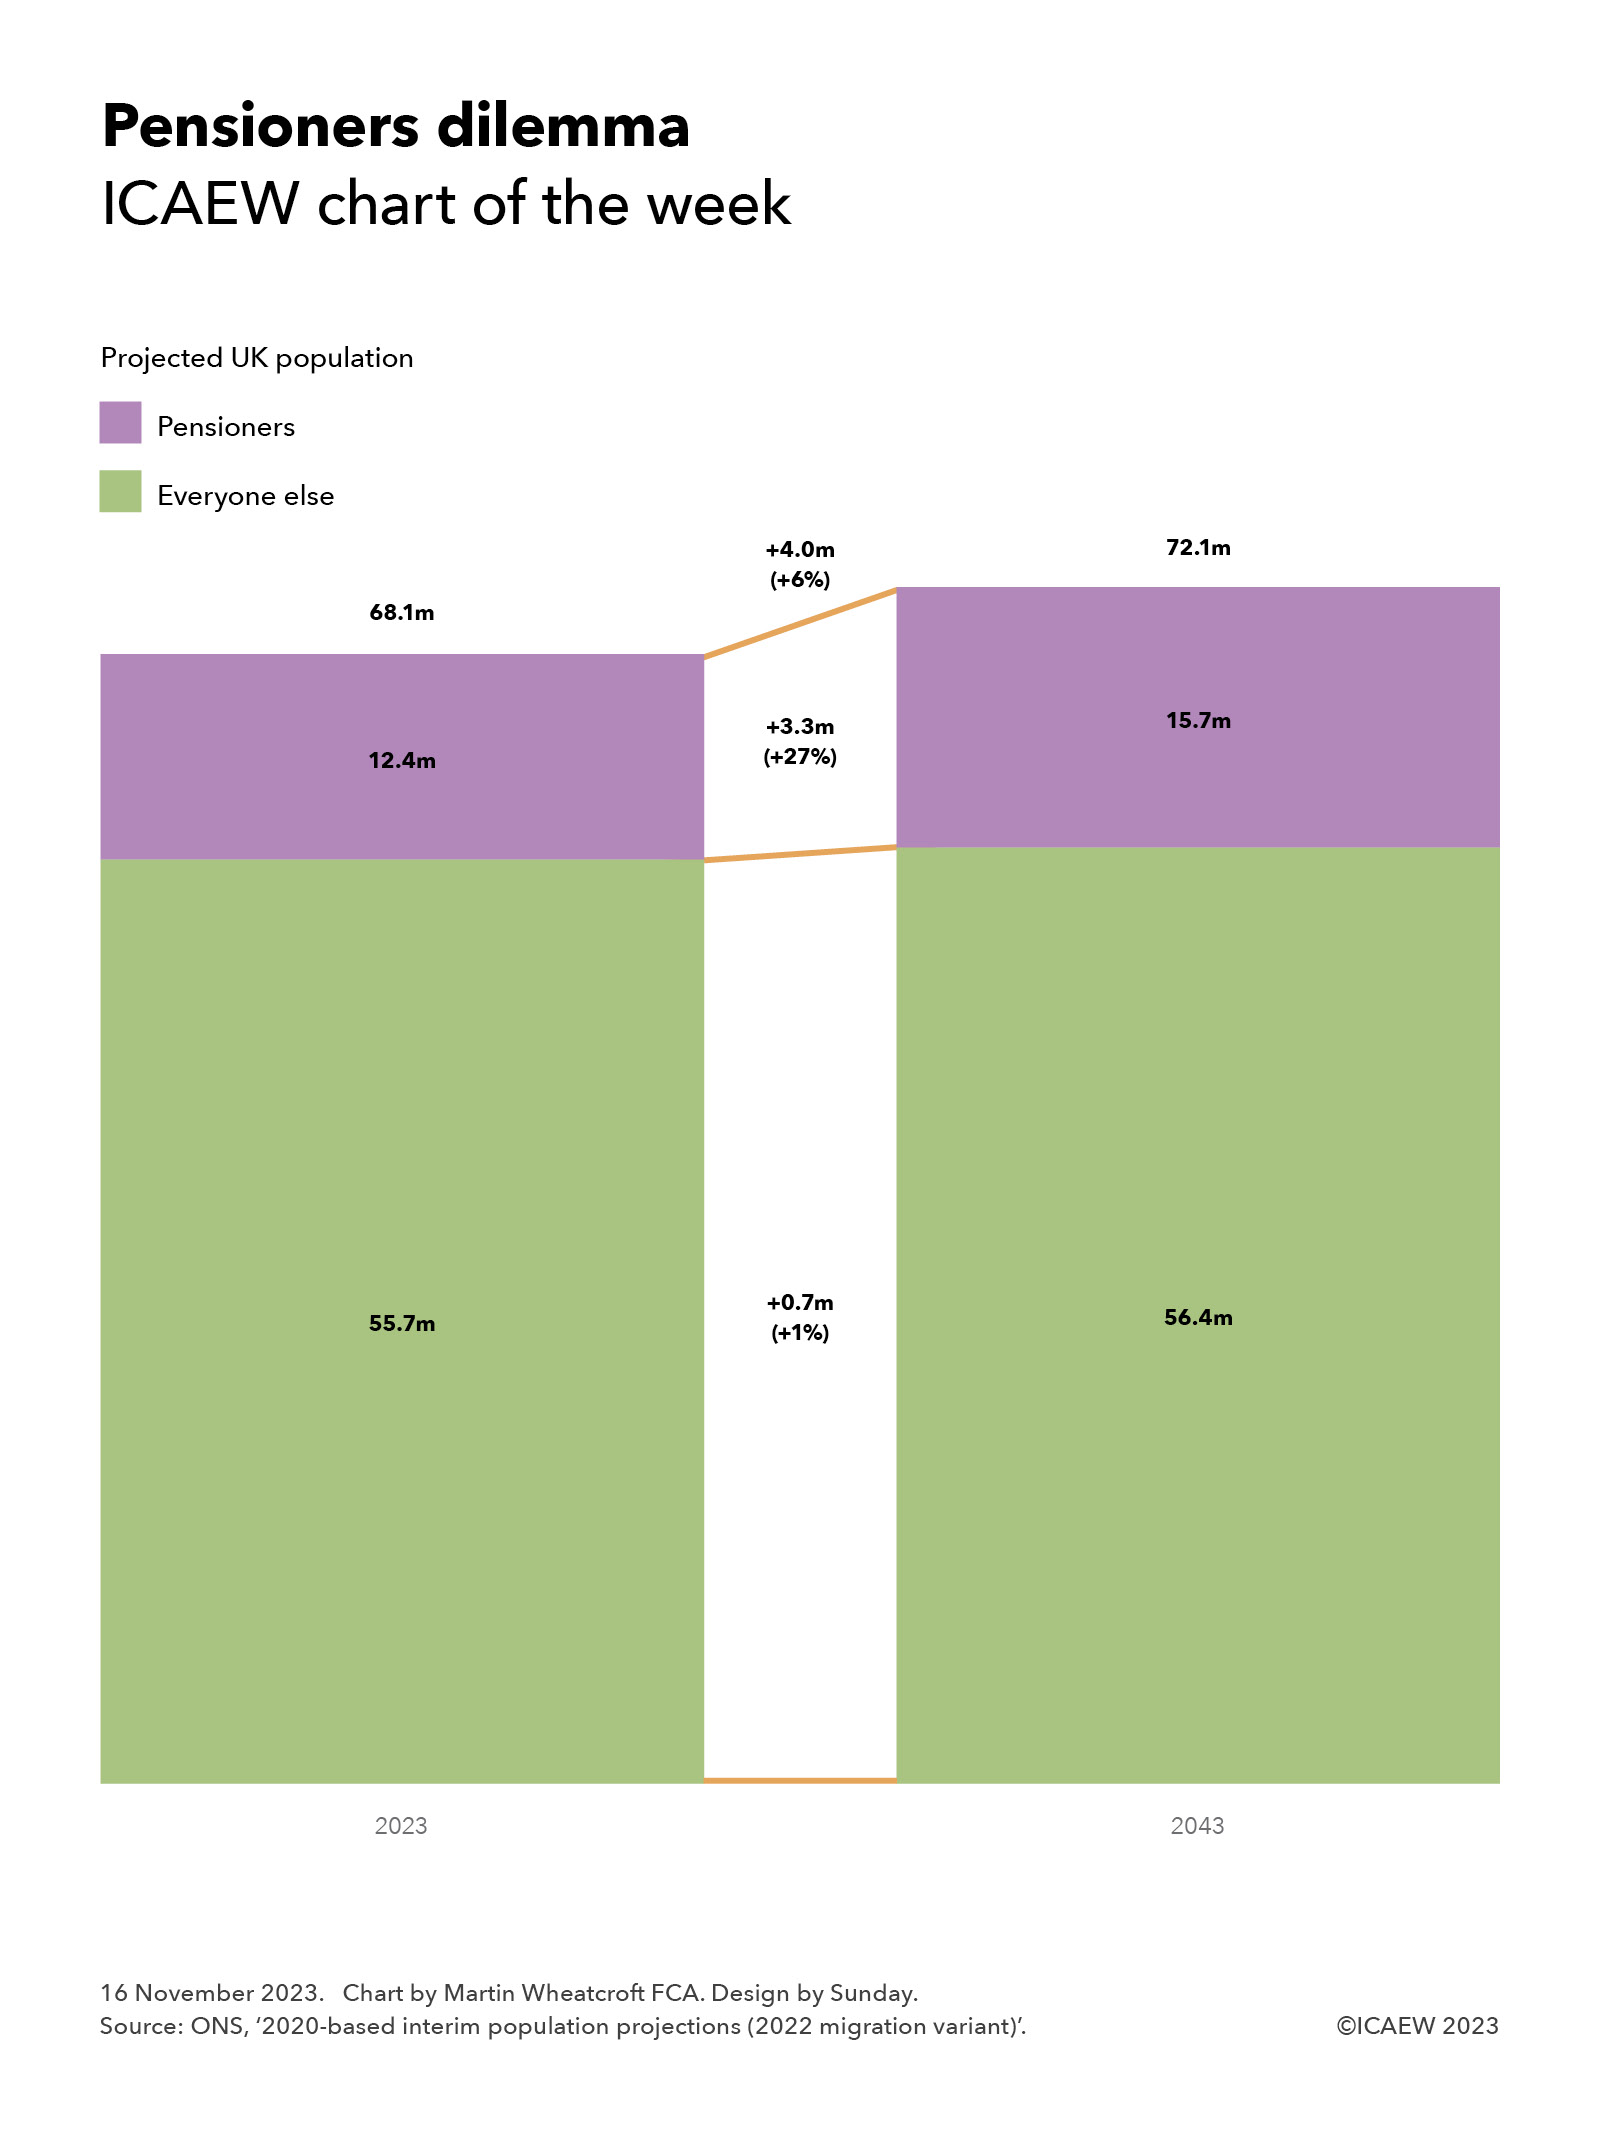
Economic storm clouds darken outlook for public finances

A slightly higher fiscal deficit for May and rising interest rates provide no comfort for the Chancellor as he considers how to respond to public sector wage demands.

The monthly public sector finances released on Thursday 23 June 2022 reported a provisional deficit for the month of May 2022 of £14.0bn, an improvement from this time last year, but still £8.5bn higher than May 2019, the year before the pandemic.

Public sector net debt increased by £21bn from £2,342bn at the end of March 2022 to £2,363bn or 95.8% of GDP at the end of May. This is £570bn higher than 31 March 2020, reflecting the huge sums borrowed over the course of the pandemic.

The deficit reported for the two months to May 2022 of £35.9bn was an improvement of £6.4bn from the deficit of £42.3bn reported for the months of April and May 2021, and £64.2bn better than the £100.1bn reported for April and May 2020. However, it was £19.8bn worse than the pre-pandemic deficit of £16.1bn for the two months to May 2019.

Tax and other receipts in the two months amounted to £147.5bn, £12.4bn or 9% higher than a year previously. This included higher income tax receipts from wage increases and bonuses as well as the new higher rate of national insurance, as well as higher VAT receipts driven by higher retail prices.

Expenditure excluding interest and investment for the year to date of £158.5bn was unchanged from the same period last year, as reduced spending on the pandemic including furlough programmes was offset by planned increases in spending announced in last year’s Spending Review and by additional support to households to help with their energy bills.

Interest amounted to £15.7bn in April and May, £6.1bn or 64% higher than the £9.6bn in the two months ended 31 May 2021, reflecting how higher interest rates and higher inflation are increasing the government’s cost of borrowing.

Net public sector investment in April and May 2022 was reported to be £9.2bn, which is £0.1bn lower than a year previously. This is slightly surprising given planned increases in capital expenditure as well as the subsidies given in the past two months to Bulb Energy, a failed energy supplier taken over by the government.

The increase in net debt of £21.2bn since the start of the financial year comprises the deficit for the month of £35.9bn less £14.7bn in net borrowing repayments. This reflects the recovery of loans to banks through the Bank of England’s Term Funding Scheme and of loans to businesses via the British Business Bank (including bounce-back and other coronavirus loans), offset by funding for student loans and other government cash requirements.

Alison Ring OBE FCA, Public Sector and Taxation Director for ICAEW, said: “A slightly higher deficit than expected in this month’s numbers and a rising interest bill will not provide any comfort for the Chancellor as he considers how to respond to public sector wage demands at the same time as attempting to build capacity for pre-election tax cuts next year.

The economic storm clouds hovering over the fiscal outlook, as living standards go into reverse and inflation erodes the extent of planned investment in local communities, are likely to make the government’s ambition to level up the country even more difficult to achieve.”

Table showing cumulative numbers for April and May 2022 and variances against the same period a year ago:

Receipts £147.5bn: £12.4bn or +8%
Expenditure (£158.5bn): £0.0bn
Interest (£15.7bn): (£6.1bn) or +39%
Net investment: (£9.2bn): £0.1bn or -1%
Deficit (£35.9bn): £6.4bn or -18%
Other borrowing: £14.7bn: £31.1bn or -212%
(Increase) in net debt: (£21.2bn): £37.5bn or -177%

Public sector net debt: £2,363.2bn: £170.1bn or +8%
Public sector net debt / GDP 95.8%: 0.5% or +0.5%

Caution is needed with respect to the numbers published by the ONS, which are expected to be repeatedly revised as estimates are refined and gaps in the underlying data are filled.

The ONS made several revisions to the prior period fiscal numbers to reflect revisions to estimates. These had the effect of increasing the reported fiscal deficit for the month of April 2022 by £3.3bn from £18.6bn to £21.9bn and decreasing the reported fiscal deficits for the 12 months to March 2022 by £0.9bn from £144.6bn to £143.7bn and for the year ended 31 March 2021 by £7.7bn from £317.3bn to £309.6bn.

Table showing receipts, expenditure, interest, net investment, deficit and net debt for April and May combined in 2019, 2020, 2021 and 2022 respectively.

For details, click on the link to the original article on the ICAEW website.

This article was originally published by ICAEW.

ICAEW chart of the week: Whole of Government Accounts 2019/20

We take a look at the government balance sheet at 31 March 2020 this week, following publication by HM Treasury of the long-delayed 2019/20 audited financial statements for the UK public sector.

Step chart showing public assets £2,129bn, liabilities of (£4,973bn) and net liabilities of (£2,834bn).

Fixed assets £1,353bn, receivables & other £195bn, investments £323bn, financial assets £268bn.

Financial liabilities (£2,207bn), payables (£201bn), pensions (£2,190bn).

Taxpayer equity (£2,834bn).

HM Treasury was up in front of the Public Accounts Committee (PAC) this week to be grilled on the Whole of Government Accounts (WGA) for the year ended 31 March 2020. The first question posed by MPs was why it had taken more than 26 months to publish the audited financial statements for the UK public sector, unlocking a tale of woe regarding the pandemic, delays in central government reporting, even greater delays in local government, and problems in implementing a new consolidation system. 

For all that, the PAC expressed their appreciation for the contents of the WGA, which comprises a performance report, governance statements, financial statements prepared in accordance with International Financial Reporting Standards, an audit report and a reconciliation to the fiscal numbers reported by the Office for National Statistics. The UK is one of the leading governments around the world in preparing comprehensive financial reports similar to those seen in the private sector, and is the only one to attempt to incorporate local government as well as central government and public corporations.

Our chart summarises the balance sheet reported in the consolidated financial statements at 31 March 2020, when there were total assets of £2,139bn, total liabilities of £4.973bn and negative taxpayer equity of £2,834bn. These numbers do not reflect the more than half a trillion pounds borrowed since then which are likely to see the 2020/21 and 2021/22 WGA move even further into negative territory. 

On the positive side of the balance sheet were:

  • £195bn of receivable and other assets, comprising £160bn of trade and other receivables due within one year, £22bn of receivables due in more than year, £11bn of inventories and £2bn of assets held for sale;
  • £1,353bn of fixed assets, consisting of £676bn for infrastructure, £459bn of land and buildings, £77bn of assets under construction, £41bn of military equipment, £60bn of other tangible fixed assets, and £40bn of intangibles;
  • £323bn of investments, including £126bn of non-current loans and deposits, £77bn in student loans, £36bn in equity investments, £22bn invested in the IMF, £38bn in derivatives and other, and £24bn in investment property; and 
  • £268bn of current financial assets, of which £118bn were in debt securities, £74bn in loan balances due within one year, £38bn in cash and cash equivalents, £13bn in gold holdings, £13bn in IMF special drawing rights and £12bn in derivatives and other.

On the negative side, there were:

  • £2,207bn in financial liabilities, comprising £1,266bn in government securities (gilts and Treasury bills), £560bn of deposits owed to banks, £179bn owed to investors in National Savings & Investments, £78bn in bank and other borrowings, £74bn in banknotes and £50bn in derivatives and other financial liabilities;
  • £201bn of payables, including £66bn of accruals and deferred income, £55bn of trade and other payables, £42bn in lease obligations, £34bn in tax and duty refunds payable and £4bn in contract liabilities;
  • £2,190bn in net pension obligations, of which £2,062bn were for unfunded pension schemes (NHS £760bn, teachers £490bn, civil service £309bn, armed forces £233bn, police & fire £197bn, other £73bn) and £128bn for funded schemes (local government £359bn less £253bn = £106bn, and other funded schemes £106bn less £84bn = £22bn). This balance does not include the state pension, which is treated as a welfare benefit and not a liability for accounting purposes; and
  • £375bn in provisions for liabilities and charges, including £157bn for nuclear decommissioning, £86bn for clinical negligence, £39bn for EU liabilities, £31bn for the pension protection fund and £62bn in other provisions.

Net liabilities therefore amounted to £2,834bn, reflecting the general policy decision taken by successive governments not to fund liabilities in advance, but instead to rely on future tax revenues and borrowing to provide cash as needed to settle liabilities and other financial obligations and commitments. As Sir Tom Scholar, Permanent Secretary at HM Treasury, informed the PAC, this minimises the investment risks the government might otherwise be exposed to if it were to invest in (say) the stock market.

Cat Little, Head of the Government Finance Function, set out plans to bring down the time to prepare the WGA, to within 24 months for the 2020/21 WGA and to within 20 months for the 2021/22 WGA. This remains a long way off the long-term objective of producing the WGA within nine months of the balance sheet date.

While the numbers in these financial statements are now more than two years old, they are still extremely valuable in providing a baseline for the financial position of the UK public sector as the country headed into the pandemic. It is well worth a read if you have the time.

The Whole of Government Accounts 2019/20 is available online.

This chart was originally published by ICAEW.

ICAEW chart of the week: Public finances by region 2020/21

The ICAEW chart this week highlights how every single region and nation in the UK was in deficit in the first fiscal year of the pandemic.

Our chart this week highlights how every single region and nation in the UK was in deficit in the first fiscal year of the pandemic.

The Office for National Statistics (ONS) recently released an analysis of government revenue and expenditure by region and nation of the UK for the financial year ended 31 March 2021 – the first year of the pandemic. 

This was a year that saw public spending balloon to £1,112bn from £884bn in 2019/20 as the government splurged cash in response to the arrival of the coronavirus. At the same time, taxes and other income fell to £794bn in 2020/21 from £829bn the year before, while unprecedented levels of support to businesses and individuals prevented a much greater collapse in tax receipts. The resulting deficit of £318bn was the largest ever in peacetime.

The chart illustrates how every region incurred a deficit in 2020/21, with a deficit per head of approximately £800 in Greater London (revenue per head £18,440/expenditure per head £19,240), followed by £1,640 in the South East (£14,020/£15,660), £3,360 in the East of England (£11,940/£15,300), £5,000 in the South West (£10,940/£15,940), £5,140 in the East Midlands (£9,860/£15,000), £5,920 in Yorkshire and The Humber (£9,620/£15,540), £6,220 in the West Midlands Region (£9,380/£15,600), £6,580 in Scotland (£11,780/£18,360), £6,780 in the North West (£9,800/£16,580), £7,960 in the North East (£8,700/£16,660), £8,180 in Wales (£9,060/£17,240) and £9,500 in Northern Ireland (£8,740/£18,240). These numbers compare with an overall UK average deficit of approximately £4,740 per person, comprising per capita revenue of £11,840 less per capita spending of £16,580 based on a population of 67.1m.

The deficit in 2020/21 was so large that even London and the South East, which normally supply substantially more revenue to the government than they receive back in expenditure, saw the reverse this time. (In contrast, for example, with the surpluses of £4,520 and £2,180 per head respectively in 2019/20.)

Inclusive of pandemic spending, most regions ended up benefiting from government expenditure and welfare support of between £15,000 and £17,000 per person in the year, the outliers being Scotland and Northern Ireland, where spending exceeded £18,000 and London where it exceeded £19,000 per head. There is much wider range in the average for taxes and other income, from less than £9,000 per person in in the North East and Northern Ireland (more than 25% lower than the UK-wide average) up to more than £14,000 per head in the South East and more than £18,000 per head in London (more than 50% higher than the UK average).

For the public finances 2020/21 was a landmark year, in which exceptional levels of expenditure and an extraordinarily large deficit led to a significant increase in public debt. Despite that – as our chart illustrates – there continue to be significant economic and fiscal disparities across the regions and nations of the UK.

This chart was originally published by ICAEW.

ICAEW chart of the week: VAT receipts by quarter

This week’s chart highlights how the VAT deferral scheme is almost entirely behind higher VAT receipts in recent quarters, providing a note of caution to recent media headlines welcoming bumper tax revenues.

Horizontal bar chart showing VAT receipts by quarter from Jan-Mar 2017 through to Jan-Mar 2022.

2017: £31.7bn, £30.3bn, £31.1bn,  £31.8bn (Oct-Dec)
2018: £33.2bn, £30.8bn, £33.5bn, £32.9bn
2019: £35.4bn, £32.2bn, £34.3bn, £34.2bn
2020: £29.2bn, -£0.4bn, £28.4bn, £34.2bn
2021: £39.4bn, £35.2bn, £40.2bn, £41.4bn
2022 Jan-Mar: £40.6bn

The ICAEW chart of the week is on the topic of VAT, illustrating the quarterly pattern of VAT receipts since 2017 according to the HMRC tax receipts and national insurance contributions monthly bulletin published on 26 April.

The chart highlights how VAT receipts have grown steadily since 2017 up until the start of the pandemic, with receipts in calendar quarters of £31.7bn (Jan-Mar), £30.3bn (Apr-Jun), £31.1bn (Jul-Sep) and £31.8bn (Oct-Dec) in 2017; £33.2bn, £30.8bn, £33.5bn and £32.9bn in 2018; and £35.4bn, £32.2bn, £34.3bn and £34.2bn in 2019. This was followed by a big dip in 2020, with £29.2bn in Jan-Mar 2020, a net negative outflow of -£0.4bn in Apr-Jun, £28.4bn in Jul-Sep and £34.2bn in Oct-Dec 2020. In 2021, VAT receipts strengthened, with £39.4bn, £35.2bn, £40.2bn and £41.4bn by quarter, followed by £40.6bn in Jan-Mar 2022, the last quarter of the 2021/22 fiscal year.

The significant drop in VAT receipts in 2020 was driven by a combination of the economic contraction caused by the pandemic, cuts in VAT rates for hospitality, and – most significantly – £33.5bn in deferrals under the VAT payments deferral scheme implemented at the time of the first lockdown in 2020. This is the primary driver of the negative VAT receipts in the Apr-Jun quarter 2020 highlighted in the chart.

The original intention was that VAT deferred from 2020 would be due by no later than 30 June 2021, however, further relief in the form of a monthly instalment plan allowed VAT-registered businesses to spread the payment of the deferred VAT over the rest of the 2021/22 fiscal year. This has boosted the last three quarters of VAT receipts shown in the chart.

HMRC reports that £31.3bn of the VAT deferred was carried forward in 2021/22, which would imply a swing between financial years in the order of £60bn. This is greater than the £56bn increase in VAT receipts seen between the £101bn recorded for the four quarters to March 2021 and the £157bn in the following four quarters constituting the 2021/22 fiscal year.

VAT receipts excluding the effect of the deferral scheme may therefore have decreased in the last four quarters, which is surprising in the context of rising prices and the end of the discounted VAT rate for hospitality.

Recent media headlines reporting a bumper tax windfall for the Chancellor should therefore be treated with some caution. While tax receipts in 2021/22 have been much stronger than expected, a significant element of the increase relates to the collection of VAT held over from the previous year and not to any genuine increase in underlying tax revenues.

This chart was originally published by ICAEW.

ICAEW chart of the week: UK International Reserves

We take a look at the UK’s official international reserves that are held to safeguard sterling and support monetary policy.

Step chart showing components of the UK International Reserves.

Gross reserves: £101bn foreign currency securities and deposits, £36bn IMF, £15bn gold, £23bn other instruments.

Liabilities: (£109bn) other instruments

Net reserves: £66bn

Our chart this week is on the UK International Reserves, which comprise foreign currency securities and deposits, gold, investments in the International Monetary Fund (IMF), and other financial instruments primarily used to manage sterling as a national currency and support monetary policy.

As illustrated by the chart, the combined total of UK government and Bank of England international gross reserves was £175bn at 31 March 2022, comprising £101bn in foreign currency securities and deposits, £36bn invested in the IMF, £15bn in gold and £23bn in other financial instruments. This was offset by £109bn in liabilities to arrive at net reserves of £66bn.

According to the Bank of England, the £101bn in foreign currency securities consisted of £75bn in bonds and notes issued by foreign governments, £15bn in foreign government money market investments, £6bn in foreign central bank deposits and £5bn in private sector securities. The £36bn invested the IMF comprises £6bn in IMF reserves (effectively the IMF’s share capital) and £31bn in Special Drawing Rights (SDRs), a government-specific financial asset underpinned by a basket of currencies (US dollar, Euro, Chinese Yuan, Japanese Yen and sterling). The UK government also owned or had rights to 9,976,041 fine troy ounces of gold worth £15bn on 31 March 2022, while other financial instruments of £23bn included £20bn of claims against counterparties on account of reverse repo transactions.

Reserve assets were offset by £109bn in liabilities, comprising loans and securities used to finance reserve assets, repo obligations, and derivative financial instruments including foreign currency forwards, cross currency interest rate swaps and sterling interest rate swaps.

Not shown in the chart is the split between the UK government’s net reserves of £66bn, consisting of £151bn in gross assets less £85bn in liabilities, and the Bank of England’s approximately zero net reserve position, consisting of £24bn in gross assets (£12bn in foreign currency securities and bonds plus £12bn in other financial instruments) less £24bn in liabilities.

The Bank of England manages both its own foreign currency reserves, used to support its monetary policy objectives of controlling inflation, and the UK government’s international reserves, most of which sit in the Exchange Equalisation Account established in 1932 to provide a fund that can be used, when necessary, to regulate the exchange value of sterling. In normal circumstances the Bank of England’s main objectives in managing the reserves are to ensure the liquidity of sterling, the liquidity and security of the reserve assets themselves, and to ensure the reserves are managed in a cost-effective way.

In normal circumstances, the reserves are not used to actively intervene in foreign exchange markets, but are kept ‘in reserve’ on a precautionary basis in case there is any change in exchange rate policy in the future or in the event of any unexpected shocks. More prosaically, they are used to provide foreign currency services for government departments and agencies needing to transact in foreign currencies, as well as to buy, hold and sell SDRs as required by the UK’s membership of the IMF.

Although relatively small in the context of over £1trn a year in UK public spending and £2.3trn in public sector net debt, the UK’s international reserves provide HM Treasury and the Bank of England with a substantial amount of firepower in the foreign exchange markets should there ever be a need to intervene to support sterling. Fortunately, almost all of the foreign currency securities and deposits held in the reserves are invested in governments and central banks of allied countries, a contrast to the position of Russia, which has seen a substantial proportion of its international reserves frozen following its invasion of Ukraine.

One piece of good news amid all the economic gloom at the moment is that the UK International Reserves aren’t hitting the headlines. Because when they do, you really will know that all is not well.

This chart was originally published by ICAEW.

ICAEW chart of the week: US proposed federal budget 2023

Our chart this week illustrates the $5.8tn federal budget for the 2023 fiscal year proposed by President Biden to Congress for approval – a process that will not be straightforward.

Chart illustrating the 2023 US federal budget proposal.

Receipts $4.6tn + Deficit $1.2tn = Outlays $5.8tn.

Receipts comprise social security $1.5tn, income taxes $2.3tn, corporate taxes $0.5tn and other $0.3tn.

Outlays comprise welfare $3.7tn (social security $1.3tn, healthcare $1.4tn, veterans $0.2tn, income security $0.8tn), net interest of $0.4tn and federal government spending of $1.77tn (defence $0.8tn, non-defence $0.9tn).

The US Office for Management and Budget (OMB) has just published President Biden’s proposal for the Budget of the United States Government, Fiscal Year 2023, which commences on 1 October 2022.

Federal spending proposed of $5.8tn comprises $3.7bn of ‘mandatory’ spending, primarily on welfare programmes, $0.4tn on debt interest, and $1.7tn of ‘discretionary’ spending. Welfare spending includes $1.3tn on social security, $1.4tn on healthcare (Medicare and Medicaid), $0.2tn on support to veterans, and $0.8tn on income security and other programmes.

This is a $60bn reduction from the $5.9tn forecast for the current financial year ending on 30 September 2022, with increases in social security ($99bn), Medicare and Medicaid ($67bn), interest ($39bn) and defence ($29bn), offset by a reduction of $280bn in income security (primarily pandemic support) and $14bn in non-defence departmental spending. This compares with the $6.8trn spent in the fiscal year ended 30 September 2021 at the height of the pandemic.

Receipts are forecast at $4.6tn, comprising social security payroll taxes of $1.5tn, federal income taxes of $2.3tn, corporate taxes of $0.5tn, and other taxes $0.3tn, resulting in a deficit of $1.2tn to be funded by borrowing.

Receipts are forecast to be $201bn higher than the $4.4tn forecast for the current financial year, with social security receipts up $64bn, income taxes up $82bn and corporate taxes up $118bn, offset by a fall of $63bn in other receipts. This primarily relates to economic factors as the US emerges from the pandemic but, as has been publicly reported, also involves higher taxes on ‘billionaires’, among other tax measures.

With pandemic income security and furlough programmes no longer required, the deficit has fallen from $2.8tn in 2021 to $1.4tn in the current year and a proposed $1.2tn in the next, before increasing to $1.8tn in 2032, reflecting increases in both receipts and spending over the coming decade.

The budget documents prepared by the OMB focus in particular on the major plans to improve infrastructure embodied in the bipartisan Infrastructure Investment and Jobs Act 2021, as well as further investment in defence, in lowering health and social care costs for individuals, in improving housing, pre-school and college education, and in reducing energy costs by combating climate change. The OMB suggests that there is some prudence in the budget given the uncertainties about whether proposed tax rises will obtain political support from within Congress, with an indication that this will be used to reduce the federal deficit even further if all the proposed tax rises are enacted into law.

For President Biden, this is his last budget proposal before the mid-term elections in November, when there is a possibility that the Democrats might lose control of one, or even both, houses of Congress. This makes it particularly important to his ability to deliver his domestic agenda.

This chart was originally published by ICAEW.

ICAEW chart of the week: Spring Statement 2022

This week we look at the Spring Statement, where the story is all about inflation as the Chancellor responded to the pressures that have contributed to the cost of living crisis.

Step chart showing changes from the October forecast for the deficit in 2022/23 and the revised Spring Statement forecast for the same period.

October forecast £83bn - higher receipts £30bn - lower unemployment £3bn + debt interest +£41bn + other revisions £2bn = updated forecast of £93bn.

The - student loans £11bn + energy support £12bn + tax cuts £6bn - other changes £1bn = Spring Statement forecast of £99bn.

What Chancellor Rishi Sunak had originally hoped would be a short report to Parliament on the latest economic and fiscal forecasts turned into a fully-fledged fiscal event as he responded to a ‘cost of living’ crisis that is expected to put severe pressure on household budgets and is risking the viability of many businesses. The Office for Budget Responsibility (OBR) estimates that the Chancellor’s energy support package and tax cuts will cover around a third of the decline in living standards expected in the coming financial year.

Inflation is now centre stage in a way that it hasn’t been since the 1970s.

Our chart summarises the changes in the forecast for fiscal deficit the coming financial year commencing on 1 April 2022, showing how last October’s forecast of a £83bn shortfall between receipts and expenditure has increased to a £99bn shortfall in the latest forecasts by the OBR.

The good news is that the economic recovery from the pandemic has been stronger than previously thought, with the pandemic support measures such as the furlough scheme being rewarded with stronger tax receipts coming through into the forecasts. An extra £30bn is expected in 2022/23, complemented by lower unemployment than expected, which also reduces the forecast for welfare spending by an estimated £3bn.

Offsetting that is a huge rise in interest costs. This is driven by a sharp rise in the retail prices index (RPI), to which a substantial proportion of the government’s debt is linked, combined with higher interest rates as the Bank of England attempts to prevent inflation rising even further. These factors add an extra £41bn to the forecast interest bill for next year, bringing it up to £83bn, three and a half times the £24bn in 2020/21 and more than 50% higher than the £54bn now expected for the current financial year. Interest in subsequential financial years has been revised up by around £9bn a year on the basis (the forecasters hope) that inflation is brought back under control in 2023/24.

Other changes to the fiscal forecast add £2bn to the deficit forecast, bringing it up to £93bn before taking account of policy decisions announced since last October. The first, which for some reason was not highlighted by the Chancellor in his speech, was the impact of increasing the amounts that graduates will have to repay on their student loans, reducing the anticipated bad debt write-off in 2022/23 by £11bn from the estimate made last October.

The Chancellor did talk about the energy support package that he announced last month as the energy prices rises coming in April were announced. However, he did not add to that package directly – instead choosing to announce tax cuts of about £6bn in 2022/23. The main element is an increase from July of around £3,000 in the threshold at which National Insurance is payable by employees, which will benefit many low to middle income families, but not (as the Institute for Fiscal Studies, the Resolution Foundation and others have pointed out) the very poorest that will be hit hardest by price rises. More than two thirds of the benefit will go to higher income households.

Overall, the OBR says the energy support package and tax cuts together will offset around a third of the fall in living standards that is expected in the coming year.

Other policy changes amounting to around £1bn were offset by indirect effects of £2bn, resulting in a net £1bn benefit to bring the forecast deficit to £99bn, some £16bn higher in total than that predicted in October.

These numbers don’t include the 1p cut in the basic rate of income tax from 6 April 2024 that was also announced by the Chancellor. This is expected to cost around £6bn a year in lower tax receipts, but is expected to be more than offset by the effect of freezing both income tax and national insurance thresholds (expected to bring in somewhere in the region of £18bn extra a year). In effect, the Chancellor has chosen to bank the ‘benefit’ of higher inflation on his decision to freeze thresholds.

The big question is whether the Chancellor will be able to hold off from providing further support to households and businesses for the rest of the financial year. Most commentators appear to suggest that it is likely that he will return to the despatch box in the House of Commons before the next round of energy prices rises in October in order to make further announcements.

This article was originally published by ICAEW.

A Spring Statement dominated by inflation

Tax plans brought forward as Chancellor Rishi Sunak seeks to limit spending commitments and build fiscal headroom ahead of the Autumn Budget.

Inflation dominated the Spring Statement as the Chancellor added to his support package for households and businesses facing rapidly rising prices but held off giving any extra money for public services.

Despite a major tax cut from raising National Insurance thresholds, the OBR estimates that the measures announced by the Chancellor for the coming financial year will offset around a third of the fall in living standards. This will leave household budgets to take most of the strain of the rapidly rising prices, with the potential that the government will need to intervene again later in the year as the impact becomes clearer.

The biggest individual change in the government’s spending plans is the bill for interest on central government debt, which increases from £24bn in 2020/21 to £54bn this year and a forecast of £83bn for 2022/23. This is the biggest driver of an increase in the forecast deficit for next year from last October’s forecast of £62bn to a revised forecast of £99bn, despite an £11bn boost from restructuring the system for student loans that could see graduates paying back their loans almost up until retirement.

Despite the increase in the coming financial year, the OBR expects the deficit in the rest of the forecast period to be lower than before, with the projected deficits in the subsequent four years up to 2026/27 down from £62bn, £46bn, £46bn and £44bn to £50bn, £37bn, £35bn and £32bn – a net improvement of £11bn a year on average. 

Higher tax receipts are the primary driver of a reduced forecast for public sector net debt at 31 March 2027 of £2,480bn, down from a previous forecast of £2,567bn, but still £687bn higher than the £1,793bn at 31 March 2020. The impact on the debt-to-GDP ratio is greater, with lower cash outflows and higher GDP driven by inflation combining to reduce the ratio from a previous forecast of 88% in 2027 to 83%, reversing a significant proportion of the increase caused by the pandemic.

The OBR calculates that the Chancellor has about £30bn of headroom against his fiscal targets, giving him more capacity to provide additional support for households and businesses later in the year if he thinks it necessary. Given the uncertainties surrounding the potential impact of Russia’s invasion of Ukraine on the UK economy, it is perhaps understandable for Rishi Sunak to want to accelerate the reduction in debt in relation to the size of the economy and build greater fiscal resilience. However, he will be conscious of the risk of a recession if households cut back their spending in the domestic economy by too much.

Other than some welcome additional funding to tackle fraud, there was no significant additional funding for departments or local authorities who will need to stick within their original budgets set by the three-year Spending Review announced last October. This could result in ‘unplanned austerity’ as they seek to find savings to offset rising costs, in particular the government’s capital investment plans, where the cost of building infrastructure is likely to increase significantly, potentially jeopardising priorities such as levelling up.

Alison Ring, Director of Public Sector and Taxation, commented: “The story of the Spring Statement is inflation, which is driving a sharp fall in living standards and is causing the interest bill on public debt to multiply. The government has responded with a package of measures that the OBR estimates offset about a third of the decline, but this still leaves household budgets exposed to the effect of rapidly rising prices. The Chancellor’s focus on building up fiscal resilience suggests he may be trying to preserve some firepower for possible further interventions later in the year.

“With public finances in a better shape than previously forecast, the Chancellor will hope that he is going to be able to make good on his pledge to cut income tax in 2024.”

This article was originally published by ICAEW.

Spring Statement: what the new measures will mean

ICAEW Insights quotes me in an article on the Spring Statement 2022:

“Despite its impact on the government’s interest bill, there is a major benefit to inflation in that it helps bring down the debt-to-GDP ratio more quickly, providing the Chancellor more space to intervene to help with the cost of living,” Martin Wheatcroft, public finance adviser to ICAEW, explains.

According to the OBR, the new measures announced in the Spring Statement, along with the existing package announced previously, should offset around a third of the increase in costs that households are facing, leaving them with the burden of the other two-thirds, Wheatcroft says. “I think we should expect further measures from the Chancellor in the summer or autumn as the impacts on households become more apparent.”

Wheatcroft adds that it is likely that some of the announcements included in the Spring Statement were brought forward to ease tensions with backbenchers. “With members of his own party pressing for a delay in the NIC increase, I suspect the Chancellor felt pressure to bring forward measures that he may have been saving for later in the year, in particular his planned cut to income tax in 2024 and a tax plan that was likely set for a summer release ahead of the Autumn Budget.”

To read the full article, click here.

Public finances raise hopes for Spring Statement giveaway

February’s £13.1bn deficit was offset by revisions to prior month estimates, boosting public finances and putting further pressure on the Chancellor to provide more help to households and businesses facing rapidly rising prices.

The public sector finances for February 2022, released on Tuesday 22 March 2022, reported a deficit for the month of £13.1bn. This was an improvement of £2.4bn from the deficit of £15.4bn reported for February 2021, but £12.8bn worse than the £0.4bn deficit reported for February 2020.

The cumulative deficit of £138.4bn for the first 11 months of the 2021/22 financial year was £0.1bn less than that reported last month, as the £13.1bn deficit for February was offset by £13.2bn in revisions to prior month estimates.

Public sector net debt increased by £6.6bn from £2,320.2bn at the end of January to £2,326.8bn or 94.7% of GDP at the end of February, with tax and loan recoveries partly offsetting the deficit for the month. Despite that, debt is £192.4bn higher than at the start of the financial year and £533.7bn higher than March 2020.

The year-to-date deficit of £138.4bn compares with a cumulative deficit for the first 11 months of the financial year of £290.9bn in 2020/21 and £48.7bn in 2019/20. This was £25.9bn below the forecast published by the Office for Budget Responsibility alongside last October’s Autumn Budget and Spending Review 2021, with higher-than-forecast tax receipts being partially offset by higher-than-forecast interest charges on index-linked debt. Both are driven by higher rates of inflation, which takes more time to feed through to non-interest expenditure. This suggests that the deficit for the full year could end up somewhere in the region of £30bn below the official forecast of £183bn.

Cumulative receipts in the first 11 months of the 2021/22 financial year amounted to £826.0bn – £104.7bn or 15% higher than a year previously but £69.3bn or 9% above the level seen in the first 11 months of 2019/20. At the same time, cumulative expenditure excluding interest of £846.2bn was £65.1bn or 7% lower than the same period last year, but £127.4bn or 18% higher than two years ago.

Interest amounted to £69.2bn in the eleven months to 28 February 2022, which was £29.4bn or 74% higher than the same period in 2020/21, principally because of the effect of higher inflation on index-linked gilts. Interest costs were £17.8bn or 35% more than in the equivalent 11-month period ended 29 February 2020.

Cumulative net public sector investment up to February 2022 was £49.0bn. This was £12.1bn or 20% below the £29.7bn reported for the first 11 months of last year, which included around £17bn of COVID-19 related lending that the government does not expect to recover. Investment was £13.8bn or 39% more than two years ago, principally reflecting greater capital expenditures, including on HS2.

The increase in debt of £192.4bn since the start of the financial year comprises the cumulative deficit of £138.4bn and £54.0bn in other borrowing. The latter has been used to fund lending to banks through the Bank of England’s Term Funding Scheme, lending to businesses via the British Business Bank (including bounce-back and other coronavirus loans), student loans and other cash requirements, net of the recovery of taxes deferred last year and loan repayments.

Alison Ring OBE FCA, Public Sector and Taxation Director for ICAEW, says: “Today’s numbers show the impact inflation is having on the public finances as it continues to drive both tax receipts and interest costs higher. The deficit for the financial year is expected to be around £30bn lower than October’s official forecast of £183bn, while tomorrow’s Spring Statement forecasts could see a smaller deficit next year than the £62bn expected before the pandemic.

“Uncertainty about the impact of the war in Ukraine on the UK means it will be extremely difficult for the Chancellor to gauge the level of intervention needed to support households and businesses facing rocketing energy prices if he’s to avoid a recession that could permanently damage the economy and the public finances, and still leave room for tax cuts in the Autumn Budget.”

Table showing cumulative 11 month numbers and variances against prior year and two years ago. All amounts in £bn, with negative numbers in brackets (costs / negative variances).

Receipts 826.0: 104.7 +15% better than prior year; 69.3 +9% versus two years ago

Expenditure (846.2): 65.1 -7%; (127.4) +18%

Interest (69.2): (29.4) +74%; (17.8) +35%

Net investment (49.0): 12.1 -20%; (13.8) +39%

Subtotal Deficit (138.4): 152.5 or -52% lower than the prior year; (89.7) +184% higher than two years ago

Other borrowing (54.0): (8.5) +19%; (73.3) -380%

Total (Increase) in net debt (192.4): 144 -43%; (163.0) +554%

Also:

Public sector net debt 2,326.8: 197.3 or +9% higher than prior year and 542.8 +30% higher than two years ago

Public sector net debt / GDP 94.7%: 0.3% or 0% higher than prior year; 12.7% or +15% higher than two years ago.

Caution is needed with respect to the numbers published by the Office for National Statistics (ONS), which are expected to be repeatedly revised as estimates are refined and gaps in the underlying data are filled.

The ONS made a number of revisions to prior month and prior year fiscal numbers to reflect revisions to estimates. These had the effect of decreasing the reported fiscal deficit for the 10 months to January 2022 by £13.2bn from £138.5bn to £125.3bn and reducing the deficit for the year ended 31 March 2021 by £4.1bn from £321.9bn to £317.8bn.

Table showing receipts, expenditure, interest, net investment and the deficit by month from Apr 2021 to Feb 2022.

Click on link below to the article on the ICAEW website for a readable version of this table.

This article was originally published by ICAEW.