My chart for ICAEW this week illustrates how Chancellor Jeremy Hunt used almost all of the available upside from inflation and fiscal drag to fund his tax measures and a series of business growth initiatives.
The Autumn Statement 2023 on Wednesday 22 November featured a surprise tax cut to national insurance and a perhaps less surprising decision to make full expensing of business capital expenditure permanent.
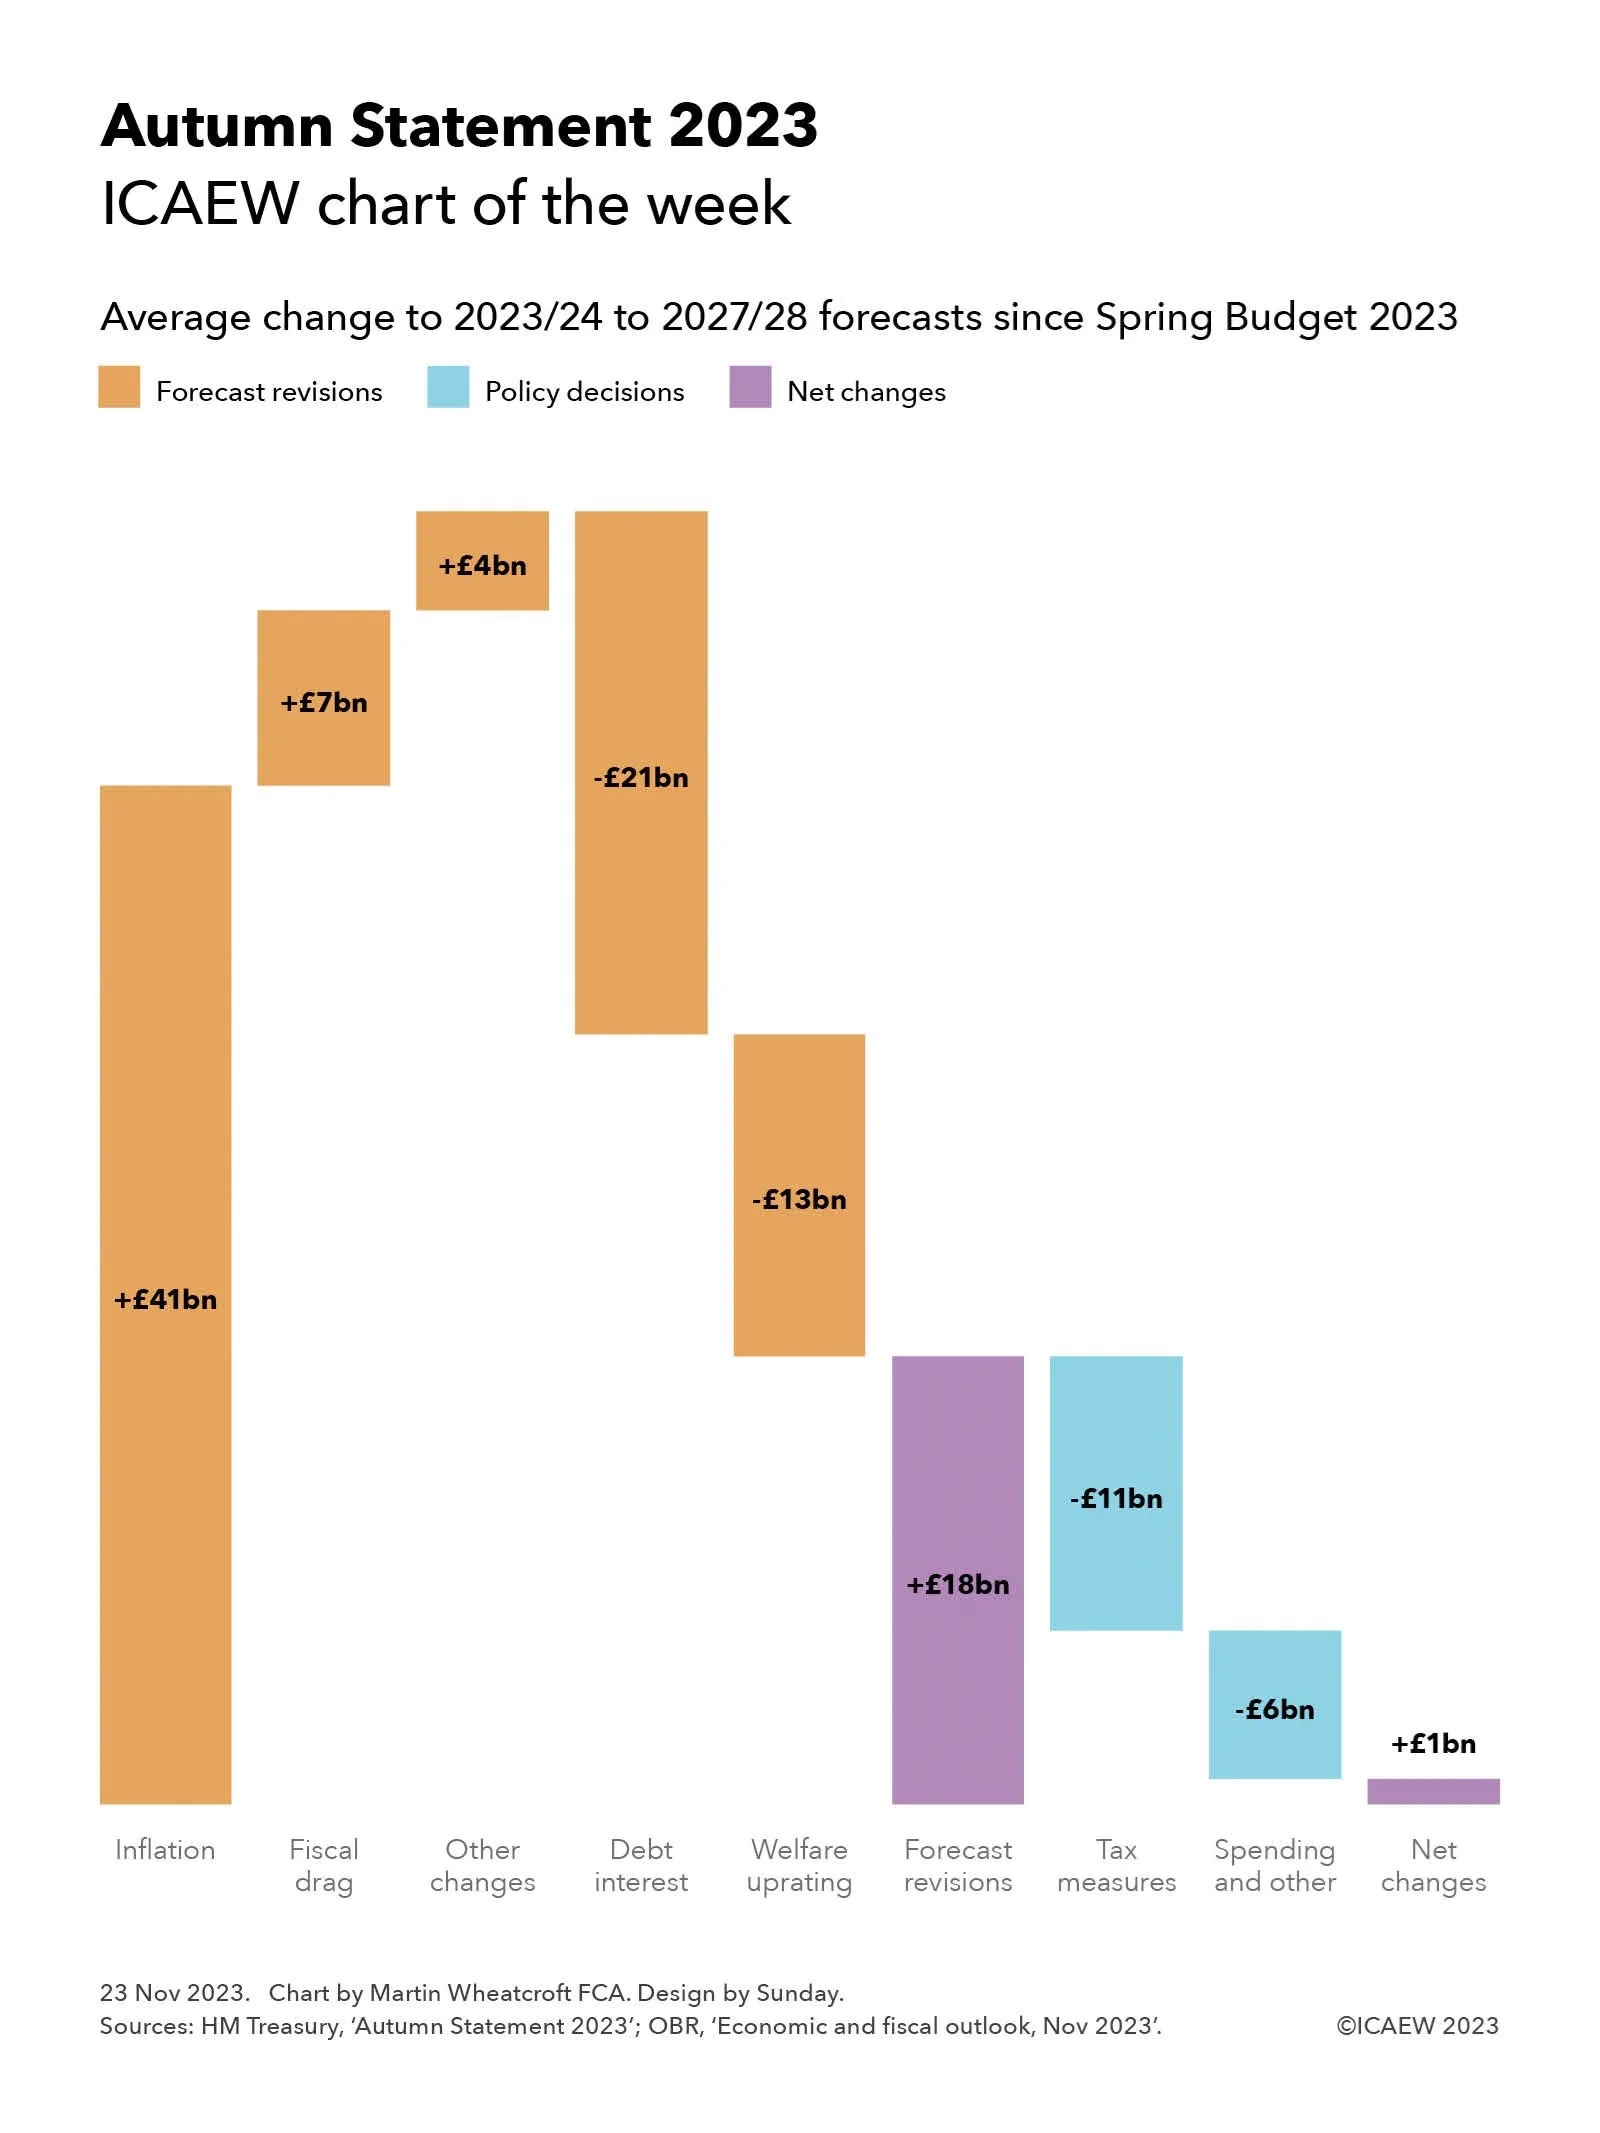
As my chart illustrates, the forecasts for the deficit over the next five years benefited by £41bn a year on average in higher receipts from inflation, £7bn a year on average in additional ‘fiscal drag’ as higher inflation erodes the value of frozen tax allowances more quickly, and a net £4bn in other upward forecast revisions. These improvements to the forecasts were offset by an average of £21bn a year in higher debt interest and £13bn from the expected inflation-driven uprating of the state pension and welfare benefits, to arrive at a net improvement of £18bn a year on average over the five financial years from 2023/24 to 2027/28 before policy decisions.
In theory, these upward forecast revisions should be absorbed by more spending on public services as higher inflation feeds through into salaries and procurement costs. However, the Chancellor has chosen to (in effect) sharply cut public spending and use almost all of the upward revisions to fund tax measures and business growth initiatives instead. These amounted to £11bn a year on average in tax changes and £6bn a year on average in spending increases and other changes to reduce the net impact to just £1bn a year on average over the five-year period.
The resulting net change of £1bn on average in forecasts for the deficit is to reduce the forecast deficit by £8bn for the current year (from £132bn to £124bn) and by £1bn for 2024/25 (to £85bn), with no net change in 2025/26 (at £77bn), an increase of £5bn in 2027/28 (to £68bn), and no net change for 2027/28 (at £49bn).
The main tax changes announced were the cuts in national insurance for employees by 2 percentage points from 12% to 10% and by 1 percentage point for the self-employed from 9% to 8%, reducing tax receipts by an average of £9bn over five years. This is combined with the effect of making full expensing permanent of £4bn – this change mainly affects the later years of the forecast (£11bn in 2027/28), although ironically the average is a better proxy for the long-term cost of this change, which the OBR estimates is around £3bn a year.
Other tax changes offset this to a small extent.
Spending and other changes of £6bn a year on average comprise incremental spending of £7bn a year plus £2bn higher debt interest to fund that spending, less £3bn in positive economic effects from that spending and from the tax measures above.
Although the cumulative fiscal deficit over five years has been revised down by £4bn, the OBR has revised its forecast for public sector net debt as of 31 March 2028 up by £94bn from to £3,004bn. This principally reflects changes in the planned profile of quantitative tightening and higher lending to students and businesses.
The big gamble the Chancellor appears to be making by choosing to opt for tax cuts now is that the OBR and Bank of England’s pessimistic forecasts for the economy are not realised – enabling him to find extra money in future fiscal events to cover the effect of inflation on public service spending. Otherwise, while it may be possible to cut public spending by as much as the Autumn Statement suggests, it is difficult to see how he can do so without a further deterioration in the quality of public services given he is not providing any additional investment in technology, people and process transformation to deliver sustainable efficiency gains.