ICAEW chart of the week: UK public sector pension liabilities

My chart for ICAEW this week looks at how public sector net pension obligations reduced by £1.2tn from £2.6tn to £1.4tn during the financial year ended 31 March 2023 as a consequence of a sharply rising discount rate.

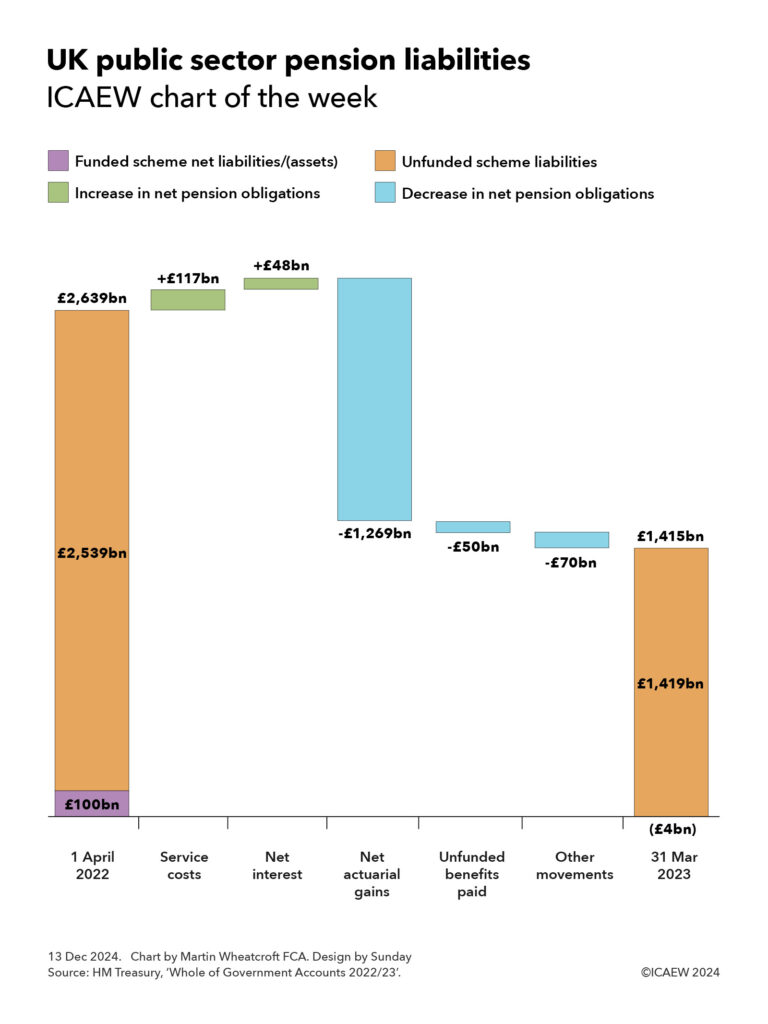
Step chart on UK public pension liabilities in the Whole of Government Accounts 2022/23. Opening position at 1 April 2022 £2,639bn (£2,539bn unfunded and £100bn funded) + £117bn service costs + £48bn net interest costs - £1,269bn net actuarial gains = £50bn unfunded benefits paid - £70bn other movements = £1,415bn pension liability on 31 Mar 2023 (£1,419bn unfunded scheme liabilities - £4bn funded scheme net pension asset). 

13 Dec 2024. Chart by Martin Wheatcroft FCA. Design by Sunday.

My chart of the week for ICAEW is on UK public sector pension liabilities, analysing how the net pension obligations reported in the Whole of Government Accounts 2022/23 reduced from £2,639bn on 1 April 2022 to £1,415bn on 31 March 2023. 

The Whole of Government Accounts are prepared in accordance with International Financial Reporting Standards (IFRS), with net pension obligations calculated in line with International Accounting Standard 19 (IAS19): Employee benefits.

The chart starts with opening net pension liabilities on 1 April 2022 of £2,639bn, comprising £2,539bn for unfunded schemes (including the NHS, teachers, civil services, armed forces, police and fire service schemes, among others) and a net liability of £100bn for funded schemes (principally local government schemes, but also some central government entities such as the BBC and the Bank of England, for example). The closing position on 31 March 2023 was £1,415bn, being pension liabilities of £1,419bn for unfunded schemes and a net pension asset of £4bn for funded schemes.

Service costs added £117bn to pension liabilities during 2022/23 and net interest added a further £48bn. These increases were more than offset by £1,269bn in net actuarial gains, £50bn in payments to pensioners in the unfunded pension schemes, and £70bn in other movements.

Service costs principally arise from the additional pension entitlements earned by public sector workers during the year, while net interest comprises the unwinding of the discount on pension liabilities (£40bn for unfunded schemes and £11bn for funded schemes) less investment income on assets in funded schemes (£3bn).

The net actuarial gains of £1,269bn comprises £1,357bn from changes in the assumptions underlying the value of liabilities (£1,218bn on unfunded schemes and £139bn in funded schemes) less £60bn (£59bn on unfunded schemes and £1bn on funded schemes) in experience gains and losses, less a loss of £28bn on investments. The principal assumption changes related to a change in the discount rates used to calculate pension obligations, which for the unfunded schemes increased from a real (i.e. inflation-adjusted) rate of 1.3% on 31 March 2022 to 1.7% on 31 March 2023.

The unfunded scheme liability is reduced for pensions paid on behalf of the schemes by the government. This contrasts with the funded schemes where assets are used to fund settlement of pension liabilities, resulting in no change in the net position. Other movements include £35bn in opening balance restatements relating to the NHS and former Royal Mail pension schemes and £39bn from the failure of 198 local authorities and the Northern Ireland Teachers Superannuation Scheme to report numbers to HM Treasury, less a net £4bn in other movements. 

The omission of so many local authorities, and the lack of audit assurance for many others, has led to the first ever audit opinion disclaimer by the Comptroller and Auditor General on the consolidated financial statements for the UK public sector.

Not shown in the chart is the breakdown of the £1,419bn closing balance for unfunded schemes into its constituent schemes: £535bn for NHS workers, £335bn for teachers, £222bn for civil servants, £156bn for the armed forces, £104bn for police, £30bn for pre-privatisation Royal Mail workers, £23bn for fire services, and £14bn for public sector staff in other unfunded schemes. Also not shown is the £304bn of liabilities in local government and other funded pension schemes or the related £308bn in investments in those schemes that result in a net pension fund asset of £4bn on 31 March 2023.

The recognition of a £1.3tn actuarial gain in the statement of comprehensive income and expenditure appears positive for the reported financial position of the nation by contributing to a reduction in overall net liabilities from £3.9tn to £2.4tn. However, it is important to realise that the future obligations to pay pensions to public sector employees haven’t changed – it is how those obligations are converted into current values.

Irrespective of the discount rate used, we as a nation will need to pay out very large amounts of money in public sector pensions.

This chart was originally published by ICAEW.

ICAEW chart of the week: UK long-term fiscal projections

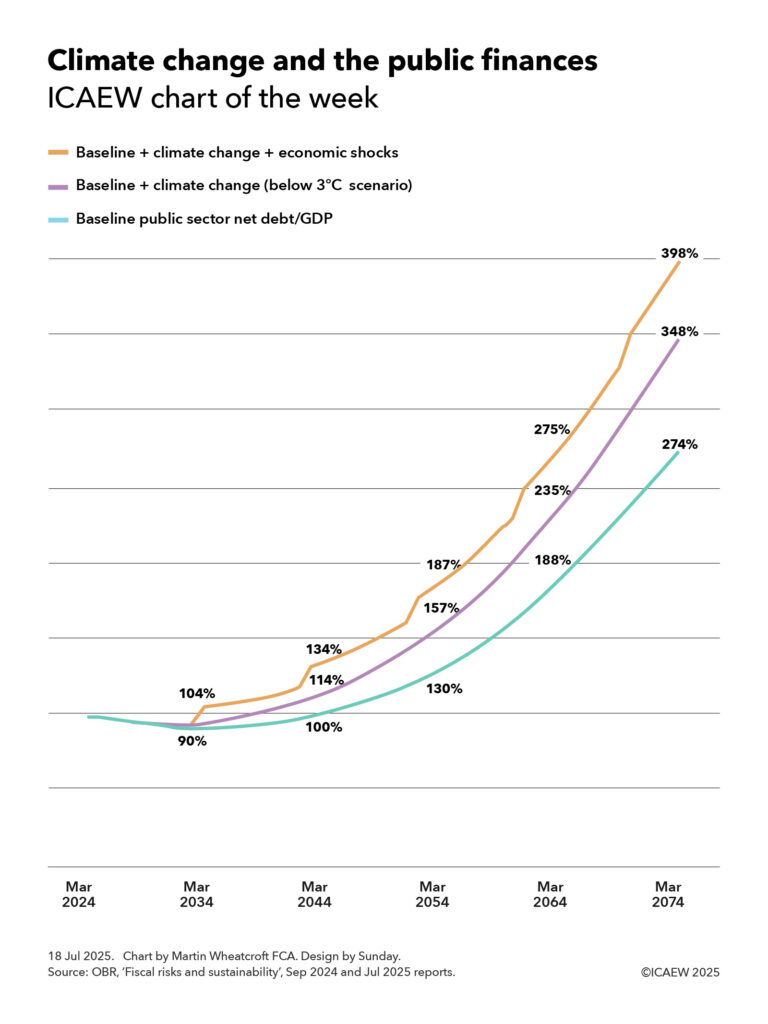
The OBR’s latest fiscal risks and sustainability report projects that public debt could reach 274% of GDP in 50 years’ time, or 324% if likely economic shocks are included.

ICAEW chart of the week: UK long-term fiscal projections. 
 
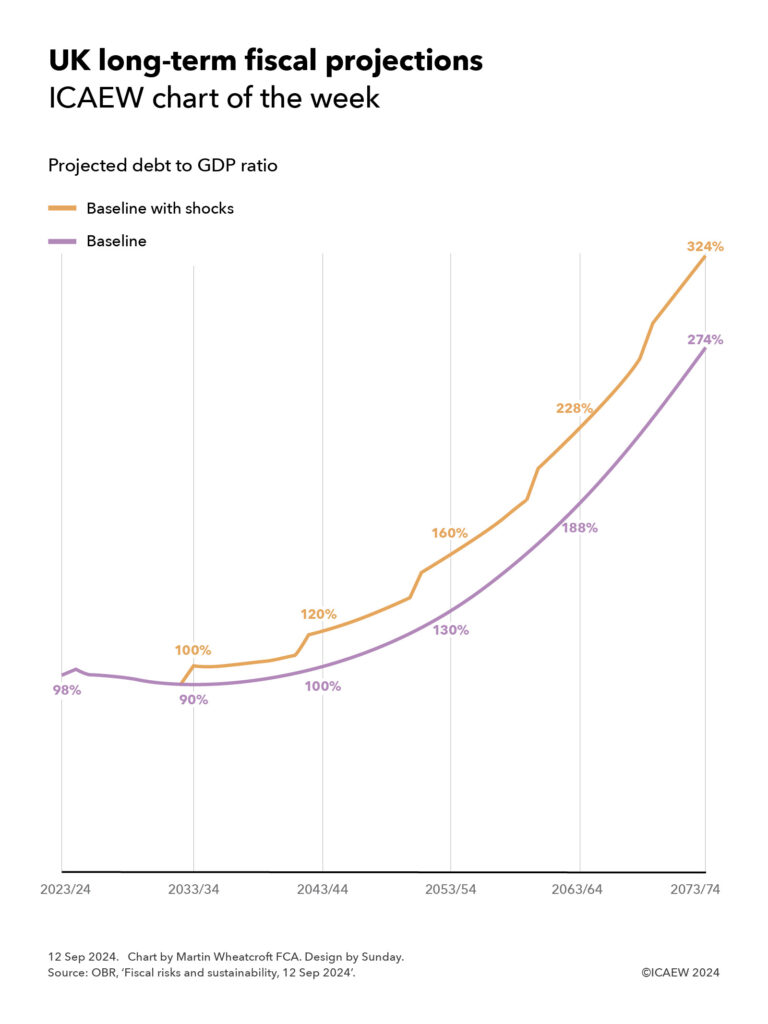
Line chart showing ‘baseline’ and ‘baseline with shocks’ projected debt to GDP ratio over the next 50 years according to the OBR’s latest fiscal projections, with labels at 10 year intervals. 

2023/24: Baseline 98%, Baseline with shocks 98%. 
2033/34: 90%, 100%. 
2043/44: 100%, 120%. 
2053/54: 130%, 160%. 
2063/64: 188%, 228%. 
2073/74: 274%, 324%. 

12 Sep 2024.   Chart by Martin Wheatcroft FCA. Design by Sunday. 

Source: OBR, ‘Fiscal risks and sustainability, 12 Sep 2024’. 

© ICAEW 2024.

Our chart this week is on the long-term fiscal projections included in the Office for Budget Responsibility’s (OBR) latest fiscal risk and sustainability report published on 12 September 2024.

The OBR suggests that – without action to improve productivity, increase taxes, cut spending, bring in more people or do more to tackle climate change – public sector net debt is projected to rise to 274%, or potentially 324% if likely economic shocks are included.

As the chart illustrates, debt to GDP was 98% at the end of 2023/24 and the baseline projection shows this falling over the coming decade to 90% by 2033/34, and then gradually increasing to 100% of GDP in 2043/44, 130% in 2053/54, 188% in 2063/64, and then 274% in 2073/74.

Experience tells us to expect an economic shock such as a recession every decade or so, and so the OBR also reports a ‘baseline with shocks’ scenario that sees the debt to GDP ratio reaching 100% of GDP in 2033/34, 120% in 2043/44, 160% in 2053/54, 228% in 2063/64, and then 324% in 2073/74.

The projections reflect long-term pressures on the public finances from the post-economic crisis slowdown in economic growth, an ageing population, the effects of climate change, and higher defence spending. 

They are, of course, dependent on the assumptions used in their calculation, especially reproductivity growth, net inward migration, the health of the population, and the degree of rise in global temperatures. They also assume that the previous government’s plans to cut public spending significantly over the next five years are adopted by the incoming government, which is considered to be unlikely given that most economic commentators thought these plans were unrealistic even if there had not been a change in government.

Alternative scenarios prepared by the OBR include a better health scenario that results in a 44% lower debt to GDP ratio in 2073/74, a worse health scenario that increases debt by 49% of GDP, a higher rise in global temperatures to 2℃ that increases debt by 23% and to 3℃ that increases debt by 33%.

The good news is that all of these projections are completely unrealistic. 

They are based on extrapolating from current tax and spending policies, without taking account of any actions that governments might take in the future to raise taxes, cut spending or develop the economy. It is extremely unlikely that future governments would be willing, or even able, to finance such large fiscal deficits over the next 50 years.

The bad news is that in consequence taxes are likely to go up.

While there are options to mitigate pressures on the public finances by cutting spending on public services or cutting the level of benefits such as the state pension, these are likely to be politically and practically difficult to achieve. Similarly, immigration remains a politically charged issue and encouraging higher levels of net inward migration significantly more than the 315,000 a year assumed from 2028/29 onwards might be challenging. 

The OBR suggests a ‘fiscal tightening’ of 1.5% each decade would be necessary to return debt to its pre-pandemic level of approximately 80% of GDP. If accomplished through tax rises alone, this would see tax levels increase from a projected 37% of GDP in 2027/28 to around 43% of GDP in 2073/24.

Avoiding either of these outcomes – unsustainable debt or ever-increasing levels of taxation – will require productivity growth to increase significantly. So, if you have any good ideas on how to achieve higher productivity that no one else has thought of (preferably without increasing public spending too much), please write to the Chancellor at 11 Downing Street as she would probably be interested to hear them.

This chart was originally published by ICAEW.

ICAEW chart of the week: Eurozone government bond yields

My chart for ICAEW this week is on the cost of government borrowing in the Eurozone, which on 4 September ranged from 2.17% for Danish 10-year bonds up to 3.59% for their Italian equivalents.

ICAEW chart of the week: Eurozone government bond yields. 
 
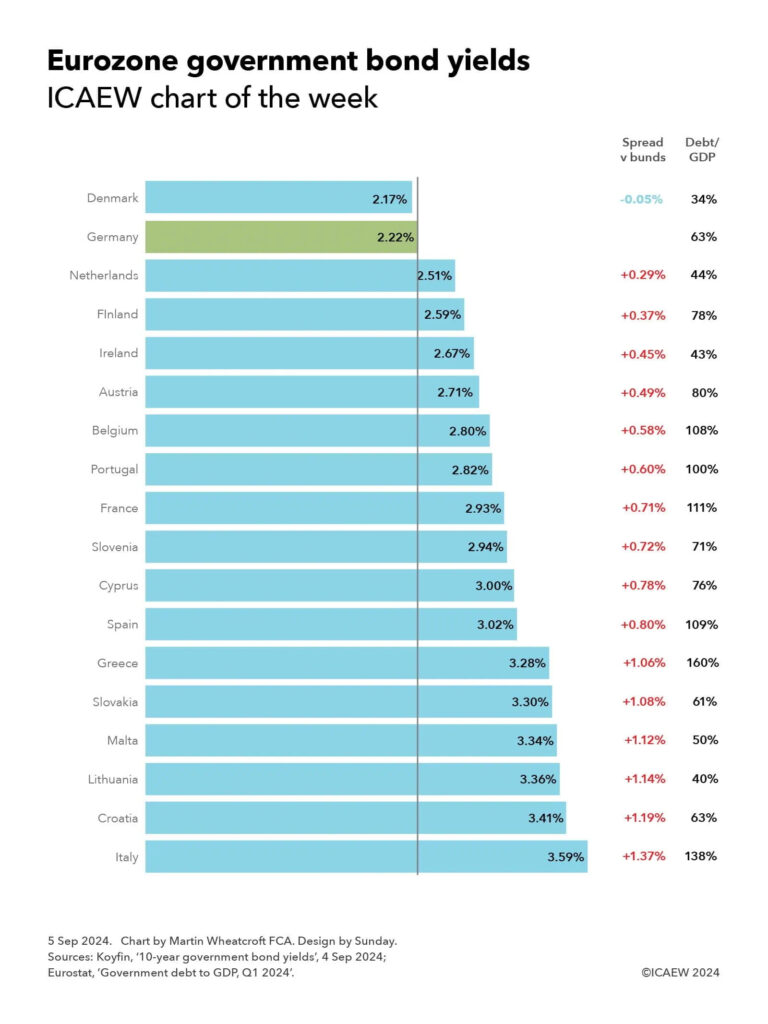
Bar chart showing the yields on 10-year government bonds on 4 September 2024, the spread versus German bunds, and each countries’ debt to GDP at the end of the first quarter of 2024. 

Denmark: 2.17% yield, -0.05% spread, 34% debt/GDP. 
Germany: 2.22%, -, 63%. 
Netherlands: 2.51%, +0.29%, 44%. 
Finland: 2.59%, +0.37%, 78%. 
Ireland: 2.67%, +0.45%, 43%. 
Austria: 2.71%, +0.49%, 80%. 
Belgium: 2.90%, +0.58%, 108%. 
Portugal: 2.82%, +0.60%, 100%. 
France: 2.93%, +0.71%, 111%. 
Slovenia: 2.94%, +0.72%, 71%. 
Cyprus: 3.00%, +0.78%, 76%. 
Spain: 3.02%, +0.80%, 109%. 
Greece: 3.28%, +1.06%, 160%. 
Slovakia: 3.30%, +1.08%, 61%. 
Malta: 3.34%, +1.12%, 50%. 
Lithuania: 3.36%, +1.14%, 40%. 
Croatia: 3.41%, +1.19%, 63%. 
Italy: 3.59%, +1.37%, 138%. 

5 Sep 2024.   Chart by Martin Wheatcroft FCA. Design by Sunday. 

Source: Koyfin, ’10-year government bond yields’, 4 Sep 2024; Eurostat, ‘Government debt to GDP, Q1 2024’.  

© ICAEW 2024.

My chart this week is on the range of yields payable on 10-year government bonds by 18 out of the 20 countries in the Eurozone for which data is available.

The chart illustrates how investors in German 10-year government bonds (known as ‘bunds’) would have received a yield to maturity of 2.22% – or conversely the German government could have borrowed at an effective interest rate of 2.22% if issuing fresh debt at that point in time. Yields on German bunds are used as benchmark rates for government debt not just in the Eurozone, but globally.

Just one country in the Eurozone has a lower 10-year bond yield than Germany, which is Denmark at 2.17% on 4 September, which is a 0.05 percentage points or 5 basis points (bp) ‘spread’ below the benchmark bund rate. 

While quoted yields move up and down all the time, sometimes by quite large amounts, spreads are much less volatile, providing an insight into how debt investors perceive the relative risks of investing in different countries’ sovereign debt.

The next lowest yields were the Netherlands at 2.51%, with a spread of 0.29 percentage points above bunds, and Finland at 2.59% (+0.37%). This is then followed by Ireland on 2.67% (+0.45%), Austria on 2.71% (+0.49%), Belgium on 2.80% (+0.58%), Portugal on 2.82% (+0.60%), France on 2.93% (+0.71%), Slovenia on 2.94% (+0.72%), Cyprus on 3.00% (0.78%) and Spain on 3.02% (+0.80%). There is then a small jump to Greece on 3.28% (+1.06%), Slovakia on 3.30% (+1.08%), Malta on 3.34% (+1.12%), Lithuania on 3.36% (+1.14%) and Croatia on 3.41% (+1.19%). 

The highest yield for investors among Eurozone countries – and hence the highest borrowing cost for its government – is Italy with 3.59%, which is 1.37 percentage points above the effective interest rate at which Germany could in theory borrow.

Comparing the bond yields in the Eurozone provides an insight into the relative strengths and weaknesses of these countries’ public finances and economies given that they all share a currency, a central bank base interest rate (currently 3.75%), and are all in the EU Single Market and Customs Union. Comparing yields with other currencies, such as the UK’s 3.95% for example (not shown in the chart), needs to take other factors into account, such as the UK’s much higher central bank base rate of 5%.

The chart also reports the government debt to GDP levels of each country for the second quarter of 2024 according to Eurostat, which may help explain why Denmark (with debt/GDP of 34%) pays a significantly lower borrowing cost than Spain (109%). 

However, debt/GDP doesn’t explain all of the differences, with the 10-year yield on Greek government debt (debt/GDP 160%) of 3.28% for example being significantly lower than the 10-year yield on Italian government debt (debt/GDP 138%) of 3.59%. 

Not shown in the chart are Estonia (debt/GDP 24%) and Latvia (45%), both of which tend to borrow at shorter maturities.

The lack of a firm correlation between debt/GDP and bond spreads should not be surprising as debt/GDP is a relatively crude measure of public finance strength or weakness. It excludes most government assets and non-debt liabilities, the funded or unfunded nature of their social security systems, as well as a country’s medium- and longer-term economic prospects and the perceived stability of that country’s government. These are all factors debt investors take into account when deciding the level of risk that they are willing to accept when investing.

This chart was originally published by ICAEW.

Government enters crisis control mode to curb public spending

Boost from self assessment tax receipts not enough to prevent a deficit in July as Chancellor searches for cost savings in the run up to the Autumn Budget.

The monthly public sector finances for July 2024 released by the Office for National Statistics (ONS) on Wednesday reported a provisional deficit for the first four months of the 2024/25 financial year of £51.4bn, £4.7bn worse than budgeted.

Alison Ring OBE FCA, ICAEW Director of Public Sector and Taxation, says: “Today’s data shows that the customary boost from self assessed tax receipts in July was not enough to prevent a deficit of £3.1bn, higher than budgeted, as cost pressures drove up public spending. Debt increased to £2,746bn or 99.4% of GDP at the end of July, up £5.9bn from the end of June 2024.

“The government is now in crisis control mode as it searches for savings to offset significant unbudgeted cost overruns in this financial year, with the cumulative deficit to July 2024 standing at £51.4bn, £4.7bn more than budgeted.

“Rumours that the government is looking at significant cuts in public investment programmes this year to keep within budget are concerning, given the importance to economic growth of infrastructure and the urgent need for upfront investment in technology to fix poorly performing public services. Our hope is that the Chancellor will be able to take a more strategic view in her Autumn Budget in October and in the Spending Review in the spring.”

Month of July 2024

There was a shortfall between receipts and spending of £3.1bn in the month of July 2024, £1.8bn higher than in July 2023 and £3.0bn worse than the budgeted deficit of £0.1bn.

Taxes and other receipts amounted to £99.4bn in July 2024, up £10.3bn or 12% from the previous month driven by self assessment income tax receipts in July, in line with the trend last year. Receipts were £2.0bn or 2% higher than in the same month last year, in contrast with total managed expenditure of £102.5bn, which was £3.8bn or 4% higher than in July 2023. 

Financial year to date

The shortfall between receipts and spending of £51.4bn for the four months to July 2024 was £0.5bn better than in the same period last year, but £4.7bn over budget.

Cumulative taxes and other receipts amounted to £359.3bn in the first third of the financial year, up 2% compared with the same period last year, while total managed expenditure was 2% higher at £410.7bn. This is illustrated by Table 1, which highlights how cuts to employee national insurance rates have been offset by higher income tax, VAT, corporation tax, and non-tax receipts. 

Total managed expenditure for the first four months of £410.7bn was also up by 2% compared with April to July 2023, but this reflected spending on public services up 4%, welfare spending up 6% and gross investment up 10% driven by overruns and construction cost inflation being offset by lower energy-support subsidies and lower debt interest.

The reduction in debt interest of £6.1bn compared with the first four months of last year was driven by a £26.5bn swing in indexation on inflation-linked debt that more than offset a £20.4bn increase in interest on variable and fixed-rate debt.

Table 1: Summary receipts and spending

  Apr-Jul 2024
£bn
 Apr-Jul 2023
£bn
 Change
%
Income tax89.986.4+4%
VAT67.966.0+3%
National insurance53.558.3-8%
Corporation tax34.031.6+8%
Other taxes73.572.1+2%
Other receipts40.537.5+8%
Total receipts359.3351.9+2%
    
Public services(212.2)(204.8)+4%
Welfare(103.1)(97.5)+6%
Subsidies(10.6)(14.0)-24%
Debt interest(46.6)(52.7)-12%
Gross investment(38.2)(34.8)+10%
Total spending(410.7)(403.8)+2%
    
Deficit(51.4)(51.9)-1%

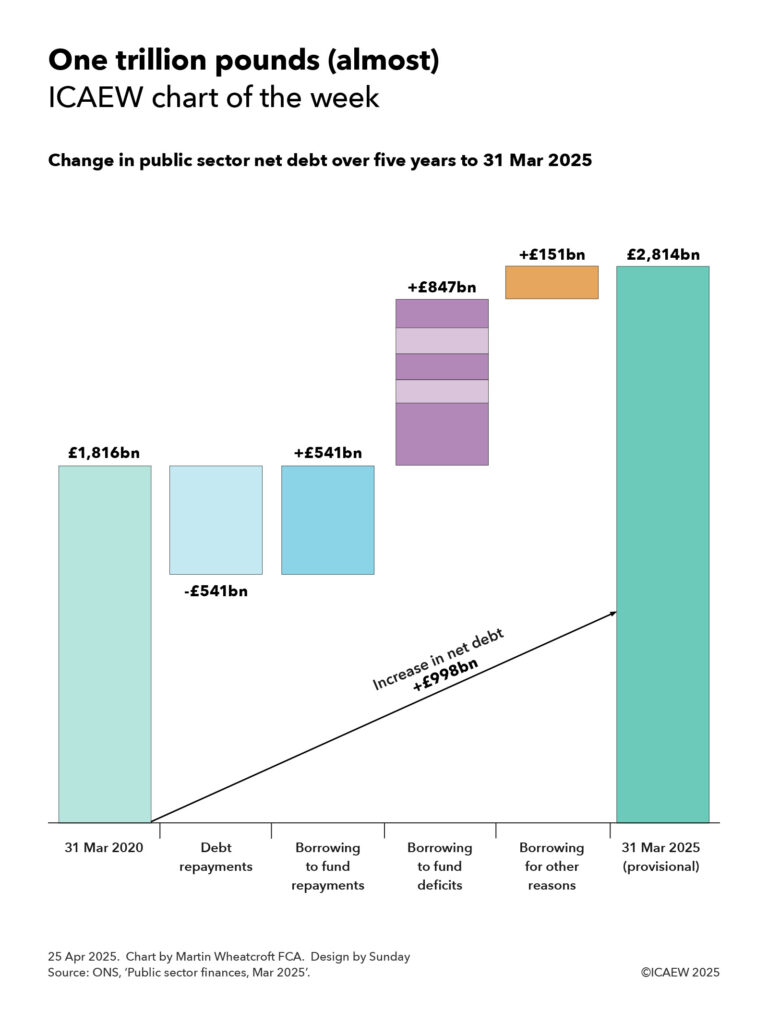
Table 2 summarises how public sector net borrowing (PSNB) to fund the deficit of £51.4bn combined with borrowing of £4.4bn to fund working capital movements, student loans and other financing requirements increased debt by £55.8bn during the first four months of the financial year. As a result, public sector net debt grew to £2,745.9bn on 31 July 2024, which is £931bn or 51% more than the £1,815bn reported for 31 March 2020 at the start of the pandemic.

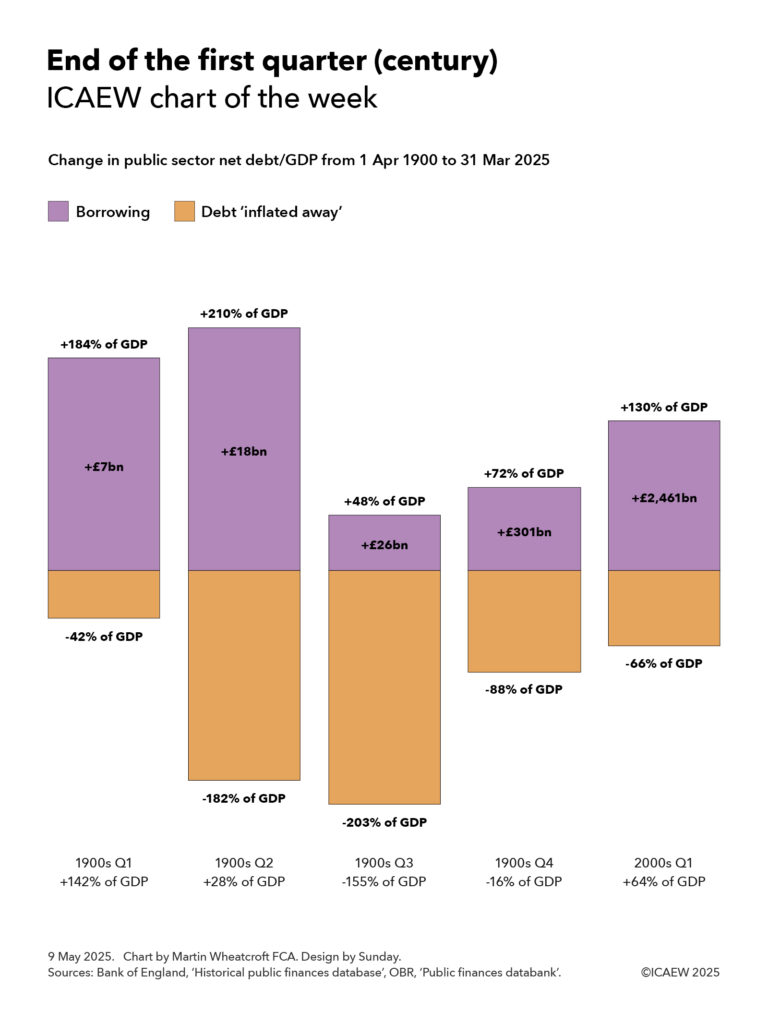
The ratio of net debt to GDP ratio is at the highest it has been since the 1960s, having increased by 1.3 percentage points from 98.1% on 1 April 2024 to 99.4% on 31 July 2024. Borrowing to fund the deficit was equivalent to 1.9% of GDP and other borrowing was equivalent to 0.2%, an increase of 2.1% before being offset by 0.8% from the effect of inflation and economic growth on GDP (usually referred to as ‘inflating away’). Lower inflation this year means this effect is less pronounced than in the same period last year.

Table 2: Public sector net debt and net debt/GDP

 Apr-Jul 2024
£bn
Apr-Jul 2023
£bn
PSNB51.452.3
Other borrowing4.4(11.4)
Net change55.840.9
Opening net debt2,694.12,539.7
Closing net debt2,745.92,580.6
PSNB/GDP1.9%2.0%
Other/GDP0.2%(0.4%)
Inflating away(0.8%)(1.5%)
Net change1.3%0.1%
Opening net debt98.1%95.7%
Closing net debt99.4%95.6%

Public sector net worth, the new balance sheet metric launched by the ONS last year, was -£740bn on 31 May 2024, comprising £1,613bn in non-financial assets and £1,062bn in non-liquid financial assets minus £2,746bn of net debt (£343bn liquid financial assets – £3,089bn public sector gross debt) and other liabilities of £669bn. This is a £67bn deterioration from the start of the financial year and is £123bn more negative than in July 2023.

Revisions and other matters

Caution is needed with respect to the numbers published by the ONS, which are expected to be repeatedly revised as estimates are refined and gaps in the underlying data are filled. This includes local government, where monthly data is based on budget or high level estimates in the absence of monthly data collection.

The latest release saw the ONS reduce the reported deficit for the first three months of the financial year by £1.5bn from £49.8bn to £48.3bn as estimates were revised for new data.

Q1 public finances confirm challenging position for new government

First quarter shortfall between receipts and spending of almost £50bn emphasises the significant challenges facing the Chancellor as she puts together her first Budget.

The monthly public sector finances for June 2024 released by the Office for National Statistics (ONS) on Friday 19 July 2024 reported a provisional deficit for the first three months of the 2024/25 financial year of £49.8bn, £1.1bn better than a year previously but £3.2bn worse than budgeted.

Alison Ring OBE FCA, ICAEW Director of Public Sector and Taxation, says: “This is the first set of public sector finance data since the new government was elected, and today’s numbers set out the size of the obstacle the UK’s leaders face. 

“£14.5bn was borrowed to finance the deficit in June, which although £3.2bn less than in June 2023, brought the total for the first three months of the financial year to £49.8bn, slightly worse than expectations. The latest numbers also highlighted the growing amount of public debt, which stood at 99.5% of GDP or £2,740bn on 30 June 2024. Although total debt interest was lower than last year because of the effect of lower inflation on inflation-linked debt, interest on the bulk of debt continues to rise.

“The high level of debt – and the associated interest bill – means that the new Prime Minister and Chancellor will be faced with some very difficult decisions over the coming months as they decide which elements of their programme to prioritise, and which will have to wait.”

Month of June 2024

Taxes and other receipts amounted to £88.2bn in June 2024, up 2% compared with the same month last year, while total managed expenditure was 2% lower at £102.7bn. This resulted in a reduction of £3.2bn from a fiscal deficit of £17.7bn in June 2023 to £14.5bn in June 2024.

Financial year to date

Taxes and other receipts amounted to £258.0bn in the three months to June 2024, up 1% compared with the same month last year, while total managed expenditure was 1% higher at £307.8bn. This resulted in a reduction of £1.1bn from a fiscal deficit of £50.9bn for the first quarter of 2023/24 to £49.8bn for the first quarter of 2024/25. However, this is £3.2bn more than the £46.6bn for the first quarter included in the Spring Budget 2024.

Table 1 analyses receipts for the first quarter of the financial year, highlighting how cuts to employee national insurance rates have been offset by higher income tax, corporation tax, and non-tax receipts.

Table 1: Summary receipts and spending

Three months to Jun 2024 (£bn) Jun 2023 (£bn)Change (%) 
Income tax 58.1 56.1 +4%
VAT 49.9 49.6 +1%
National insurance 39.7 43.4 -9%
Corporation tax 25.3 23.4 +8%
Other taxes 54.9 54.1 +1%
Other receipts 30.1 27.7 +9%
Total receipts 258.0 254.3 +1%
Public services (158.8) (152.6) +4%
Welfare (76.9) (73.7) +4%
Subsidies (7.8) (11.3) -31%
Debt interest (35.2) (41.1) -14%
Gross investment (29.1) (26.5) +10%
Total spending (307.8) (305.2) +1%
Deficit (49.8) (50.9) -2%

Table 1 also shows how total managed expenditure for the first quarter of £307.8bn was up by 1% compared with April to June 2023, with higher spending on public services and welfare offset by lower energy-support subsidies and lower debt interest. The reduction in the latter of £5.9bn was driven by a £9.2bn reduction in indexation on inflation-linked debt that more than offset a £3.3bn or 44% increase in interest on variable and fixed-rate debt.

Table 2: Public sector net debt

Three months toJun 2024 (£bn)Jun 2023 (£bn)
Deficit (49.8) (50.9)
Other borrowing 3.9 (7.7)
Debt movement (45.9) (58.6)
Opening net debt (2,694.1) (2,539.7)
Closing net debt (2,740.0) (2,598.3)
Net debt/GDP 99.5% 96.7%

Public sector net debt was £2,740bn or 99.5% of GDP on 30 June 2024, just under £46bn higher than at the start of the financial year. At 99.5%, the debt to GDP ratio is the highest it has been since the 1960s.

The increase in the first quarter reflects borrowing to fund the deficit of just under £50bn minus close to £4bn in net cash inflows from loan recoveries and working capital movements in excess of lending by government.

Public sector net debt is £142bn or 5% higher than a year previously, equivalent to an increase of 2.8 percentage points in relation to the size of the economy. It is £925bn or 51% more than the £1,815bn reported for 31 March 2020 at the start of the pandemic and £1,712bn or 167% more than the £1,028bn net debt amount as of 31 March 2007 before the financial crisis, reflecting the huge sums borrowed over the last two decades. 

Public sector net worth, the new balance sheet metric launched by the ONS in 2023, was -£726bn on 31 May 2024, comprising £1,613bn in non-financial assets and £1,070bn in non-liquid financial assets minus £2,740bn of net debt (£340bn liquid financial assets – £3,080bn public sector gross debt) and other liabilities of £669bn. This is a £53bn deterioration from the start of the financial year and is £77bn more negative than the -£649bn net worth number for June 2023.

Revisions and other matters

Caution is needed with respect to the numbers published by the ONS, which are expected to be repeatedly revised as estimates are refined and gaps in the underlying data are filled. 

The latest release saw the ONS increase the reported deficit for the first two months of the financial year by £1.8bn from £33.5bn to £35.3bn as estimates were revised for new data. More significantly, public sector net debt at the end of May 2024 was reduced by £16.3bn to £2,726.6bn to correct for omitted data on Bank of England repo transactions during the current financial year. This reduced the reported debt to GDP ratio for May 2024 by 0.7 percentage points from 99.8% of GDP to 99.1%.

This article was originally published by ICAEW.

ICAEW chart of the week: Debt on the fourth of July

My chart for ICAEW this week ‘celebrates’ US Independence Day by setting out the latest congressional projections for federal debt.

Debt on the fourth of July. 
ICAEW chart of the week. 

Column chart showing projected US federal debt held by the public in $tn (plus as % of GDP) between 2023 and 2034.

2023: $26.2tn (97.3%). 
2024: $28.2tn (99.0%). 
2025: $30.2tn (101.6%). 
2026: $32.1tn (104.1%). 
2027: $33.9tn (106.2%). 
2028: $36.0tn (108.6%). 
2029: $38.0tn (110.5%). 
2030: $40.2tn (112.7%). 
2031: $42.5tn (114.8%). 
2032: $45.0tn (117.1%). 
2033: $47.8tn (119.9%). 
2034: $50.7tn (122.4%). 


04 Jul 2024.   Chart by Martin Wheatcroft FCA. Design by Sunday. 
Source: Congressional Budget Office, ONS, ‘An Update to the Budget and Economic Outlook, June 2024'.


© ICAEW 2024

Two hundred and forty-eight years ago, on 4 July 1776, the United States of America declared its independence from Great Britain, inheriting debts used to finance the revolutionary war but without any tax raising powers to fund repayment of the amounts owed. This was addressed by the adoption of the US Constitution in 1789, which enabled Secretary of the Treasury Alexander Hamilton to raise taxes, start repaying those initial debts, and issue new debt to finance a fledgling nation.

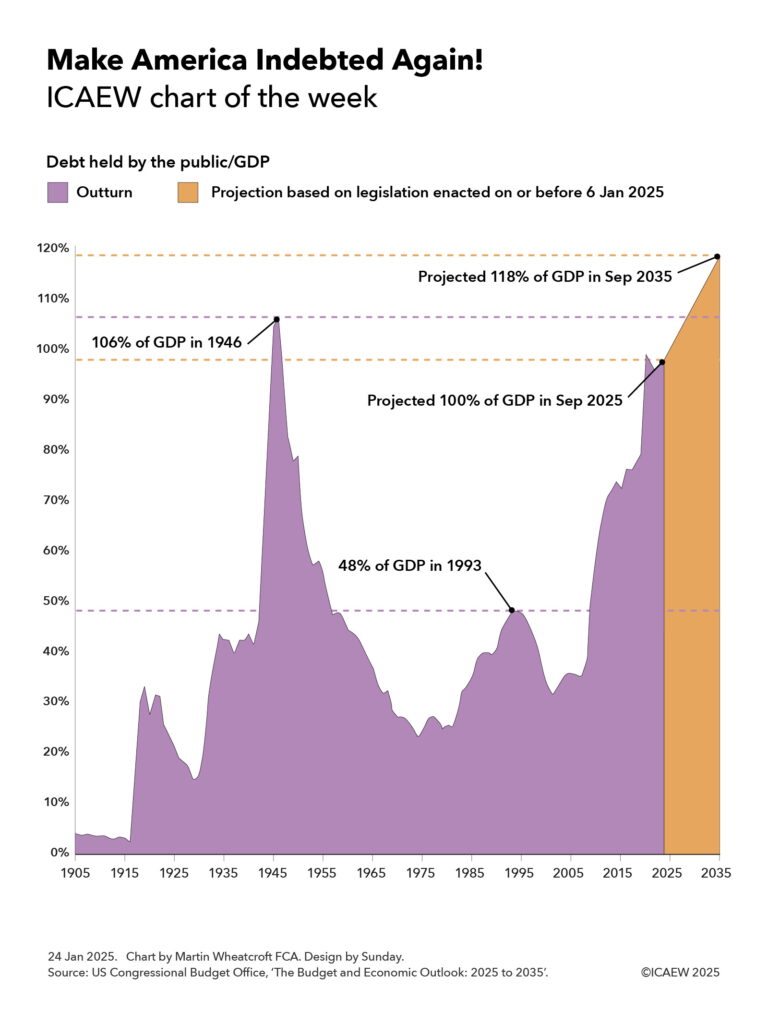
My chart this week illustrates how the US federal government has continued to borrow since then, with the Congressional Budget Office (CBO) reporting that US federal debt held by the public was $26.2tn or 97.3% of GDP in September 2023, on track to reach $28.2tn or 99.0% of GDP on 30 September 2024, before rising to a projected $50.7tn or 122.4% on 30 September 2034. 

Debt on 4 July this year is estimated to be close to $27.8tn. 

The projected rise in debt held by the public over the coming decade is based on extrapolating the gap between federal revenues and spending of around $160bn a month in the current financial year, based on tax and spending legislation enacted at 12 May 2024 together with the CBO’s own assessment of the administration’s financial plans (for example over student loan relief) and assumptions around factors such as interest rates and economic growth.

However, the CBO is keen to stress that these numbers are not a forecast. They say: “The baseline projections are meant to provide a benchmark that policymakers can use to assess the potential effects of changes in policy; they are not a forecast of future budgetary outcomes. Future legislative action could lead to markedly different outcomes. But even if federal laws remained unaltered for the next decade, actual budgetary outcomes would probably differ from CBO’s baseline projections, not only because of unanticipated economic conditions, but also because of the many other factors that affect federal revenues and outlays.”

The challenge for the US is that despite almost 250 years of taxation with representation, that representation finds it difficult to raise taxes to bring debt down, often choosing to cut taxes and increase borrowing instead. 

Whether that will change, or whether debt markets force it to change, remains a big unknown in the experiment commenced by George Washington and Alexander Hamilton all those years ago.

This chart was originally published by ICAEW.

New government to inherit tough public finances

Public sector net debt has passed £2.7tn for the first time. In May the debt increased by £49bn from £2,694bn to £2,743bn, 51% higher than it was in March 2020 at the start of the pandemic.

The monthly public sector finances for May 2024 released by the Office for National Statistics (ONS) on Friday 21 June 2024 reported a provisional deficit for the first two months of the 2024/25 financial year of £33.5bn, £1.5bn better than the £35.0bn predicted by the Office for Budget Responsibility (OBR) and £0.4bn higher than in April and May 2023.

An ICAEW spokesperson said: “Today’s numbers show that public sector net debt continues to grow, up from £2.69tn in April to £2.74tn in May, the first time it has exceeded £2.7tn.

“Net debt is now 51% higher than it was at the start of the pandemic in March 2020, and 167% higher than it was in March 2010, pushed up by the spikes in spending during the pandemic and to offset energy bills, as well as borrowing to fund day-to-day spending and investment. High borrowing costs and the financial consequences of more people living longer mean that the public finances are significantly weaker and less resilient than they were 14 years ago.

“When the country goes to the polls on 4 July, the reality is that whoever wins power will inherit an extremely challenging fiscal position that will hamper their ability to turn the country around.”

Month of May 2024

Taxes and other receipts amounted to £85.1bn in May 2024, up 2% compared with the same month last year, while total managed expenditure was also 2% higher at £100.1bn.

The resulting fiscal deficit of £15.0bn for the month was £0.8bn higher than in May 2023.

Financial year to date

As summarised in Table 1, total receipts in April and May 2024 of £170.4bn were 2% higher than in the same two months last year, with the cuts to employee national insurance rates offset by higher income tax, corporation tax, and non-tax receipts.

Table 1: Summary receipts and spending

Two months toMay 2024
£bn
May 2023
£bn
Change
%
Income tax38.236.8+4%
VAT33.933.6+1%
National insurance25.928.2-8%
Corporation tax16.615.5+7%
Other taxes36.035.2+2%
Other receipts19.818.5+7%
Total receipts170.4167.8+2%

Public services

(108.3)

(104.5)

+4%
Welfare(51.4)(49.1)+5%
Subsidies(5.2)(7.8)-33%
Debt interest(21.4)(21.6)-1%
Gross investment(17.6)(17.9)-2%
Total spending(203.9)(200.9)+1%

Deficit

(33.5)

(33.1)

+1%

Table 1 also shows how total managed expenditure for the two months of £203.9bn was up by more than 1% compared with April and May 2023, with higher spending on public services and welfare offset by lower energy-support subsidies and marginally lower debt interest. The latter was driven by significantly lower indexation on inflation-linked debt offsetting the much higher rates of interest payable on variable rate and refinanced fixed-rate debt.

Table 2: Public sector net debt 

Two months toMay 2024
£bn
May 2023
£bn
Deficit(33.5)(33.1)
Other borrowing(10.2)2.1
Debt movement(43.7)(31.0)
Opening net debt(2,699.2)(2,539.7)
Closing net debt(2,742.9)(2,570.7)

Net debt/GDP

99.8%

96.1%

Public sector net debt as of 31 May 2024 was £2,743bn or 99.8% of GDP, just under £44bn higher than at the start of the financial year. The increase reflects borrowing to fund the deficit of £33.5bn and £10.2bn borrowed to fund lending by government and other cash requirements, net of loan recoveries.

Public sector net debt was £172bn or 7% higher than a year previously, and 3.7 percentage points higher in relation to the size of the economy.

Public sector net debt is £928bn or 51% more than the £1,815bn reported for 31 March 2020 at the start of the pandemic and £1,715bn or 167% more than the £1,028bn net debt amount as of 31 March 2007 before the financial crisis, reflecting the huge sums borrowed over the last 14 years.

Public sector net worth, the new balance sheet metric launched by the ONS in 2023, was -£726bn on 31 May 2024, comprising £1,613bn in non-financial assets and £1,074bn in non-liquid financial assets minus £2,743bn of net debt (£300bn liquid financial assets – £3,043bn public sector gross debt) and other liabilities of £670bn. This is a £47bn deterioration from the start of the financial year and is £95bn more negative than the -£631bn net worth number for May 2023.

Revisions and other matters

Caution is needed with respect to the numbers published by the ONS, which are expected to be repeatedly revised as estimates are refined and gaps in the underlying data are filled. 

The latest release saw the ONS reduce the reported deficit for April 2024 by £2.1bn from £20.5bn to £18.4bn and revise the deficit for the year to March 2024 up by £0.7bn from £121.4bn to £122.1bn as estimates of tax receipts and expenditure were updated for better data.

This article was originally published by ICAEW.

ICAEW chart of the week: IMF Fiscal Monitor

Our chart this week finds that the UK is ranking highly in the IMF’s latest five-year forecasts for general government net debt.

Bar chart

General government net debt/GDP: 2029 forecast

Emerging and developing economies (green bars)
World (purple bar)
Advanced economies (blue bar)
UK (red bar)

Kazakhstan (green) 8%
Canada (blue) 13%
Saudi Arabia (green) 22%
Iran (green) 23%
Australia (blue) 24%
South Korea (blue) 29%
Türkiye (green) 30%
Indonesia (green) 37%
Germany (blue) 43%
Netherlands (blue) 43%
Nigeria (green) 47%
Mexico (green) 51%
Poland (green) 55%
Egypt (green) 56%
Pakistan (green) 61%
Brazil (green) 70%
World (purple) 79%
South Africa (green) 84%
Spain (blue) 92%
UK (red) 98%
France (blue) 107%
US (blue) 108%
Italy (blue) 136%
Japan (blue) 153%


18 Apr 2024.
Chart by Martin Wheatcroft FCA. Design by Sunday.
Source: IMF Fiscal Monitor: 17 Apr 2024.

©️ ICAEW 2024

The International Money Fund (IMF) released its latest IMF Fiscal Monitor on 17 April 2024, highlighting how public debts and deficits are higher than before the pandemic and public debts are expected to remain high. The IMF says: “Amid mounting debt, now is the time to bring back sustainable public finances”, commenting that as prospects for a global economic soft landing have improved, it is time for action to bring government finances back under control. 

Our chart this week illustrates how the UK is one of the ‘leading’ nations in government borrowing, with general government net debt projected by the IMF to reach 98% of GDP by 2029, compared with 92.5% in 2023. (Note: general government net debt is different to the public sector net debt measure used in the UK public finances – the latter includes the Bank of England and other public corporations.)

The chart illustrates how the major countries with the largest debt burdens tend to be advanced economies, with Spain (92% of GDP), the UK (98%), France (107%), US (108%), Italy (136%) and Japan (153%) having debt levels close to, or exceeding, the sizes of their economies.

Some countries are in much better fiscal positions, with Germany expected to bring its general government net debt down to 43% of GDP by 2029, while the Netherlands (43%), South Korea (29%), Australia (24%) and Canada (13%) also have relatively low levels of public debt compared with other advanced economies.

Emerging market ‘middle-income’ and ‘low-income’ developing countries often have much lower levels of public debt than advanced countries, often simply because it is more difficult for them to borrow to the same extent as well as not having the same scale of welfare provision as richer countries to finance. Examples include Kazakhstan (projected to have a general government debt of 8% of GDP in 2029), Saudi Arabia (22%), Iran (23%), Türkiye (30%) and Indonesia (37%). However, that does not stop some emerging and developing countries borrowing more, such as Nigeria (47%), Mexico (51%), Poland (55%), Egypt (56%), Pakistan (61%), Brazil (70%) and South Africa (84%).

Not shown in the chart are China and India for which no net debt numbers are available. The IMF projects them to have general government gross debt in 2029 of 110% and 78% of GDP respectively, indicating how their public debts have grown substantially in recent years. However, without knowing their levels of cash holdings it is less clear where they stand in the rankings.

Also not shown is Norway, the only country with negative general government net debt reported by the IMF. Norway’s general government net cash is projected to reach 139% of GDP in 2029, up from 99% in 2023.

As with all metrics, there are some issues in comparing the circumstances of individual countries. Many countries will also have investments, other public assets, or natural resource rights that are not netted off against debt, while many will also have other liabilities or financial commitments that aren’t counted within debt. For example, the UK has significant liabilities for unfunded public sector pensions as well as even larger financial commitments to the state pension, either of which, if included, would move the UK above the US in the rankings.

The IMF believes that as the world recovers from the pandemic and inflation is brought under control, it is important for countries to start tackling the deficits in the public finances and start bringing down the level of public debt. 

This may be difficult for countries such as the UK where significant pressures on the public finances mean public debt is expected to increase over the medium term rather than fall.

This chart was originally published by ICAEW.

ICAEW publishes in-depth Fiscal Insight on the Spring Budget

Now that the dust has settled on last month’s Spring Budget, ICAEW has published a more detailed analysis on the implications for the public finances.

ICAEW’s Fiscal Insight on the Spring Budget 2024 provides an analysis of the key numbers, risks to the Office for Budget Responsibility forecast, tax measures, forecast revisions since the 2023 Autumn Statement, the fiscal position in the 2024/25 Budget year, borrowing over the next five years, the calculation of underlying debt, the £1.2trn that HM Treasury needs to raise from debt investors, and our conclusions on what the numbers mean for the public finances.

Key points highlighted in the report include:

Headlines

  • Modest improvement in forecasts and small tax increases ‘pay for’ national insurance cut.
  • Headroom of £9bn against the Chancellor’s primary fiscal rule is tiny compared with risks.
  • End of low-cost borrowing is hampering investment in infrastructure and public services.
  • Weak economy, high debt, demographic challenges, underperforming public services.
  • No long-term fiscal strategy.

Key numbers

  • Tax and other receipts of £1,139bn in 2024/25, equivalent to £1,375 per person per month.
  • Public spending of £1,226bn in 2024/25, equivalent to £1,480 per person per month.
  • Deficit projected to fall by a quarter to £87bn in 2024/25 and gradually to £39bn in 2028/29.
  • Headline debt expected to reach £2.8trn by March 2025 and £3.0trn by March 2029.
  • Underlying debt/GDP forecast to increase from 88.8% to 93.2% and then fall to 92.9%.

Conclusions

  • Difficult choices on spending deferred until after the general election.
  • Post-election tax increases likely, irrespective of who wins the general election.
  • A badly designed fiscal rule driving poor decisions and unrealistic spending forecasts.
  • Predicted reduction in the deficit to below 2% of GDP by 2027/28 is unlikely to occur.
  • Further pre-election tax cuts could affect credibility with debt markets. 

Alison Ring OBE FCA, ICAEW Director for Public Sector and Taxation, is quoted in the Fiscal Insight as follows:

“The principal story of the Spring Budget has been how the Chancellor was able to find room for tax cuts while still meeting his fiscal targets to ‘bring down debt and the deficit’.

“This is a frustrating narrative as it misses the bigger picture of public finances that are on an unsustainable path, with little sign of a long-term fiscal strategy to address demographic change, growing balance sheet liabilities, underperforming public services, rising debt interest, or resilience against future economic shocks.

“Debt is high and projected to be even higher in five years’ time than it is today. ‘Headroom’ is tiny in context of trillions of pounds of tax receipts and public spending over the next five years and forecasts that don’t reflect government practice in freezing fuel duties nor likely spending increases from the now postponed Spending Review.

“And we have a fiscal target that discourages essential infrastructure investment while at the same time never needing to be achieved as it is rolled forward each year.

“All of our fiscal eggs are now in a basket labelled ‘hope’ [for economic growth].”

Fiscal Insight

Read the full Fiscal Insight report, which provides detailed analysis on the Spring Budget’s implications for the public finances.

For further coverage, including more detailed information about tax measures, visit ICAEW’s Spring Budget 2024 site by clicking here.

This article was written by Martin Wheatcroft FCA on behalf of ICAEW and was originally published by ICAEW.

ICAEW chart of the week: Whole of Government liabilities

My chart for ICAEW this week looks at how liabilities in the UK’s public balance sheet have risen significantly over the five years to March 2022.

Column chart:

Whole of Government liabilities
ICAEW chart of the week

Employee pensions (blue)
Payables and provisions (purple)
Financial liabilities (orange)

31 Mar 2018: £2.1trn financial liabilities + £0.6trn payables and provisions + £1.9trn employee pensions = £4.6trn total

31 Mar 2019: £2.2trn + £0.5trn + £1.9trn = £4.6trn

31 Mar 2020: £2.2trn + £0.6trn + £2.2trn = £5.0trn

31 Mar 2021: £2.6trn + £0.6trn + £2.3trn = £5.5trn

31 Mar 2022: £2.9trn + £0.8trn + £2.6trn = £6.3trn


4 Apr 2024.
Chart by Martin Wheatcroft FCA. Design by Sunday.
Source: HM Treasury, 'Whole of Government Accounts 2017/18 to 2021/22'.

(c) ICAEW 2024.

HM Treasury published the Whole of Government Accounts (WGA) 2021/22 on 26 March 2024, just under two years after the balance sheet date. This is a significant improvement from the 27 months it took to publish the 2020/21 edition, but is still a lot longer than the nine or 10 months HM Treasury is aiming for in the medium term, or the four months or less that it generally takes listed companies to publish their consolidated financial statements.

WGA are consolidated financial statements for more than 10,000 or so organisations in the UK public sector, including central government departments, devolved administrations, regional and local authorities, the Bank of England and other public corporations, government agencies, schools, hospitals, police and fire services, transport authorities and other public bodies. They are prepared in line with international generally accepted accounting practice – International Financial Reporting Standards – different to the statistical standards used by governments to report fiscal numbers in National Accounts.

My chart for ICAEW illustrates how the liability side of the balance sheet has grown over the five-year period, from £4.6trn on 31 March 2018 and 2019 to £5trn on 31 March 2020, £5.5trn on 31 March 2021 and £6.3trn on 31 March 2022.

This reflects how debt liabilities increased from £2.1trn to £2.9trn over that time, with huge sums borrowed in 2020/21 and 2021/22 during the coronavirus pandemic. 

The other big liability in the balance sheet is the net pension obligation for public sector employees, which was £1.9trn on 31 March 2018 but had risen to £2.6trn by 31 March 2022, with falling discount rates a key factor in that rise. The latter comprises liabilities of £2.5trn for unfunded pension schemes and net liabilities of £0.1trn (£0.5trn liabilities less £0.4trn in assets) for local government and other funded pension schemes.

The balance sheet does not include the much larger commitment to pay the state pension, which as a welfare benefit is accounted for when incurred.

Total liabilities of £6.3trn on 31 March 2022 are equivalent to £93,000 per person in the UK, comprising £43,000 in financial liabilities, £11,000 in payables and provisions, and £39,000 in for public sector employee pensions.

Not shown in the chart is the asset side of the balance sheet, with assets of £2.4trn on 31 March 2022 or £36,000 per person, comprising fixed assets of £1.4trn (£20,500 per person), investments of £0.5trn (£7,000), receivables and other of £0.2trn (£3,500) and cash and other financial assets of £0.3trn (£5,000). This results in an overall net liability position of £3.9trn or £57,000 per person on 31 March 2022. 

The good news is that HM Treasury is working hard to reduce the delays in producing the WGA, which means it shouldn’t be too long before we discover what is in the 31 March 2023 balance sheet. This is expected to show an improvement, as although the government has continued to borrow, pushing up financial liabilities, the net present value of pension obligations and provisions should fall significantly as discount rates have risen sharply since March 2022.

This chart was originally published by ICAEW.