ICAEW chart of the week: global military spending

19 March 2021: The UK’s Integrated Review is the inspiration for this week’s chart, illustrating the 20 countries around the world that spend the most on their militaries.

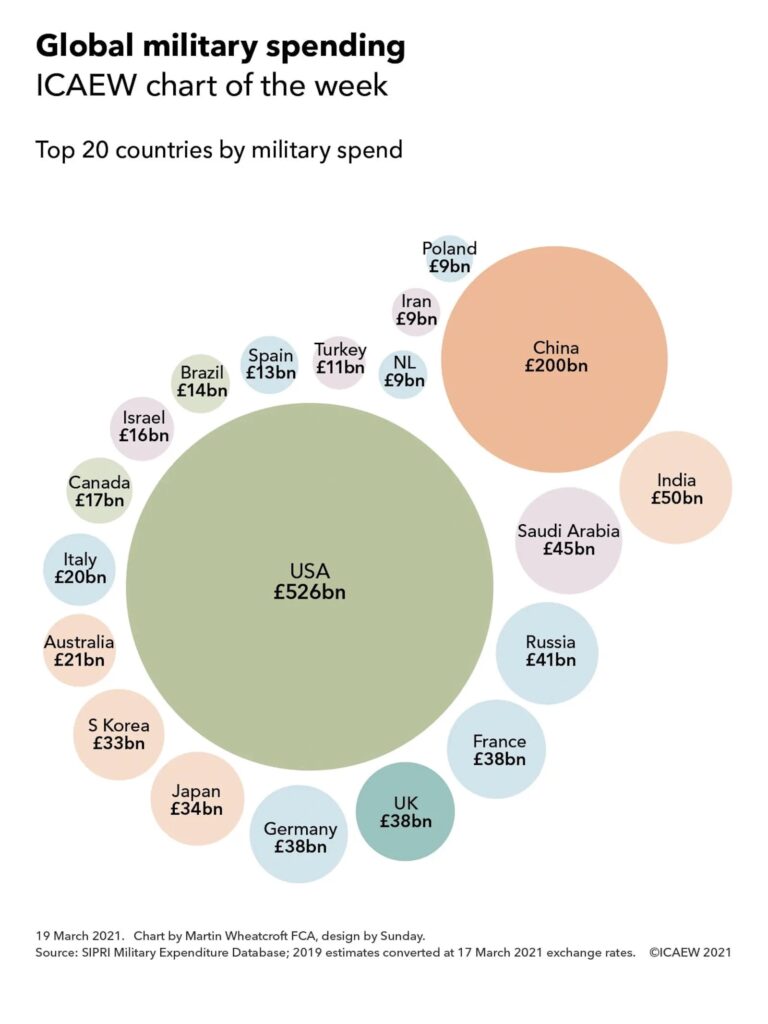
Chart showing global military spending in 2019 led by USA (£526bn) and China (£200bn) followed by 18 other countries - see text below the chart for details.

The UK Government launched its Integrated Review of Security, Defence, Development and Foreign Policy on 16 March 2021, setting out a vision for the UK’s place in the world following its departure from the European Union and in the context of increasing international tensions and emerging security threats.

At the core of the Integrated Review is security and defence, and ICAEW’s chart of the week illustrates one aspect of that by looking at military spending around the world. 

The chart shows spending by the top 20 countries, which together comprise in the order of £1.2tn of estimated total military spending of around £1.4tn to £1.5tn globally in 2019 – an almost textbook example of the 80:20 rule in action.

More than a third of the total spend is incurred by just one country – the USA – which spent in the order of £526bn in 2019 converted at current exchange rates. The next biggest were China and India at £200bn and £50bn respectively, although differences in purchasing power mean that they can afford many more soldiers, sailors and aircrew for the same amount of money. This is followed by Saudi Arabia (£45bn), Russia (£41bn), France (£38bn), the UK (£38bn), Germany (£38bn), Japan (£34bn), South Korea (£33bn), Australia (£21bn), Italy (£20bn), Canada (£17bn), Israel (£16bn), Brazil (£14bn), Spain (£13bn), Turkey (£11bn), the Netherlands (£9bn), Iran (£9bn) and Poland (£9bn).

Exchange rates affect the relative orders of many countries in the list, for example between Russia, France, the UK and Germany which can move up or down according to movements in their currencies, while there are a number of caveats over the estimates used given the different structures of armed forces around the world and a lack of transparency in what is included or excluded in defence budgets in many cases.

In addition, the use of in-year military spending does not necessarily translate directly into military strength. Military capabilities built up over many years or in some cases (such as the UK) over many centuries need to be taken into account, as do differing levels of technological development and spending on intelligence services, counter-terrorism and other aspects of security. Despite these various caveats, estimated military spending still provides a useful proxy in understanding the global security landscape and in particular highlights the UK’s position as a major second-tier military power – in the top 10 countries around the world.

Global Britain in a Competitive Age: the Integrated Review of Security, Defence, Development and Foreign Policy sets out some ambitious objectives for security and defence, which it summarises as follows: “Our diplomatic service, armed forces and security and intelligence agencies will be the most innovative and effective for their size in the world, able to keep our citizens safe at home and support our allies and partners globally. They will be characterised by agility, speed of action and digital integration – with a greater emphasis on engaging, training and assisting others. We will remain a nuclear-armed power with global reach and integrated military capabilities across all five operational domains. We will have a dynamic space programme and will be one of the world’s leading democratic cyber powers. Our diplomacy will be underwritten by the credibility of our deterrent and our ability to project power.”

The estimates of military spending used in the chart were taken from the Stockholm International Peace Research Institute (SIPRI)’s Military Expenditure Database, updated to current exchange rates.

This chart was originally published by ICAEW.

ICAEW chart of the week: China

18 September 2020: The #icaewchartoftheweek is on China: with 1.4bn people, the largest country in world by population.

Following up on our chart on the United States of America a couple of weeks ago, this time we are looking at China, which has more than four times as many people as the USA and more than 20 times as many as the UK.

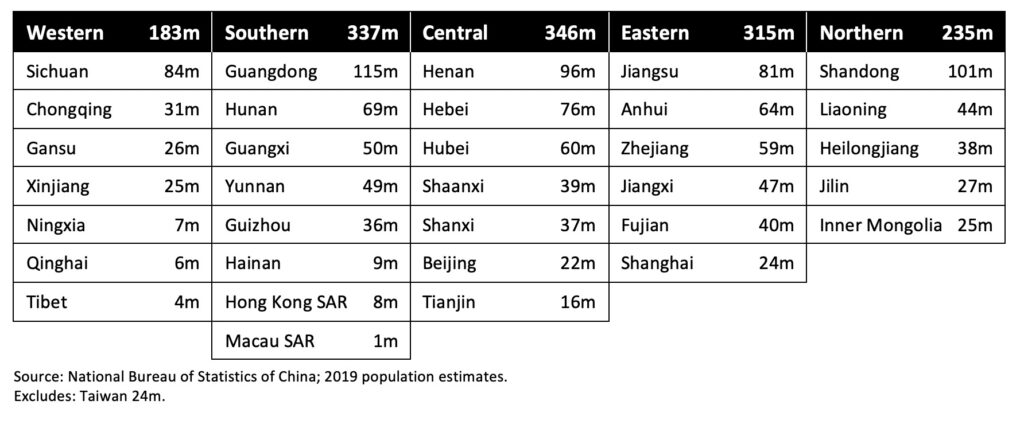
There are a number of different ways of allocating China’s 33 first-level administrative divisions (excluding Taiwan) into wider regions, but for this particular chart we have gone with the five military districts used by the People’s Liberation Army, which divides up the provinces into Western, Southern, Central, Eastern and Northern China.

Three regions are similar in population size to the USA, with the 346m population of Central China and 337m of Southern China exceeding the USA’s 332m, while Eastern China with 315m people is not far behind. Northern China with 235m people has about 70% of the numbers in the USA, while Western China with 183m has just over half as many. They all substantially exceed the UK’s 69m population.

At 9.60m square kilometres China is marginally smaller than the USA’s 9.84m, although if inland waters are excluded this turns around with China’s 9.33m square kilometre land area exceeding the USA’s 9.15m. Hence, there is around four times as much space per person in the USA than in China, which in turn has twice as much space per person as for the UK.

Economically, China was around 30% bigger than the USA on a ‘purchasing power parity’ (PPP) basis in 2019, when US GDP was $21.4tn. However, based on actual exchange rates, China’s economy was around two-thirds of the size. Economic activity per person in China in 2019 was around $20,000 on a PPP basis and $10,000 on an actual exchange rate basis, compared with the $64,000 or so per person that was generated in the USA. This compares with the UK, where economic activity in 2019 was in the order of $45,000 per person using PPP and $41,000 using actual exchange rates.

China is not expected to remain the largest country by population for much longer, with India’s just under 1.4bn people expected to grow at a faster rate to overtake China within the next decade.

Image of table showing population by province within each region. For readable version of the table please go to the original ICAEW chart using the link at the end of this post.

This chart was originally published on the ICAEW website.

ICAEW chart of the month: Cabinet government

26 June 2020: The prime minister has announced a reduction in the number of government departments. How big is the cabinet compared to the rest of the world?

The news that the UK Government is reducing the number of government departments by one prompts the #icaewchartofthemonth to take a look at the size of government executives across the world.
 
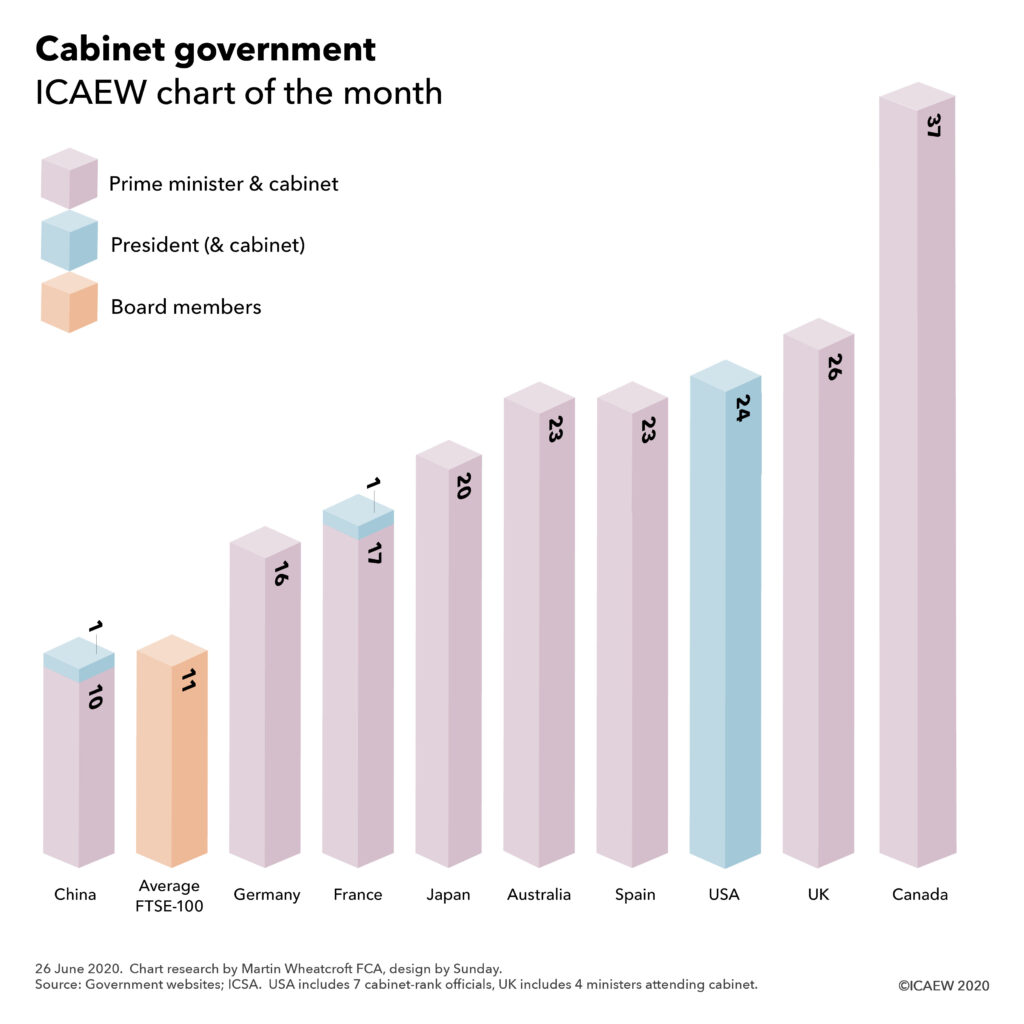
As the chart highlights, with 26 members, the UK cabinet is one of the largest amongst major economies – comprising the prime minister Boris Johnson, 21 department ministers and four ‘ministers attending cabinet’. This does not include the Cabinet Secretary or other officials, meaning that cabinet meetings generally involve more than 30 people in total.
 
Compare that with the more compact 16-member German federal cabinet (Chancellor Angela Merkel and 15 departmental ministers) and the ten-member Chinese state council executive (comprising the premier Li Keqiang, five vice-premiers and four other senior departmental ministers).
 
It is certainly much larger than FTSE-100 company boards, where the average size is 11, and very few listed companies have more than 16 board members.
 
There is some debate around whether reducing the size of the UK cabinet would be more conducive to effective government. Some suggestions that the merger of the Department for International Development (DfID) with the Foreign & Commonwealth Office (FCO) to form the new Foreign, Commonwealth & Development Office (FCDO) in September is the first step on the way to that goal – with further mergers possible. However, although there will be one fewer departmental minister, there is a reasonable prospect of the minister responsible for development at the FCDO being invited to attend cabinet given its importance to the government’s global agenda.
 
Of course, merging departments is not the only way to achieve a slimmer cabinet – for example, the 31-member Russian cabinet (not shown in the chart) rarely meets as one body. Instead, there are regular meetings of the 10-strong prime ministerial group (the prime minister Mikhail Mishustin and nine deputy prime ministers) and occasional meetings of the 20-strong cabinet praesidium that includes the most senior ministers as well.
 
The UK Cabinet also works in this way to a certain extent, with critical decisions often being made in smaller groupings of senior ministers, such as the 9-member National Security Council, the 9-member Climate Change Committee or the 12-strong EU Exit Operations Committee for example. Canada, with its 37-member cabinet, also operates through a series of cabinet committees ranging from around 8 to 15 members. However, in both cases, the full cabinet still meets regularly and remains the formal executive body for authorising government actions.
 
With rumours of a cabinet reshuffle in the UK this autumn, it will be interesting to see whether moves to reduce the size of the cabinet will actually take place or whether we will see further development of cabinet committees as the places to be ‘in the room where it happens’.

This chart of the month was originally published by ICAEW.

ICAEW chart of the month: UK international trade

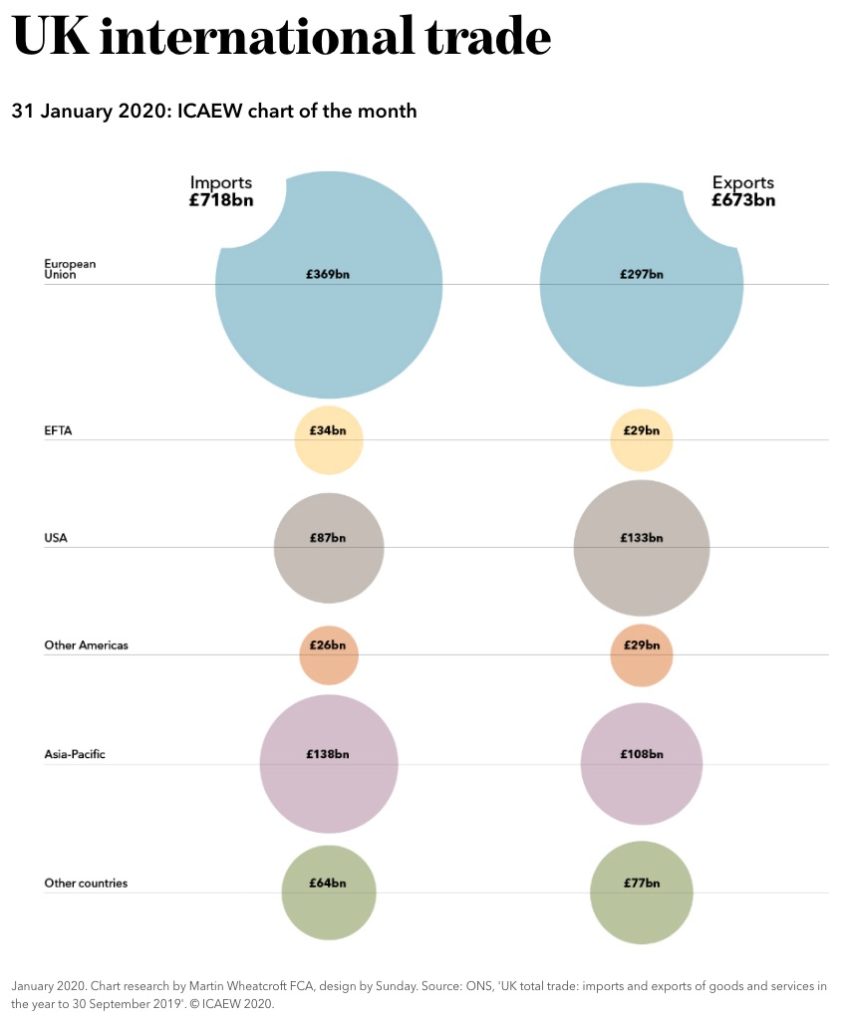
Imports £718bn: EU £369bn, EFTA £34bn, USA £87bn, Other Americas £26bn, Asia-Pacific £138bn, Other £64bn. Exports £673bn: EU £297bn, EFTA £29bn, USA £133bn, Other Americas £29bn, Asia-Pacific £108bn, Other £77bn.

With recent changes in ICAEW communications, the ICAEW Public Sector team has started an #icaewchartofthemonth to complement the #icaewchartoftheweek.

The first #icaewchartofthemonth was published on the ICAEW’s Insights Hub (icaew.com/insights) on Friday 31 January 2020 and is on the UK’s international trade. It highlights how important the £718bn in imports and £673bn in exports in the year to 30 September 2019 are to the economy of the UK.

As the UK Government starts to negotiate new trade arrangements with countries around the world, the EU will be the highest priority. Imports into the UK of £369bn represent 51% of total imports and exports to the 27 EU countries of £297bn are 44% of total exports. This is followed by the USA, where imports of £87bn and exports of £133bn represent 12% and 20% respectively.

Trade relationships with countries in the Asia-Pacific region will also be very important, in particular China (imports £60bn and exports £39bn), Japan (£17bn and £15bn) and the 10-country Association of South East Asian Nations (£22bn and £19bn).

https://www.icaew.com/insights/features/2020/jan-2020/uk-international-trade