A difficult winter ahead for the public finances

23 December 2020: The UK public sector incurred a £31.6bn deficit in November, bringing the total shortfall over eight months to £240.9bn. Debt reached an all-time high of £2.1tn.

Commenting on the latest public sector finances for November 2020, published on Tuesday 22 December 2020 by the Office for National Statistics (ONS), Alison Ring sector director at ICAEW, said: 

“A slightly more optimistic forecast for GDP from the Office for Budget Responsibility last month resulted in the UK’s debt to GDP ratio being revised downwards, despite public sector debt having reached an all-time high of £2.1tn in November. However, this optimism may prove to have been premature, with reports suggesting another national lockdown in the new year and disruption in international trade foretelling a potentially difficult winter ahead for the economy and the public finances. 

Prospects for the spring will depend on how quickly the vaccine can be rolled out, whether testing and tracing can deliver rapid and reliable results, and the extent to which disruption at borders now and after 1 January can be minimised.”

Public sector finances for November

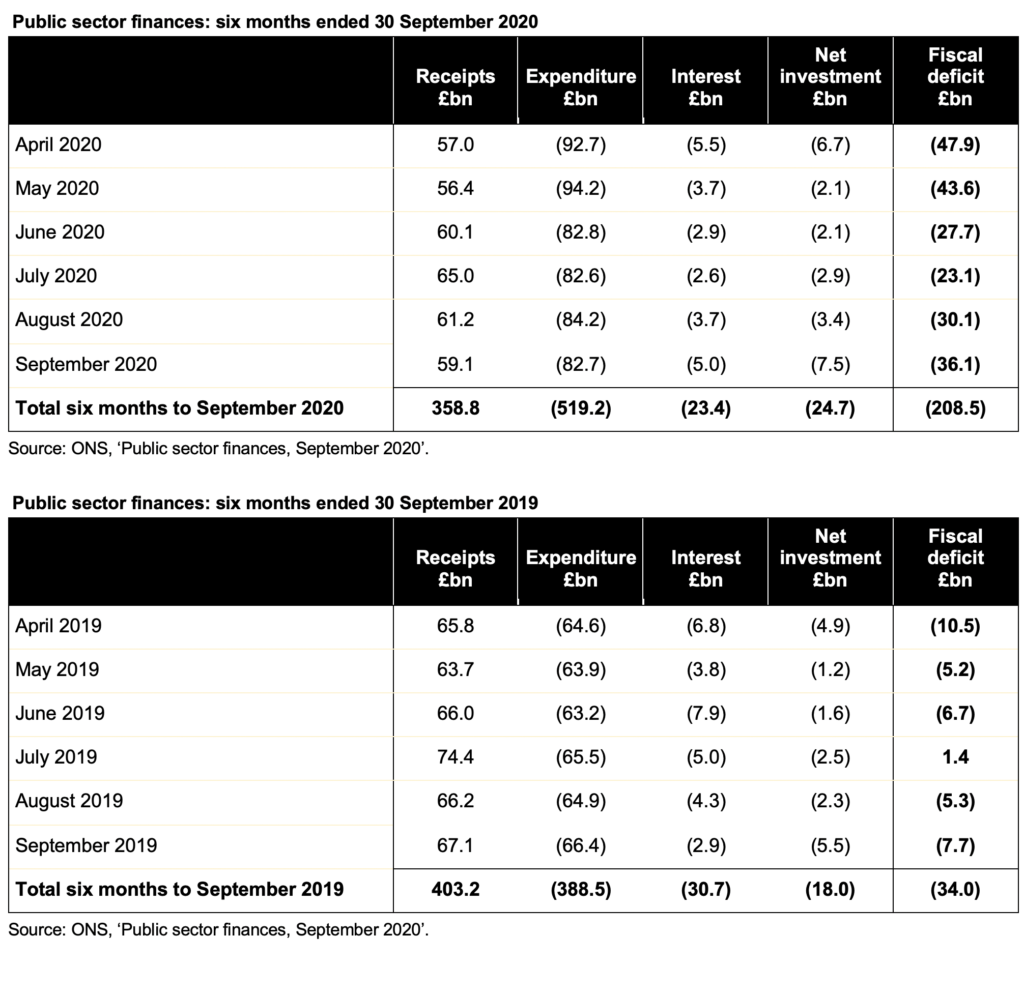
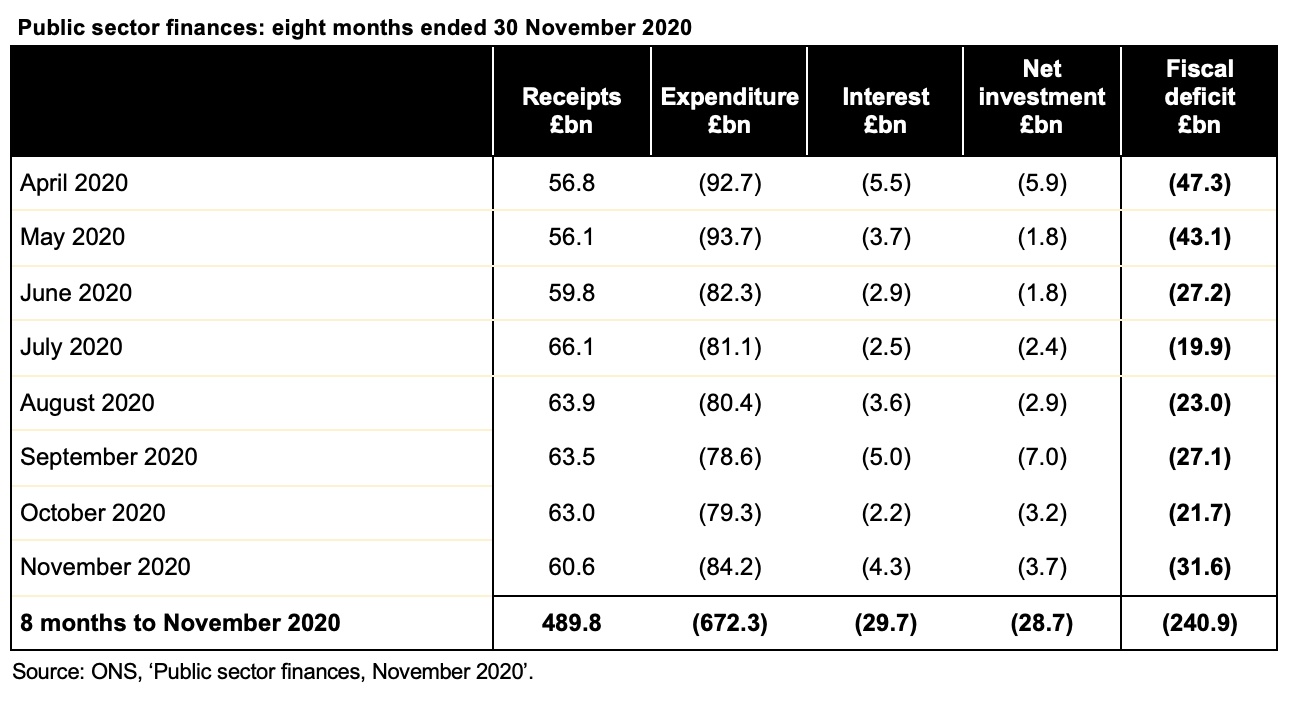
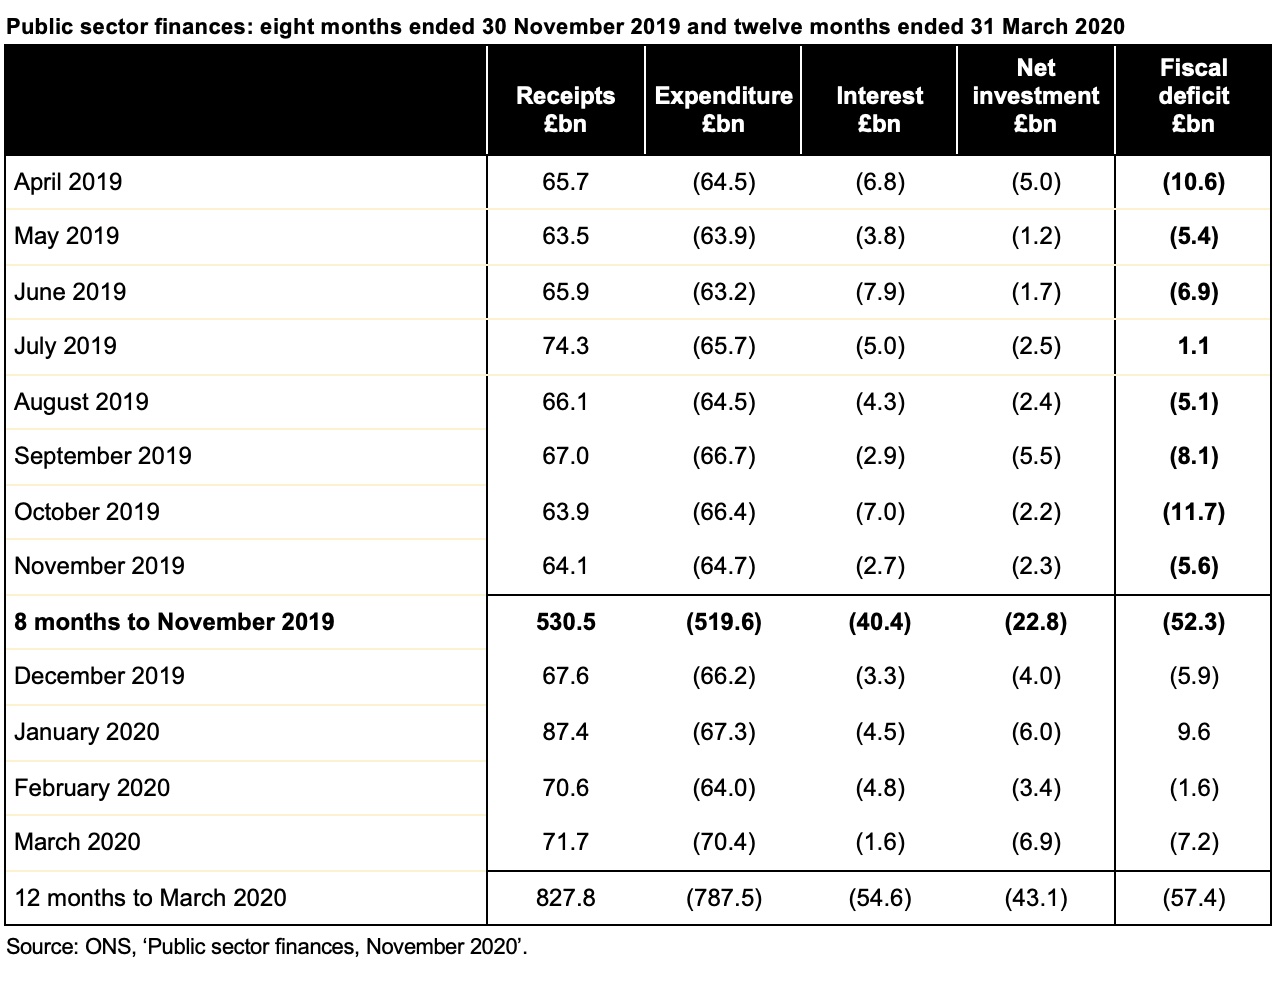
The latest public sector finances reported a deficit of £31.6bn in November 2020, a cumulative total of £240.9bn for the first eight months of the financial year. This is £188.6bn more than the £52.3bn recorded for the same period last year.

Falls in VAT, corporation tax and income tax drove lower receipts, while large-scale fiscal interventions resulted in much higher levels of expenditure. Net investment is greater than last year, as planned, while the interest line has benefited from ultra-low interest rates.

Public sector net debt increased to £2,099.8bn or 99.5% of GDP, an increase of £301.6bn from the start of the financial year and £303.0bn higher than in November 2019. This reflects £60.7bn of additional borrowing over and above the deficit, most of which has been used to fund coronavirus loans to business and tax deferral measures.

Table of results for the month of November and for the 8 months then ended, together with variances against the prior year. Click on the link at end of post to visit the original ICAEW article for a readable version.

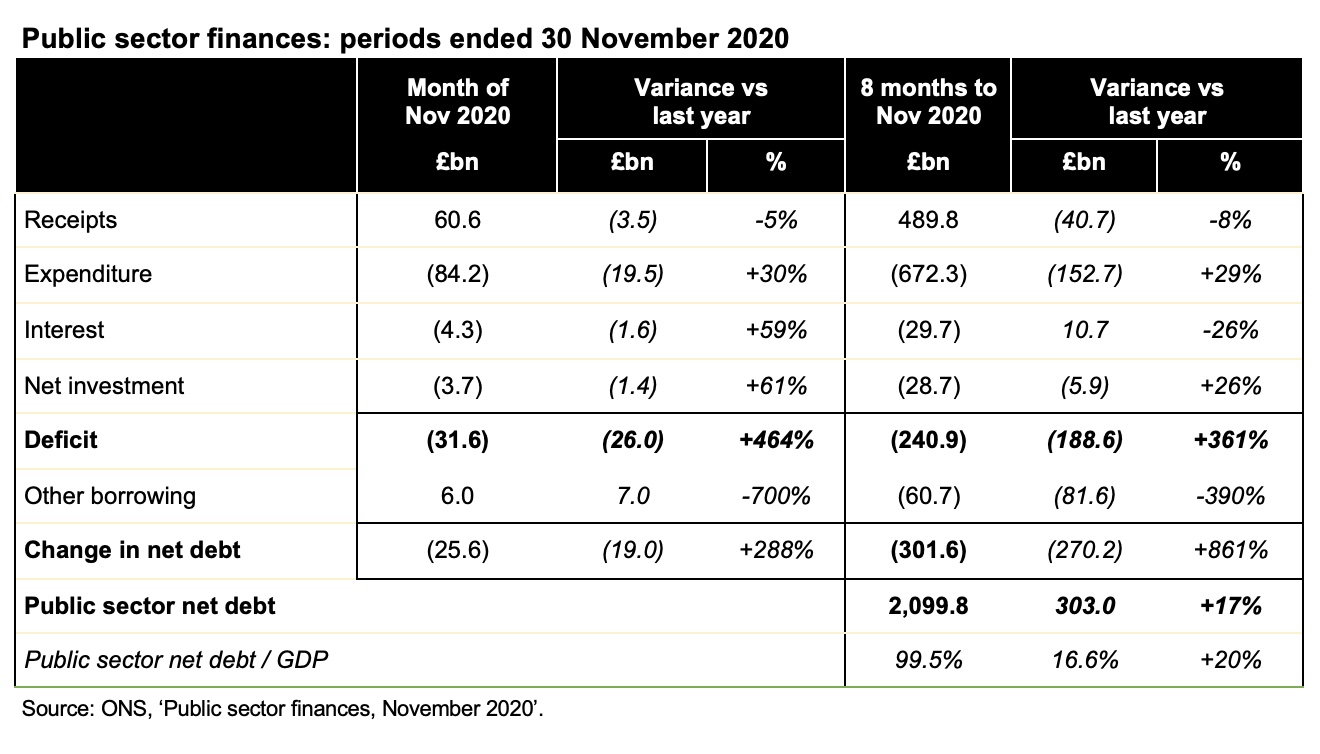
The combination of receipts down 8%, expenditure up 29% and net investment up 26% has resulted in a deficit for the eight months to November 2020 that is over four times the budgeted deficit of £55bn for the whole of the 2020-21 financial year set in the Spring Budget in March, despite interest charges being lower by 26%. The cumulative deficit is approaching five times as much as for the same eight-month period last year.

Cash funding (the ‘public sector net cash requirement’) for the month was £20.7bn, bringing the cumulative total this financial year to £295.8bn, compared with £14.9bn for the same eight-month period in 2019. 

Interest costs have fallen despite much higher levels of debt, with extremely low interest rates benefiting both new borrowing to fund government cash requirements and borrowing to refinance existing debts as they have been repaid.

The deficit remains on track to approach the £393.5bn forecast for the financial year to March 2021 by the Office for Budget Responsibility in the Spending Review once bad debts not yet recognised on coronavirus loans are included.

Upwards revisions to GDP based on the latest Office for Budget Responsibility forecasts have reduced the debt to GDP ratio for this and previous months to below 100% of GDP. However, the likelihood of a further national lockdown in the new year and for disruption in international trade with the end of the EU transition period could depress prospects for GDP growth in 2021.

Table of results each of the 8 months to November 2020. Click on the link at end of post to visit the original ICAEW article for a readable version.
Table of results each of the 8 months to November 2019 and of the 12 months ended 31 March 2020. Click on the link at end of post to visit the original ICAEW article for a readable version

Caution is needed with respect to the numbers published by the ONS, which are expected to be repeatedly revised as estimates are refined and gaps in the underlying data are filled.

The ONS made a number of revisions to prior month and prior year fiscal numbers to reflect revisions to estimates and changes in methodology. These had the effect of reducing the reported fiscal deficit in the first seven months from the £214.9bn reported last time to £209.3bn and increasing the reported deficit for 2019-20 from £56.1bn to £57.4bn.

This article was originally published by ICAEW.

ICAEW chart of the week: 40 years of technology

18 December 2020: Our last chart this year takes a look at how technology has advanced over the last forty years, using the number of transistors in central processing unit microprocessors as a proxy for technological advancement.

Transistors on chips: 2020 Apple M1 16bn, 2010 Intel Xeon 2.3bn, 2000 Intel Pentium IV 42m, 1990 Motorola 68040 1.2m and 1980 Motorola 68000 68,000.

As we look back over the course of a difficult year, the contribution of technology to keeping the economy working has become apparent. Working from home instead of the office, joining video calls instead of in-person meetings and collaborating using online tools have made it possible for most businesses to continue to operate, albeit perhaps not quite as normal. Similarly, consumers have been able to turn to online retail, streaming services and cashless technology to cope with closed stores and shuttered entertainment venues during lockdowns and tiered restrictions.

This has only been possible as a consequence of huge advancements in technology over the past forty years, with the arrival of affordable personal computers in the 1980s, mobile phones in the 1990s, practical laptops and broadband connections in the 2000s, and smartphones and tablets in the 2010s.

We have used the number of transistors in central processing unit (CPU) microprocessors as a proxy for technological advancement in the #icaewchartoftheweek, but of course there have been many other advancements that have been just as significant, from processing capabilities, memory size, data storage, video quality and broadband speeds.

Back in 1980, the Motorola 68000 chip with 68,000 transistors was the leading chip. It was originally used in high-end business computers before lower production costs enabled it to be included in the original Apple Macintosh launched in 1984. That first Macintosh had separate chips to provide 64K of read-only-memory (ROM), 128k of random-access memory (RAM), a built-in 400KB floppy disk drive and 512 x 342 monochrome display.

A decade later, Intel had caught up with Motorola in chip design, with the Intel 80486 containing 1,180,235 transistors, matching Motorola’s 68040 chip that contained approximately 1.2 million transistors. The Intel 80486 was used in many IBM-compatible PCs while the Motorola 68040 was used in the Commodore Amiga 4000 and HP Series 400 desktops.

Intel was the leading chip-maker in 2000 with the Pentium series of microprocessors being the core of many PCs, albeit against strong competition from AMD’s Athlon x86 compatible CPUs. The Pentium 4 had 42 million transistors, while by 2010, Intel had taken over from Motorola in Apple’s range of computers, although its Xeon series of chips (with 2.3 million transistors in 2010) was primarily used in high-end workstations and servers rather than in desktops or laptops.

In 2020, Apple has started to replace Intel in its computers with the launch of its ARM-based M1 chip. This has 16 billion transistors, more than 235,000 times as many as there were in the leading edge Motorola 68000 of 40 years ago. Processing power and capability is expected to continue to expand: for example, we didn’t have enough room on the chart to fit in AMD’s Epyc Rome microprocessor with 39.5billion transistors on a single chip.

The recently launched M1-based edition of the Apple MacBook Air has a specification that would unimaginable to the personal computer owner of four decades past, with a base configuration containing 8Gb of memory (62,500 times as much RAM as the original Macintosh desktop), 256 GB of storage (640,000 times) and a 2560 x 1600 colour display. 

Our ability to cope with the pandemic would have been much harder even a mere decade ago when smartphones were only just emerging, let alone if we had been back in the world of dial-up modems and fax machines of 40 years ago. This demonstrates just how much technology has improved our ability to deal with a global crisis such as the coronavirus pandemic.

The #icaewchartoftheweek is taking a break for a couple of weeks in order to enjoy socially-distanced Christmas and New Year celebrations and will be returning on 8 January 2021. After such a difficult year, we hope you will be able to take some time off to recharge and return to your home-office (and eventually your actual office) energised for what we hope will be a much improved 2021!

This chart was originally published by ICAEW.

ICAEW chart of the week: Government bond yields

11 December 2020: Ultra-low or negative yields provide governments with an opportunity to borrow extremely cheaply, but what will happen if and when interest rates rise?

Government 10-year bond yields

Germany -0.61%, Switzerland -0.59%, Netherlands -0.53%, France -0.36%, Portugal -0.02%, Japan +0.01%, Spain +0.02%, UK +0.26%, Italy +0.58%, Greece +0.60%, Canada +0.76%, New Zealand +0.91%, USA +0.95%, Australia +1.02%

On 9 December, the benchmark ten-year government bond yield for major western economies ranged from -0.61% for investors in German Bunds through to 0.95% for US Treasury Bonds and 1.02% for Australia Government Bonds, as illustrated in the #icaewchartoftheweek.

One of the more astonishing developments of the last decade or so has been the arrival of an era of ultra-low or negative interest rates, even as governments have borrowed massive sums of money to finance their activities. This is not only a consequence of weak economic conditions and the slowing of productivity-led growth, but it has also been driven by the monetary policy actions of central banks through quantitative easing operations that have driven down yields by buying long-term fixed interest rate government bonds in exchange for short-term variable rate central bank deposits.

For bond investors this has been a wild ride, with the value of existing bonds sky-rocketing as central banks have come calling to buy a proportion of their holdings, crystallising their gains. The downside is the extremely low yields available to debt investors on fresh purchases of government bonds, which in some cases involve paying governments for the privilege of doing so.

Yields vary according to maturity, with yields on UK gilts ranging from -0.08% on two-year gilts through to 0.26% for 10-year gilts (as shown in the chart) up to 0.81% on 30-year gilts. In practice, the UK issues debt with an average maturity between 15 and 20 years, so the current average cost of its financing is higher than that shown in the chart at between 0.48% and 0.77% being the yields on 15-year and 20-year gilts respectively. This has the benefit of locking in low interest rates for longer, in contrast with most of the other countries shown that tend to issue debt with an average maturity of less than ten years.

Quantitative easing complicates the picture, as by repurchasing a significant proportion of government debt and swapping it for central bank deposits, central banks have reversed the security of fixed interest rates locked in to maturity with a variable rate exposure that will hit the interest line immediately if rates change. 

In theory, this should not be a problem, as higher interest rates are most likely to accompany stronger economic growth and hence higher tax revenues with which to pay the resultant higher debt interest bills, but in practice treasury ministers are not so sanguine. In leveraging public balance sheets to finance their responses to COVID-19 – on top of the legacy of debt from the financial crisis – governments have significantly increased their exposure to movements in interest rates, just as other fiscal challenges are growing more pressing.

Expect to hear a lot more over the coming decade about the resilience of public finances as governments seek to reduce gearing and reduce their vulnerability to the next unexpected crisis, whenever that may occur.

This chart was originally published on the ICAEW website.

ICAEW chart of the week: UK trade in goods

With less than a month to go before the UK leaves the EU Single Market and Customs Union, trade is high on the agenda as negotiations between the UK and the EU go down to the wire.

UK trade in goods in the year to September 2020: exports £338bn & imports £420bn

EU: £153bn & £230bn
Continuity deals: £49bn & £43bn
USA: £53bn & £38bn
China: £32bn & £54bn
Other: £51bn & £54bn

The #icaewchartoftheweek this week is on international trade, illustrating how exports and imports of goods amounted to £338bn and £420bn respectively in the year to 30 September 2020. This excludes £289bn and £181bn of services exports and imports over the same period that are also extremely important, but which are not the principal subjects of the free trade deal currently being negotiated.

The UK’s largest trading partnership for goods is with the members of the EU Customs Union (together with Turkey for non-agricultural products), with the UK exporting £153bn (45% of total goods exports) and importing £230bn (55% of total goods imports). 

This is followed by a further £49bn (15%) of exports to and £43bn (10%) of imports from 52 countries that have trade deals with the EU that the UK has been able to agree replacement trade arrangements with. These include Norway, Switzerland, Japan, South Korea, Canada and South Africa, with discussions underway to roll-over trade deals with a further 13 countries not included in these numbers, in particular with Singapore and Vietnam.

The UK’s two largest individual trading partners are the USA and China, where the UK will continue to trade on World Trade Organisation (WTO) terms. The UK exported £53bn (16%) of goods to the USA and imported £38bn (9%) in the year to September, while it exported £32bn (9%) to China and imported £54bn (13%).

The balance of goods trade, comprising exports of £51bn (15%) and imports of £54bn (13%), is with over 130 other countries and territories where the UK does not have a trade deal in place for after 1 January 2021, including India, Russia, Vietnam, Taiwan, the UAE, Saudi Arabia, Qatar, Thailand, Singapore, Australia, Malaysia and Nigeria.

Both exports and imports of goods have reduced in the year to September 2020 compared with a year previously, with exports down 7% and imports down 18%. The principal driver of the fall is the coronavirus pandemic, although reconfiguration of cross-border supply chains ahead of the end of the transition period may also be a factor.

Although global trade is expected to pick up in 2021 once covid-19 vaccines are widely available, there is significant uncertainty as to the effect on trade of the UK’s departure from the Single Market and Customs Union – with or without a deal. Either way, increased trade frictions are likely to have at least some impact, while the imposition of tariffs in the event of no deal could cause significant additional problems for key sectors such as car manufacturing and agriculture.

The size and closeness of the EU economy means that it will continue to be the most important trading partner for the UK whatever is agreed. If only we knew on what terms we are going to be trading in less than a month’s time and what the major changes that are coming in January will mean for the future!

This chart was originally published on the ICAEW website.

ICAEW chart of the week: Spending Review 2020

In the wake of the government’s Spending Review, this week’s chart focuses on the bigger picture and looks at the scale of public spending in relation to the size of the overall economy.

Spending Review 2020: Public spending as % of GDP

2019-20: Department spending 17.0% + other spending 12.3% + welfare 10.3% + covid 0.2% = 39.8%

2020-21: 19.3% + 13.3% + 11.5% + 12.2% = 56.3%

2021-22: 19.5% + 12.4% + 10.6% + 2.6% = 45.1%

2022-23: 19.2% + 12.2% + 10.6% = 42.0%

2023-24: 19.2% + 12.1% + 10.5% = 41.8%

2024-25: 19.3% + 12.1% + 10.5% = 41.9%

2025-26: Departmental spending 19.3% + other spending 12.0% + welfare 10.5% = 41.8%

There was a lot of substance in the Spending Review 2020 announced this week, with a lot more going on under the surface with – for example – the launch of the National Infrastructure Strategy. However, we thought we would focus on the bigger picture for the #icaewchartoftheweek and to look at the scale of public spending in relation to the size of the overall economy.

Of course, the current financial year has seen a massive expansion in the amount of public spending – up from £884bn or 39.8% of GDP of £2,218bn in 2019-20 to a revised budget of £1,165bn or 56.3% of GDP of £2,069bn. The combination of higher spending and a smaller economy this year makes for an eye-watering percentage.

Next financial year will see further COVID support measures adding to public spending, but the key takeaway from the chart is that public spending is expected to persist at around 42% of GDP from 2022-23 onwards, reflecting a permanently smaller economy following the pandemic combined with slightly higher spending in real terms. This is 2% higher than the just under 40% seen in 2019-20 and 3%-4% higher than the 38%-39% longer-run average.

Around half of the increase in departmental spending seen in the chart relates to capital investment in line with the government’s infrastructure plans, while the remainder relates to operational spending with more for health, education and defence being partially offset by the reduction in development spending and the one-off public sector pay freeze.

With scope for substantial reductions in public spending seen to be limited, there are two main routes for covering this increase in costs – economic growth to boost the size of the economy or higher taxes. The government will be hoping that its increase in capital investment will help to deliver on the former, but it appears increasingly likely that tax rises will be needed over the course of the coming decade.

This chart was originally published on the ICAEW website.

ICAEW chart of the week: UK claimant count

13 November 2020: The claimant count soared at the start of the pandemic but levelled off since then. Will a wave of redundancies see it climb again over the winter?

UK claimant count. Jan 2019: 1,012,000 (597,000 men, 415,000 women) - Mar 2020: 1,240,000 (724,000, 516,000) - May 2020: 2,663,000 (1,620,000, 1,043,000) - Sep 2020: 2,634,000 (1,571,000, 1,063,000).

This week’s #icaewchartoftheweek looks at the claimant count, an experimental statistic compiled by the Office for National Statistics (ONS) that seeks to reflect those on Universal Credit who are not in employment or who are required to search for work, in addition to those receiving Jobseeker’s Allowance.

As the chart illustrates, the claimant count had already been on an upward path prior to the pandemic as Universal Credit rolled out across the country, reaching a total of 1,240,000 on 8 March before jumping to 2,663,000 a couple of months later in May during the first lockdown. The number has moved around a little since then, dropping slightly to stand at 2,634,000 on 8 October, comprising 1,571,000 men and 1,063,000 women.

The rapid rise in claimants has not been reflected in the same way in the unemployment statistics, which increased less dramatically, albeit still significantly, from 1,355,000 in March to 1,661,000 in September 2020. This suggests around 300,000 of the increase in the claimant count is down to greater unemployment, with the balance of approximately 1,150,000 arising from ‘underemployment’ as claimants have had their hours and/or pay levels cut taking them below the relevant Universal Credit thresholds.

The recent rise in redundancies – up to a record 314,000 in the quarter to September – is likely to add further to the claimant count over the winter, although the extension in furlough arrangements until next March may constrain that rise to a certain extent.

News that a vaccine is on its way may well be positive for the second half of 2021, but in the meantime it is going to be a hard winter for many.

This chart was originally published by ICAEW.

ICAEW chart of the week: UK electricity projections

6 November 2020: Renewables, imports and nuclear are expected to provide around 85% of UK electricity generation by 2040, but will that be good enough to achieve carbon neutrality a decade later in 2050?

UK electricity projections chart (reference scenario):
Nuclear: 48 TWh in 2008, 62 TWh in 2020, 86 TWh in 2040.
Imports: 11 TWh, 28 TWh, 74 TWh.
Renewables: 23 TWh, 125 TWh, 188 TWh.
Carbon: 297 TWh, 109 TWh, 58 TWh in 2040.

The latest official energy and emissions projections, released by the Department for Business, Energy & Industrial Strategy (BEIS) on 30 October 2020, now extend out to 2040 – a decade before the 2050 target set by the UK Government to reach net zero.

The #icaewchartoftheweek takes a look at the progress being made on decarbonising electricity generation, with renewables, nuclear and imported electricity (much of which comes from nuclear or renewable sources) expected to increase from around 20% in 2008 to 66% this year and to just over 85% in 2040.

Overall electricity demand is expected to fall over the first half of the coming decade as improved energy efficiency and energy conservation measures (such as better insulation) continue to offset more demand from a growing population and economy (caveats apply). Lower demand in the residential and services sectors are then expected to be outweighed by higher demand for industrial and transport, particularly the latter as electric vehicles take to the roads.

Coal has now been almost entirely eliminated from electricity generation, falling from 118 TWh in 2008 (when there was also 6 TWh from oil and 173 TWh from natural gas) to 2 TWh projected in 2020 alongside 107 TWh from natural gas. Even so, coal may remain a small part of the mix even in 2040 as part of a projected 5 TWh of electricity from carbon capture and storage (CCS) plants. This should leave just 53 TWh from low (but still not no) carbon natural gas generation to eliminate over the subsequent decade.

Unfortunately, electricity is only part of the energy picture, with the reference scenario calculated by BEIS projecting that carbon sources will provide 980 TWh of final energy consumption in 2040 outside of electricity supply and direct power from renewables. This includes the equivalent of around 370 TWh from natural gas used domestically, 250 TWh from diesel and petrol used in transport, and 160 TWh from aviation fuels.

So while there continues to be welcome progress in greening the electricity supply, achieving net zero overall is not going to be as easy.

This chart was originally published on the ICAEW website.

ICAEW chart of the week: US federal deficit

30 October 2020: The US federal government spent $3.1tn more than it received in the year to 30 September 2020, more than three times the $1.0tn deficit incurred in 2019.

Chart showing US federal deficit for the year to 30 Sep 2020. Receipts £3.4tn, deficit $3.1tn and outlays $6.5tn.

The #icaewchartoftheweek is on the $3.1tn deficit incurred by the United States federal government, according to its preliminary financial results for the 2020 fiscal year published by the Bureau of the Fiscal Service, a unit of the US Department of the Treasury. 

Analysis by the US Congressional Budget Office reports that receipts of $3.4tn were 1% lower than in the previous financial year, which can broadly be split into a 6% increase in the first half from October 2019 to March 2020 and a 7% decrease in the second half of the year ending in September. 

As illustrated by the chart, the principal sources of revenue are $1.3tn in social security payroll tax deductions and $1.6tn in personal income taxes, together with $0.2tn in corporate income taxes and $0.3tn from excise taxes, customs duties, estate and gift taxes and other net receipts.

Outlays of $6.5tn in FY2020 were $2.1tn or 47% higher than in the FY2019, reflecting a 7% increase in the first half and an 87% increase in the second half. These increases were principally driven by the fiscal response to the coronavirus pandemic, including $0.6tn for small business furlough programmes, a $0.4tn increase in unemployment compensation, $0.3tn more in refundable tax credits, $0.2tn in emergency health measures and over $0.1tn for the Coronavirus Relief Fund. Other increases included $0.1tn in student loan subsidies, $0.3tn in federal reserve investments and $0.2tn in other increases, offset by a $0.1tn reduction in interest costs.

Outlays can broadly be split between $4.7tn of ‘mandatory’ spending on welfare, $0.3tn in interest costs and $1.5tn in ‘discretionary’ spending by the federal government. 

Welfare comprises spending on social security (principally pensions), Medicare and Medicaid (healthcare), veterans, income security (unemployment benefits and tax credits) and the Paycheck Protection Program for small businesses, while spending on the federal government is dominated by the $0.7tn spent on defence, followed by $0.2tn on education, $0.1tn on homeland security and justice, $0.1tn on transport and $0.4tn on everything else.

It is important to stress that these receipts and outlays relate only to the federal government and exclude what is normally in the region of $3tn in receipts and spending of state and local governments across the US. There is usually a surplus at the state and local level but this year is likely to be different as state and local tax revenues collapse and spending to tackle the pandemic locally continues to grow.

External public debt was $21.0tn at 30 September 2020, an increase of $4.2tn or 25% over the $16.8tn the US federal government owed a year previously, reflecting borrowing to fund the $3.1tn deficit and a net $1.1tn in lending, principally to businesses as part of the coronavirus response.

Even more borrowing is probable irrespective of which candidate wins the presidential election next week as the US struggles to get the pandemic under control and the increasing likelihood that Congress will pass a multi-trillion dollar stimulus bill after the election is over.

This chart was originally published on the ICAEW website.

ICAEW chart of the week: Half year public spending and receipts

23 October 2020: The gap between spending and receipts widened to £208bn in the half-year to September 2020, significantly greater than the £80bn in the first half of 2009-10 at the height of the financial crisis.

Line chart showing half-yearly spending and receipts with a shaded gap between them highlighting the deficit. A huge widening occurs in the most recent half year.

The #icaewchartoftheweek is on UK public spending and receipts in the light of the September 2020 public finance release that reported a fiscal deficit of £208bn for the six months ended 30 September 2020, comprising public spending of £567bn less receipts of £359bn.

The chart illustrates how the shortfall in receipts and public spending of £26bn (public spending £289bn – receipts £263bn) and £14bn (£303bn – £289bn) in the first and second halves of 2006-07 increased to £80bn (£347bn – £267bn) and £78bn (£375bn – £297bn) in 2009-10 before gradually declining to £31bn (£421bn – £390bn) and £8bn (£433bn – £425bn) in the first and second halves of 2018-19 respectively.

The chart highlights how deficits added up over a decade (a cumulative £1.1tn between 1 April 2008 and 31 March 2018) even as the gap between spending and receipts narrowed as well as how much the shortfall has widened in the first half of 2020-21. With a further £140bn or so shortfall expected in the second of the financial year, it will take a strong economic rebound to prevent another trillion of deficits accumulating over the coming decade.

Although the Spending Review in November will now only cover the 2021-22 financial year for current expenditure, it is expected to set capital expenditure budgets for 2022-23 as well. This will be important in giving departments confidence to get infrastructure spending projects underway as quickly as possible next year if there is to be an investment-led economic recovery.

Read more about the September 2020 public finances: Half-year deficit reaches £208bn as COVID costs continue to accumulate.

This chart was originally published on the ICAEW website.

Half-year deficit reaches £208bn as COVID costs accumulate

22 October 2020: Public finances remain on track for the worst peace-time deficit ever, thanks to lower receipts and large-scale coronavirus interventions.

The latest public sector finances reported a deficit of £36.1bn in September 2020, a cumulative total of £208.5bn for the first six months of the financial year.

Falls in VAT, corporation tax and income tax drove lower receipts, while large-scale fiscal interventions resulted in much higher levels of expenditure. Net investment is greater than last year, as planned, while the interest line has benefited from ultra-low interest rates.

Public sector net debt increased to £2,059.7bn or 103.5% of GDP, an increase of £259.2bn from the start of the financial year and £274.0bn higher than in September 2019. This reflects £50.7bn of additional borrowing over and above the deficit, most of which has been used to fund coronavirus loans to business and tax deferral measures.

Commenting on the figures Alison Ring, ICAEW Director for Public Sector, said: “The deficit of £208bn is already more than the full-year deficit at the height of the financial crisis a decade ago and remains on track to be the largest ever outside the two world wars. 

“The economic damage caused by the pandemic in the first half of the fiscal year was not as bad as originally feared, thanks in part to the extraordinary level of financial support provided by the Chancellor. However, the second wave is putting further strain on the public finances as new regional restrictions are placed on economic activity.

To help the recovery the Chancellor must take the opportunity at the Autumn Statement and Spending Round to invest in preparing infrastructure projects to start as soon as possible.”

Image of table showing public finances for month of September and six months to September together with variances from last year. Click on link to the article on the ICAEW website for a readable version.

The combination of receipts down 11%, expenditure up 34% and net investment up 37% has resulted in a deficit for the six months to September 2020 that is approaching four times the budgeted deficit of £55bn for the whole of the 2020-21 financial year set in the Spring Budget in March. This is despite interest charges being lower by 24%. The cumulative deficit is more than six times as much as for the same six-month period last year.

Cash funding (the ‘public sector net cash requirement’) for the six months was £257.8bn, compared with £7.1bn for the same period in 2019.

Interest costs have fallen despite much higher levels of debt, with extremely low interest rates benefiting both new borrowing to fund government cash requirements and borrowing to refinance existing debts as they have been repaid.

The Institute for Fiscal Studies’ recent IFS Green Budget 2020 annual pre-Budget report indicated that the deficit for the full year to March 2021 could reach £350bn or 17% of GDP.

Some caution is needed with respect to the numbers published by the ONS, which are expected to be repeatedly revised as estimates are refined and gaps in the underlying data are filled. In particular, the OBR points out that the ONS has yet to record any allowance for losses that might arise on the more than £100bn of tax deferrals, loans and guarantees provided to support businesses through the pandemic.

Image of table showing public finances for each month to September 2020 and for each month to September 2019. 

Click on link to the article on the ICAEW website for a readable version.

The ONS made a number of revisions to prior month and prior year fiscal numbers to reflect revisions to estimates and changes in methodology. These had the effect of reducing the reported fiscal deficit in the first five months from the £173.7bn reported last time to £172.4bn and reducing the reported deficit for 2019-20 from £55.8bn to £54.5bn.

For further information, read the public sector finances release for September 2020.

This article was originally published on the ICAEW website.