ICAEW chart of the week: Greenhouse gas emissions

My chart this week looks at how greenhouse gas emissions increased again in 2022 after a big dip during the pandemic. Was that just a blip or will the downward trend resume?

Greenhouse gas emissions

Line chart showing million tonnes of CO2-equivalent emissions between 1990 and 2022.

The line starts at 843m tCO2e in 1990, rises to 853m tCO2e in 1991 and then gradually falls with a few upward blips until reaching 489m tCO2e in 2020 and then rising to 513m tCO2e in 2022.

12 Oct 2023.
Chart by Martin Wheatcroft. Design by Sunday.
Source: ONS, 'Greenhouse gas emissions: provisional estimates 2022'.

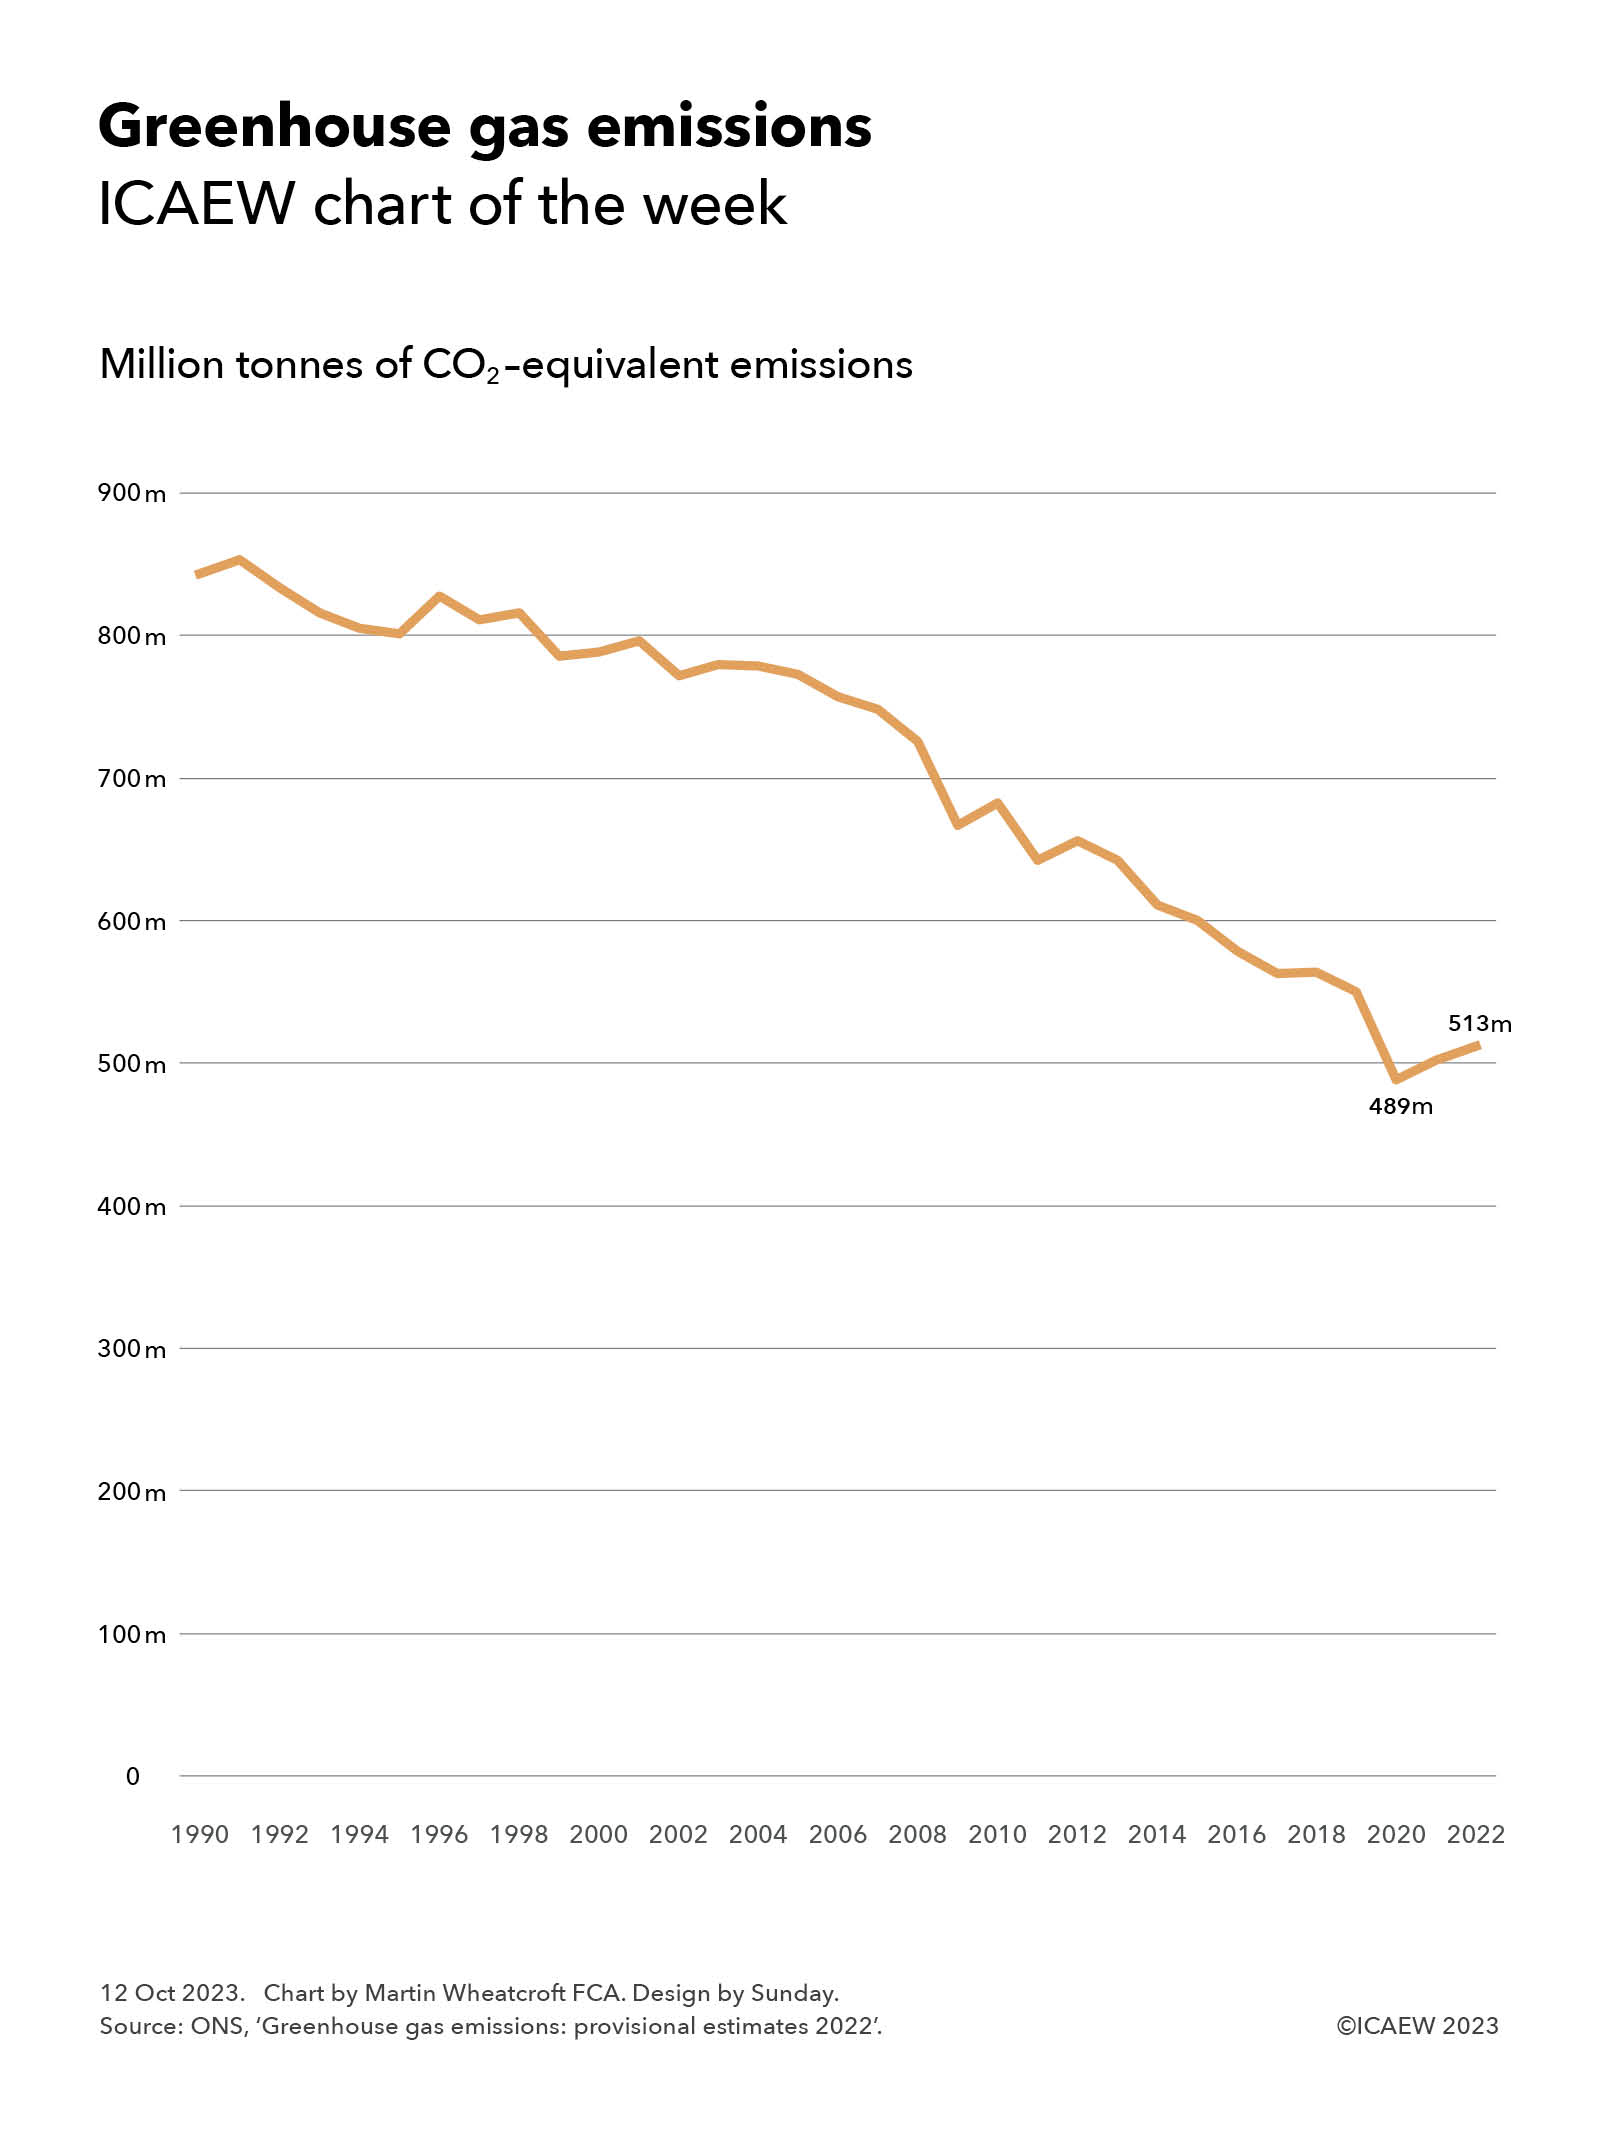
The Office for National Statistics (ONS) recently reported provisional numbers for greenhouse gas emissions in 2022, reporting that UK residents and UK-resident businesses emitted a total of 513m tonnes of carbon dioxide equivalents (tCO2e).

Our chart this week shows the overall trend since 1990 according to the ONS. Emissions were 843m tCO2e in 1990, rising to 853m tCO2e in 1991, from which point they have declined in most years since then apart from the odd upward blip.

The 513m tCO2e provisionally estimated to have been emitted in 2022 is up 2% over 2021 and just under 5% higher than the 489m tCO2e emitted during 2020, the first year of the pandemic when much of the country was locked down.

The good news is that this is still 7% lower than the 551m tCO2e emitted during 2019.

This disruption to the downward trend is primarily due to the pandemic, which saw emissions drop by a massive 11% in 2020 compared with 2019, before rising by 3% in 2021 and 2% in 2022.

The hope is that the downward trend will resume in 2023 and 2024 as decarbonisation efforts continue.

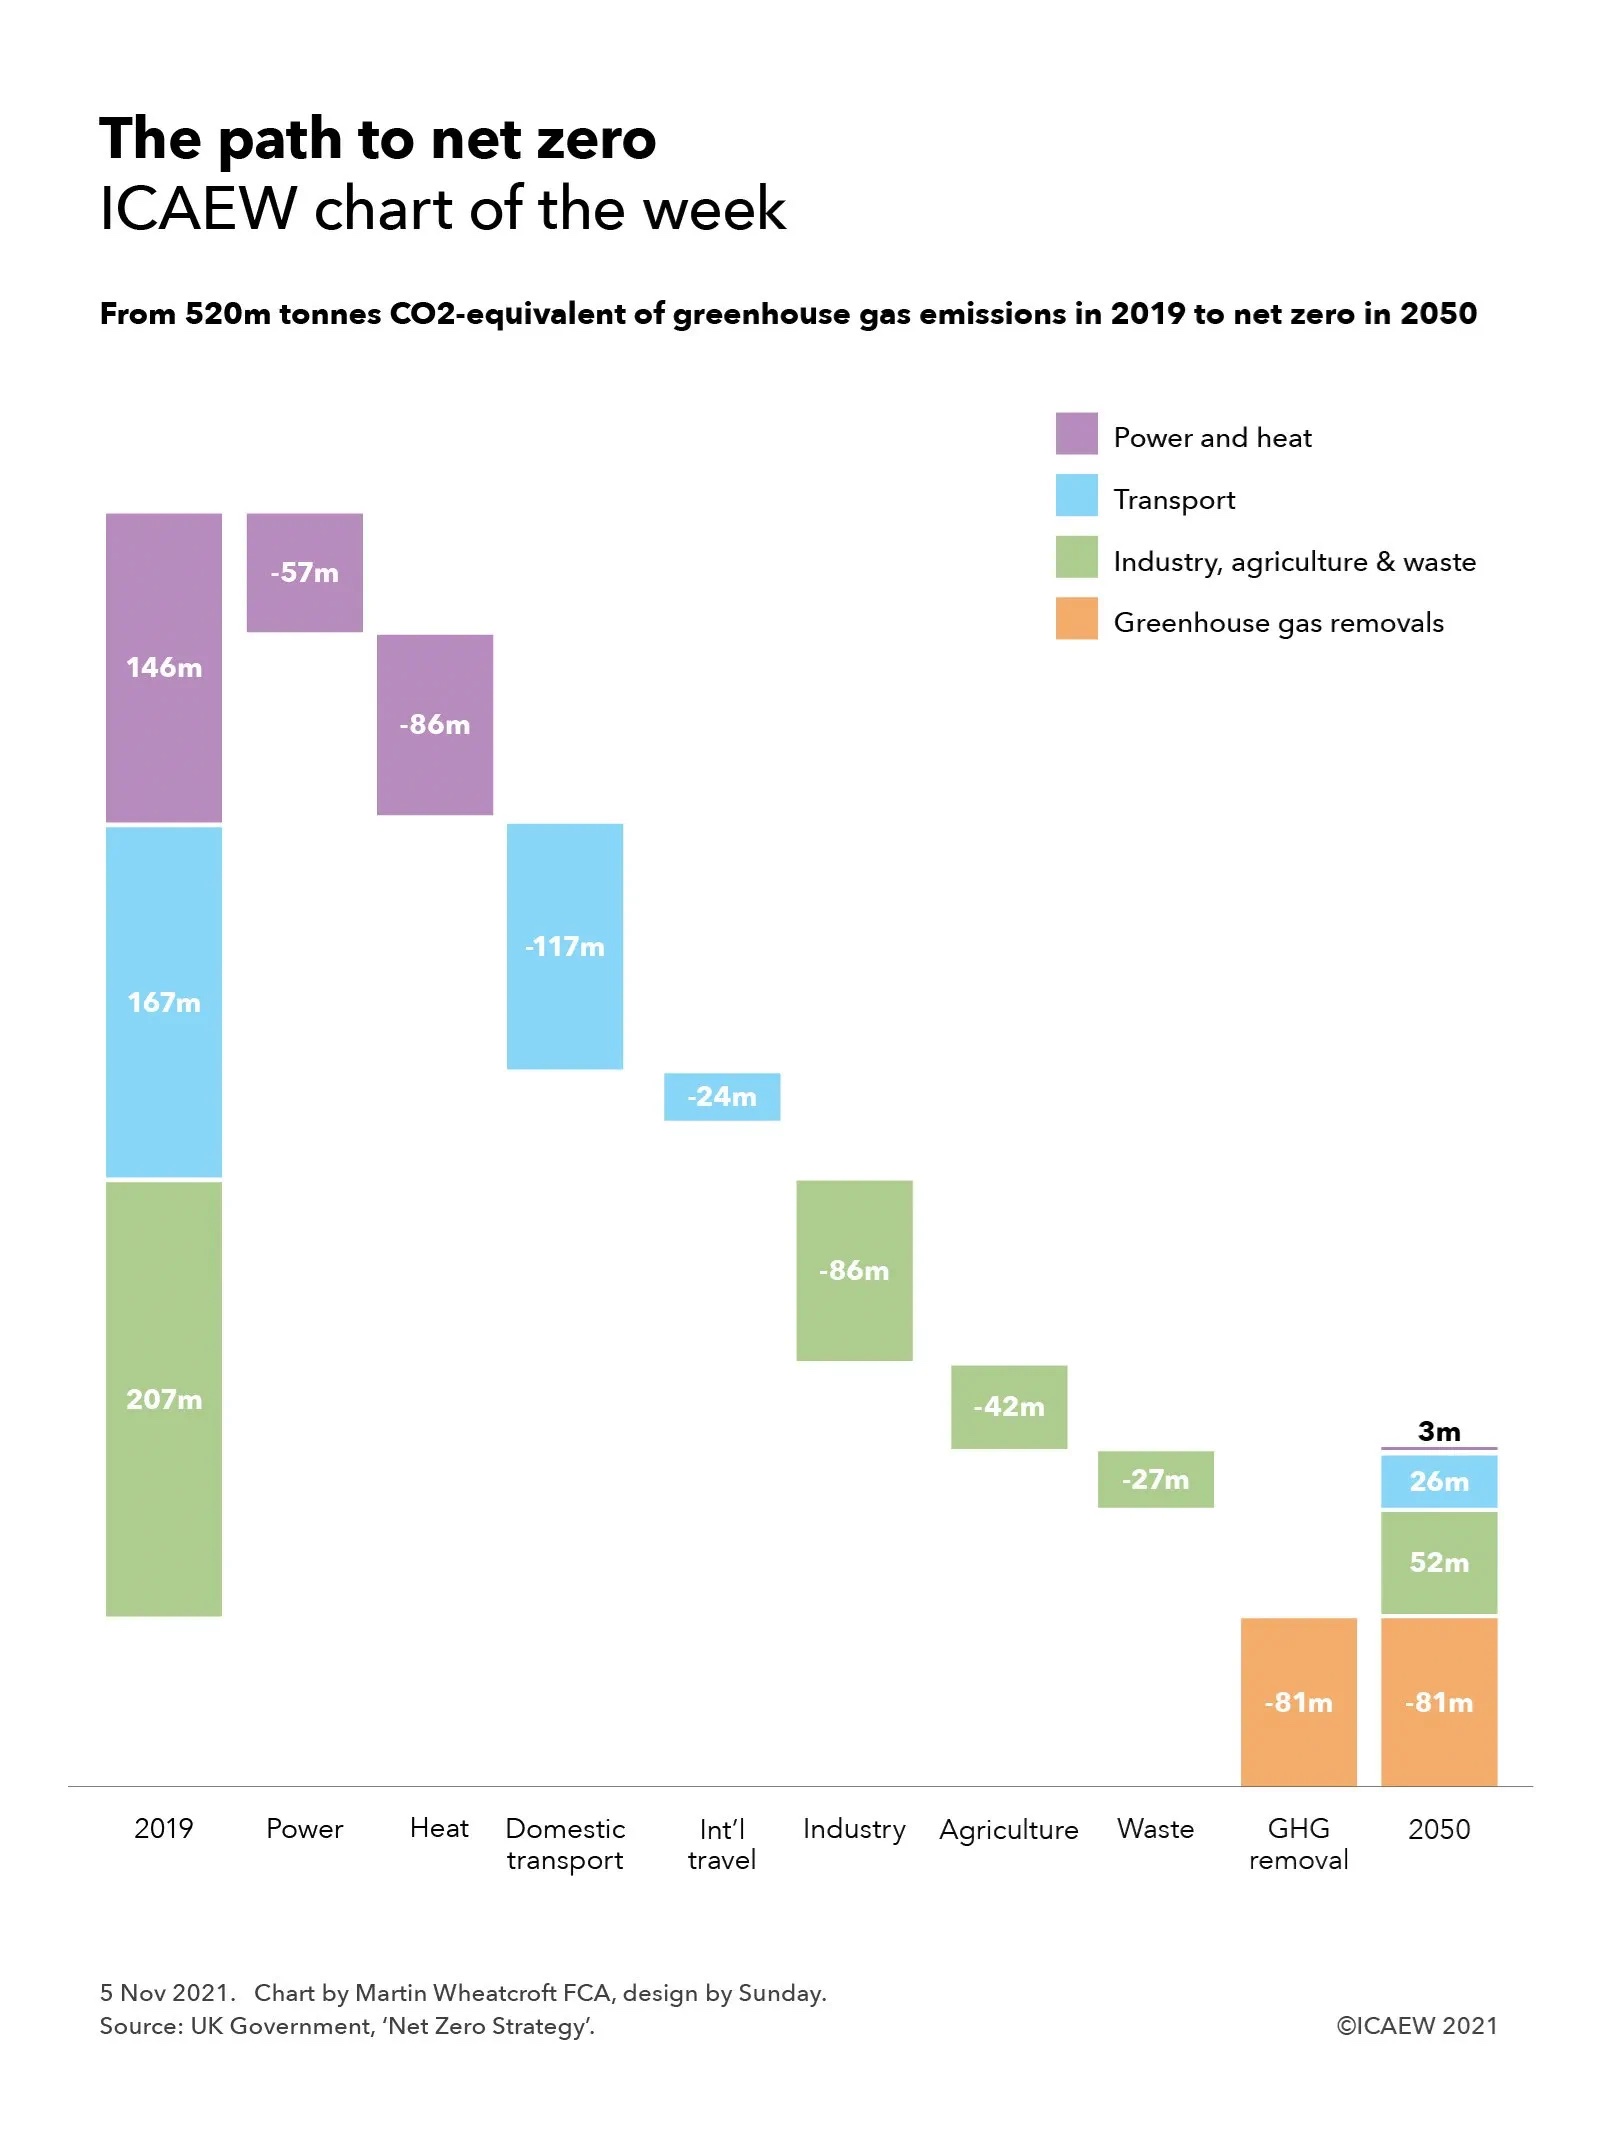
Most of the fall in emissions since 1991 has been delivered by the shift from coal to gas and renewable sources in electricity generation, combined with greater energy efficiency in appliances and equipment – what many commentators call “the easy bit”. The next stages of decarbonisation will be much harder as it involves switching everyone from fossil-fuel-powered vehicles to electric, completing the shift to renewable electricity generation, decarbonising most industrial processes and radically changing how we heat our homes and offices.

This chart was originally published by ICAEW.

ICAEW chart of the week: the path to net zero

All eyes have been on COP26 as the world’s leaders seek to set a course to eliminating carbon emissions over the next quarter of a century or so. Our chart highlights what it will take for the UK to do its part of delivering net zero by 2050.

Chart showing how the UK plans to go from 520m tonnes CO2-equivalent of greenhouse gas emissions in 2019 to net zero in 2020:

146m power & heat in 2019 -57m power -86m heat = 3m in 2050

167m transport in 2019 -117m domestic transport -24m international travel = 26m in 2050

207m industry, agriculture & waste in 2019 -86m industry -42m agriculture -27m waste = 52m in 2050

less: 81m greenhouse gas removals in 2050

to get to net zero

The Breakthrough Agenda agreed at COP26 by countries representing more than 70% of the world economy will be key, by making clean technologies the most affordable, accessible and attractive choice for all globally in each of the most polluting sectors. This involves ensuring that clean power, zero emission vehicles, near-zero emission steel, green hydrogen and climate-resilient sustainable agriculture are in place by 2030 so that countries including the UK can deliver on their ambitious plans to eliminate greenhouse emissions from their economies.

For the UK, the plan is to reduce greenhouse gas emissions from the 520m tonnes CO2-equivalent (tCO2e) emitted in 2019 to between 75m and 81m in 2050, with a combination of natural and technological solutions to remove an equivalent amount of carbon from the atmosphere to bring net emissions down to zero. This is based on the scenarios set out in the UK’s Net Zero Strategy published on 19 October 2021, which starts from 146m tCO2e of emissions from power and heat, 167m tCO2e from transport and 207 tCO2e from industry, agriculture & waste.

The different steps that will be needed to achieve this goal start with decarbonising power generation and heating, going from 146m to 3m tCO2e in 2050. The UK has already made substantial progress in installing renewable generation and appears on track to achieve the 57 MtCO2e further reduction to almost entirely remove fossil fuels from electricity. Challenging as that will be, it will be even more difficult to replace natural gas as the principal source of heating for the majority of buildings across the UK in order to find a further 86m tCO2e of reduction.

Eliminating 117m out of 122m tCO2e of emissions from domestic transport will mainly be accomplished by replacing petrol and diesel vehicles with electric, not only requiring affordable car technology but an entire new infrastructure of charging points. There is less optimism for international travel, where the ambition is to take out 24m of the 45m tCO2e emitted in 2019 in the ‘high innovation’ scenario presented in the chart and only 10m tCO2e in the other two scenarios (which assume greater reductions in other areas to arrive at a similar end point).

Industry, agriculture, and waste have even more to do, with businesses including steel producers, manufacturers and the fuel supply chain needing to decarbonise to remove 86m tCO2e out of 104m tCO2e. Agriculture and land use will need to take out 42m of 63m tCO2e of emissions, while emissions from waste and fluorinated greenhouse gases (F-gases) will need to come down by 27m from 40m to 13m tCO2e.

The result will be a UK economy still emitting 81m tCO2e a year, comprising 3m from power and heat, 26m from transport and 52m from industry, agriculture, and waste. Net zero will be achieved by removing an equivalent amount of carbon from the atmosphere, partially through natural means but in practice through technological solutions that have yet to be developed.

There is a lot that all of us need to do to achieve net zero here in the UK. The positive news emerging from COP26 is that the rest of the world is also committed to doing so too – a global solution for a global climate emergency.

Read more – ICAEW Insights Special on COP26: acting together on climate.

This chart was originally published by ICAEW.