We take a look at the government balance sheet at 31 March 2020 this week, following publication by HM Treasury of the long-delayed 2019/20 audited financial statements for the UK public sector.
HM Treasury was up in front of the Public Accounts Committee (PAC) this week to be grilled on the Whole of Government Accounts (WGA) for the year ended 31 March 2020. The first question posed by MPs was why it had taken more than 26 months to publish the audited financial statements for the UK public sector, unlocking a tale of woe regarding the pandemic, delays in central government reporting, even greater delays in local government, and problems in implementing a new consolidation system.
For all that, the PAC expressed their appreciation for the contents of the WGA, which comprises a performance report, governance statements, financial statements prepared in accordance with International Financial Reporting Standards, an audit report and a reconciliation to the fiscal numbers reported by the Office for National Statistics. The UK is one of the leading governments around the world in preparing comprehensive financial reports similar to those seen in the private sector, and is the only one to attempt to incorporate local government as well as central government and public corporations.
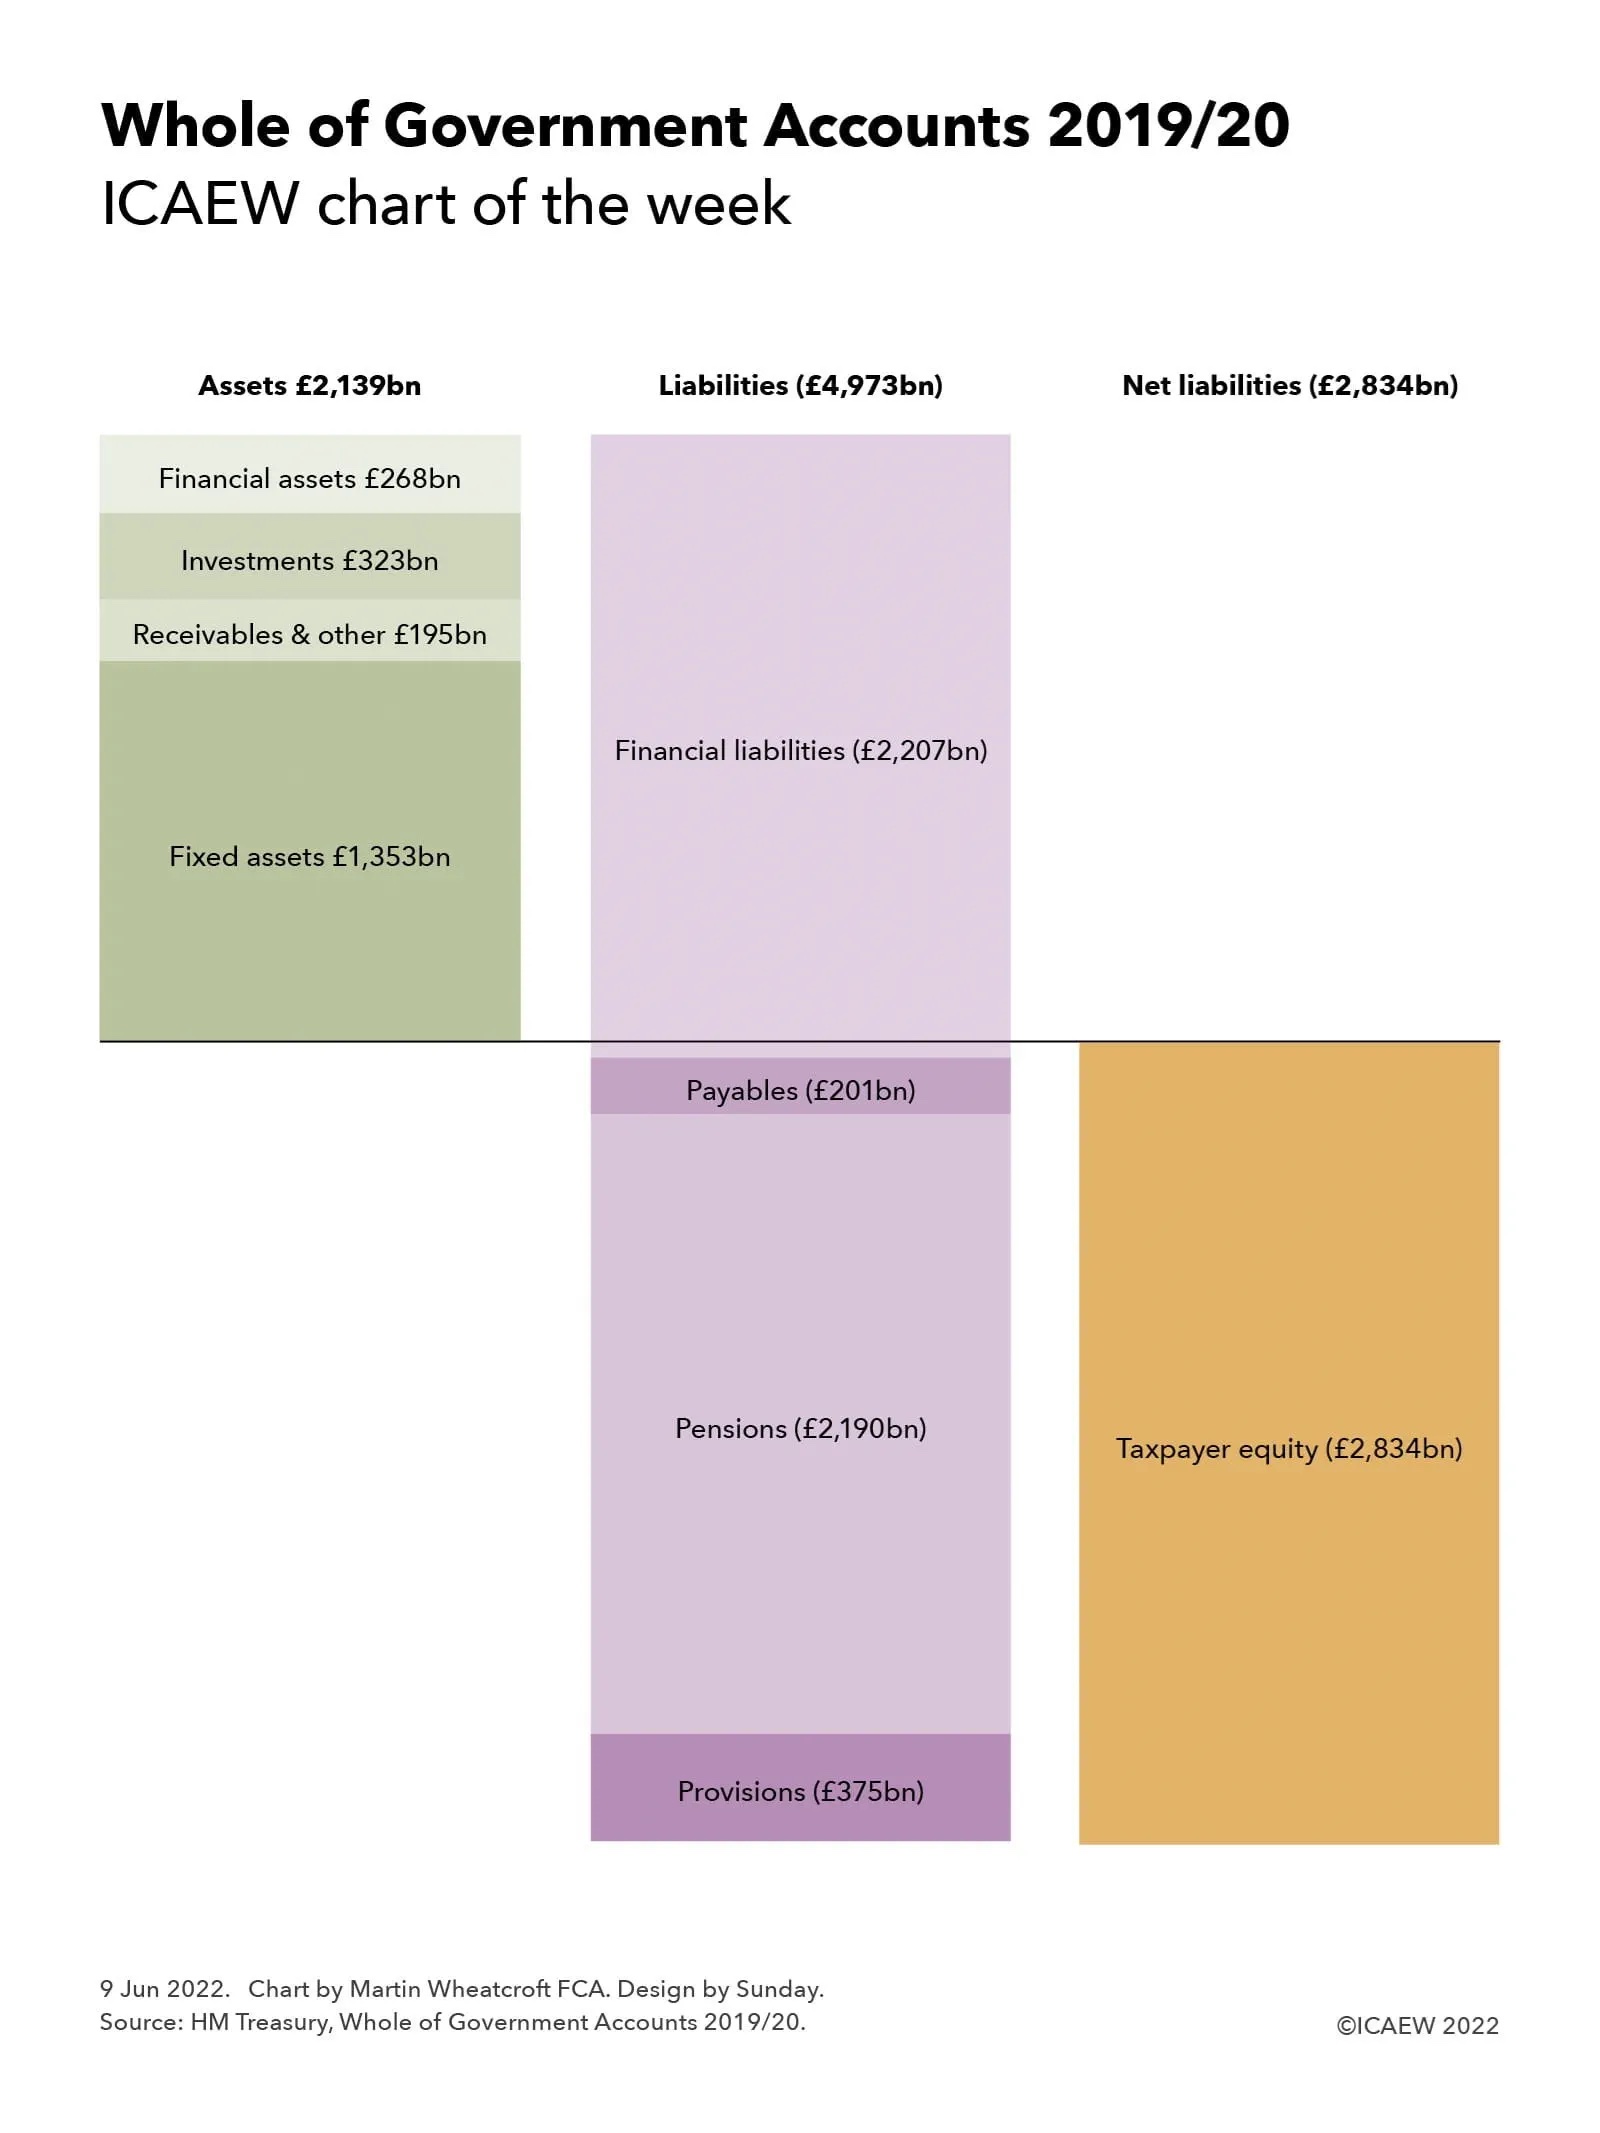
Our chart summarises the balance sheet reported in the consolidated financial statements at 31 March 2020, when there were total assets of £2,139bn, total liabilities of £4.973bn and negative taxpayer equity of £2,834bn. These numbers do not reflect the more than half a trillion pounds borrowed since then which are likely to see the 2020/21 and 2021/22 WGA move even further into negative territory.
On the positive side of the balance sheet were:
- £195bn of receivable and other assets, comprising £160bn of trade and other receivables due within one year, £22bn of receivables due in more than year, £11bn of inventories and £2bn of assets held for sale;
- £1,353bn of fixed assets, consisting of £676bn for infrastructure, £459bn of land and buildings, £77bn of assets under construction, £41bn of military equipment, £60bn of other tangible fixed assets, and £40bn of intangibles;
- £323bn of investments, including £126bn of non-current loans and deposits, £77bn in student loans, £36bn in equity investments, £22bn invested in the IMF, £38bn in derivatives and other, and £24bn in investment property; and
- £268bn of current financial assets, of which £118bn were in debt securities, £74bn in loan balances due within one year, £38bn in cash and cash equivalents, £13bn in gold holdings, £13bn in IMF special drawing rights and £12bn in derivatives and other.
On the negative side, there were:
- £2,207bn in financial liabilities, comprising £1,266bn in government securities (gilts and Treasury bills), £560bn of deposits owed to banks, £179bn owed to investors in National Savings & Investments, £78bn in bank and other borrowings, £74bn in banknotes and £50bn in derivatives and other financial liabilities;
- £201bn of payables, including £66bn of accruals and deferred income, £55bn of trade and other payables, £42bn in lease obligations, £34bn in tax and duty refunds payable and £4bn in contract liabilities;
- £2,190bn in net pension obligations, of which £2,062bn were for unfunded pension schemes (NHS £760bn, teachers £490bn, civil service £309bn, armed forces £233bn, police & fire £197bn, other £73bn) and £128bn for funded schemes (local government £359bn less £253bn = £106bn, and other funded schemes £106bn less £84bn = £22bn). This balance does not include the state pension, which is treated as a welfare benefit and not a liability for accounting purposes; and
- £375bn in provisions for liabilities and charges, including £157bn for nuclear decommissioning, £86bn for clinical negligence, £39bn for EU liabilities, £31bn for the pension protection fund and £62bn in other provisions.
Net liabilities therefore amounted to £2,834bn, reflecting the general policy decision taken by successive governments not to fund liabilities in advance, but instead to rely on future tax revenues and borrowing to provide cash as needed to settle liabilities and other financial obligations and commitments. As Sir Tom Scholar, Permanent Secretary at HM Treasury, informed the PAC, this minimises the investment risks the government might otherwise be exposed to if it were to invest in (say) the stock market.
Cat Little, Head of the Government Finance Function, set out plans to bring down the time to prepare the WGA, to within 24 months for the 2020/21 WGA and to within 20 months for the 2021/22 WGA. This remains a long way off the long-term objective of producing the WGA within nine months of the balance sheet date.
While the numbers in these financial statements are now more than two years old, they are still extremely valuable in providing a baseline for the financial position of the UK public sector as the country headed into the pandemic. It is well worth a read if you have the time.
The Whole of Government Accounts 2019/20 is available online.