February’s £13.1bn deficit was offset by revisions to prior month estimates, boosting public finances and putting further pressure on the Chancellor to provide more help to households and businesses facing rapidly rising prices.
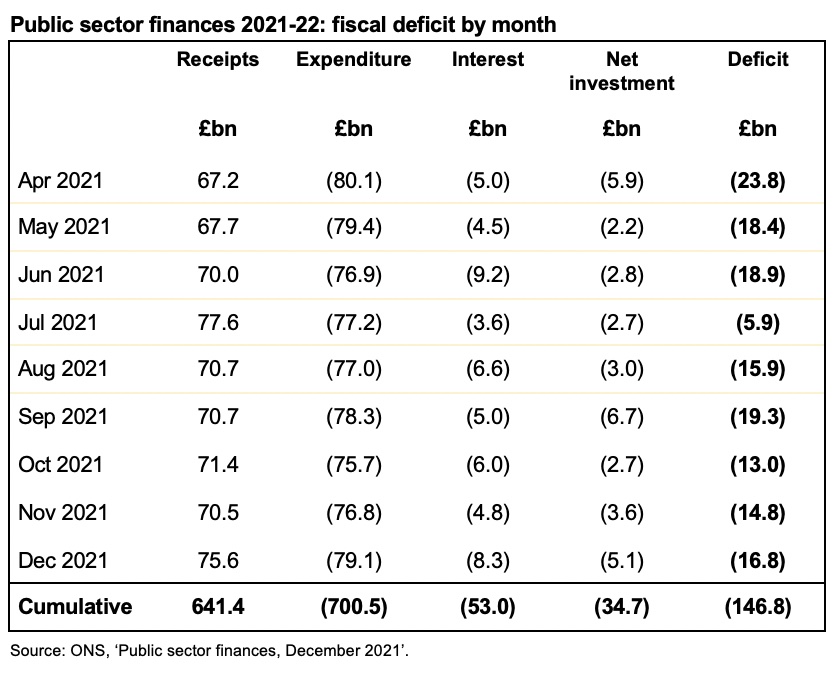
The public sector finances for February 2022, released on Tuesday 22 March 2022, reported a deficit for the month of £13.1bn. This was an improvement of £2.4bn from the deficit of £15.4bn reported for February 2021, but £12.8bn worse than the £0.4bn deficit reported for February 2020.
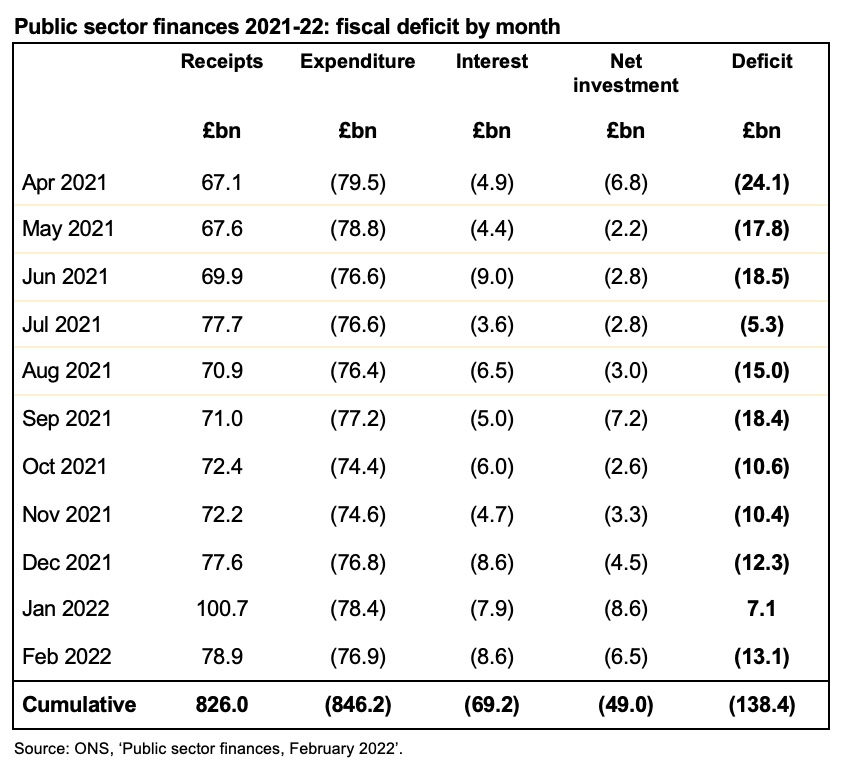
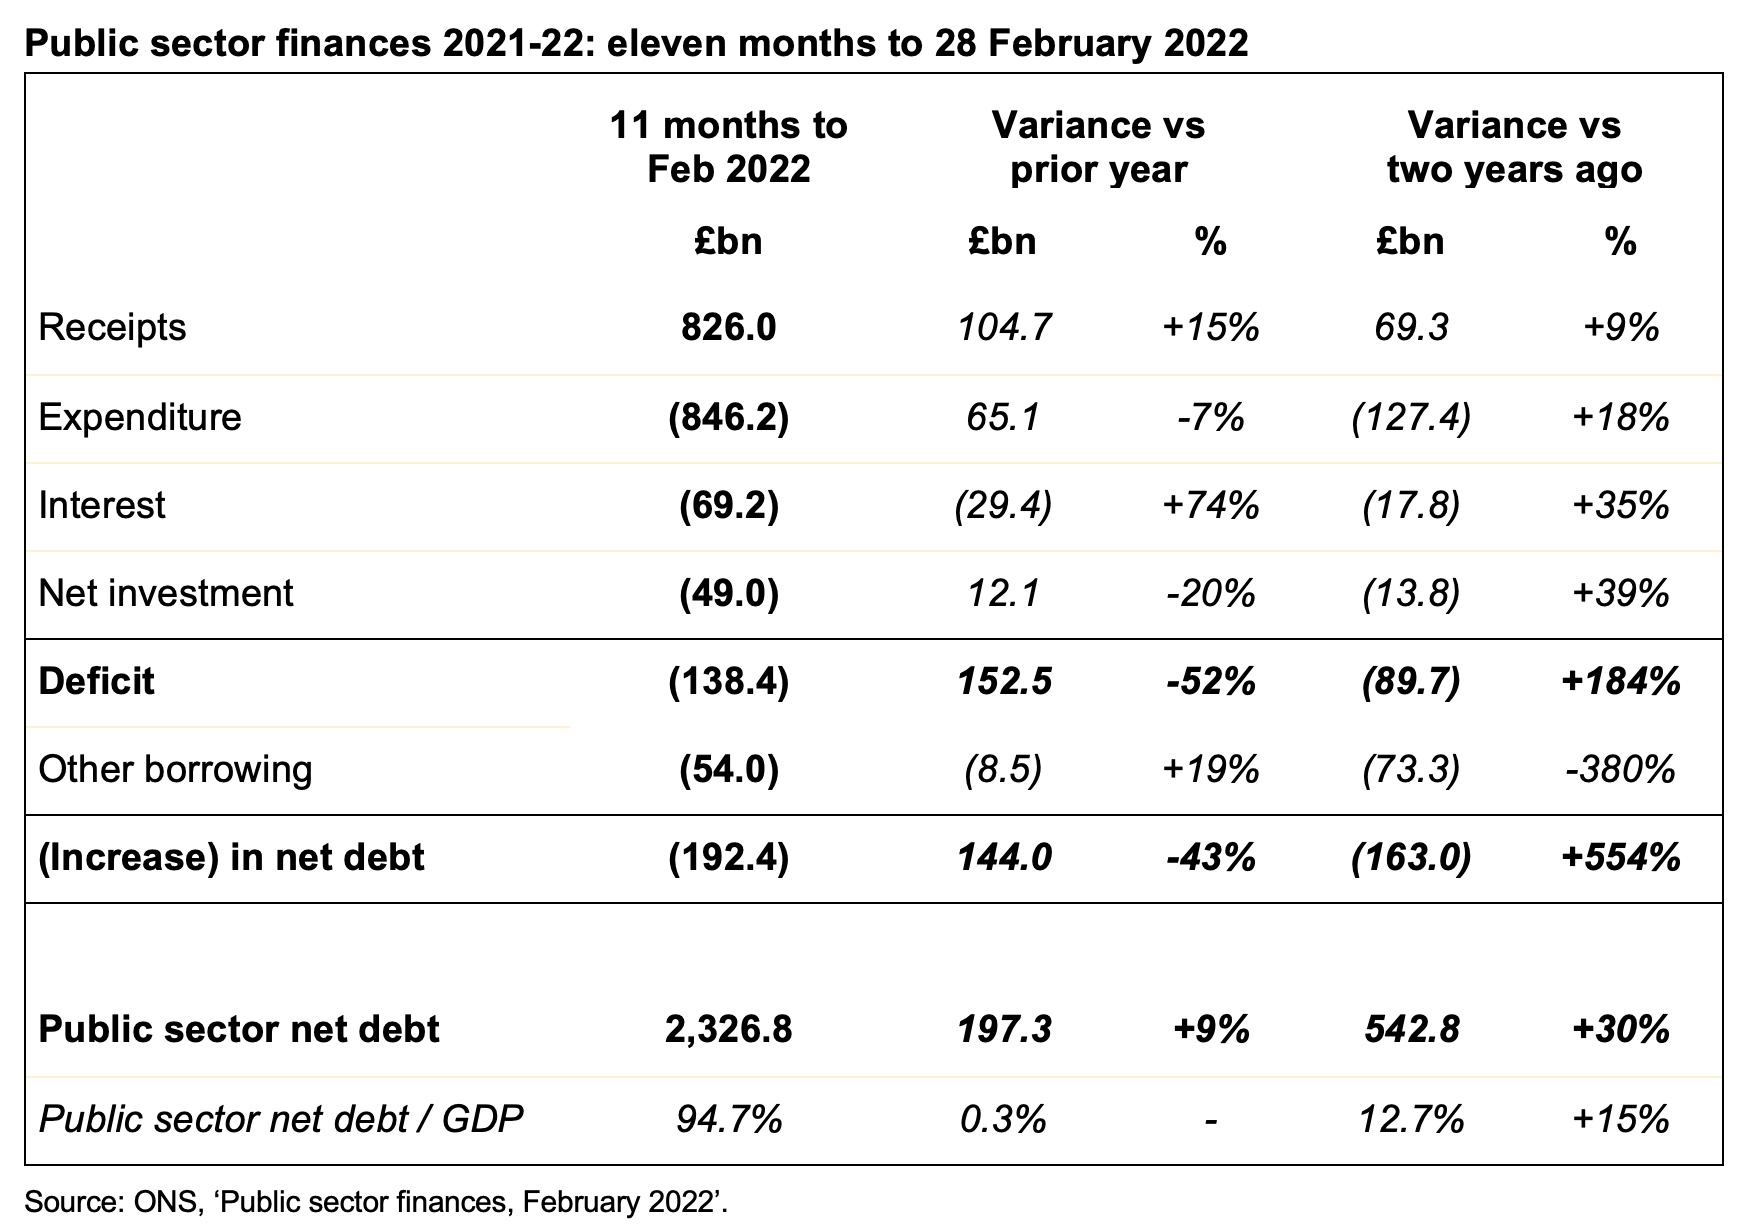
The cumulative deficit of £138.4bn for the first 11 months of the 2021/22 financial year was £0.1bn less than that reported last month, as the £13.1bn deficit for February was offset by £13.2bn in revisions to prior month estimates.
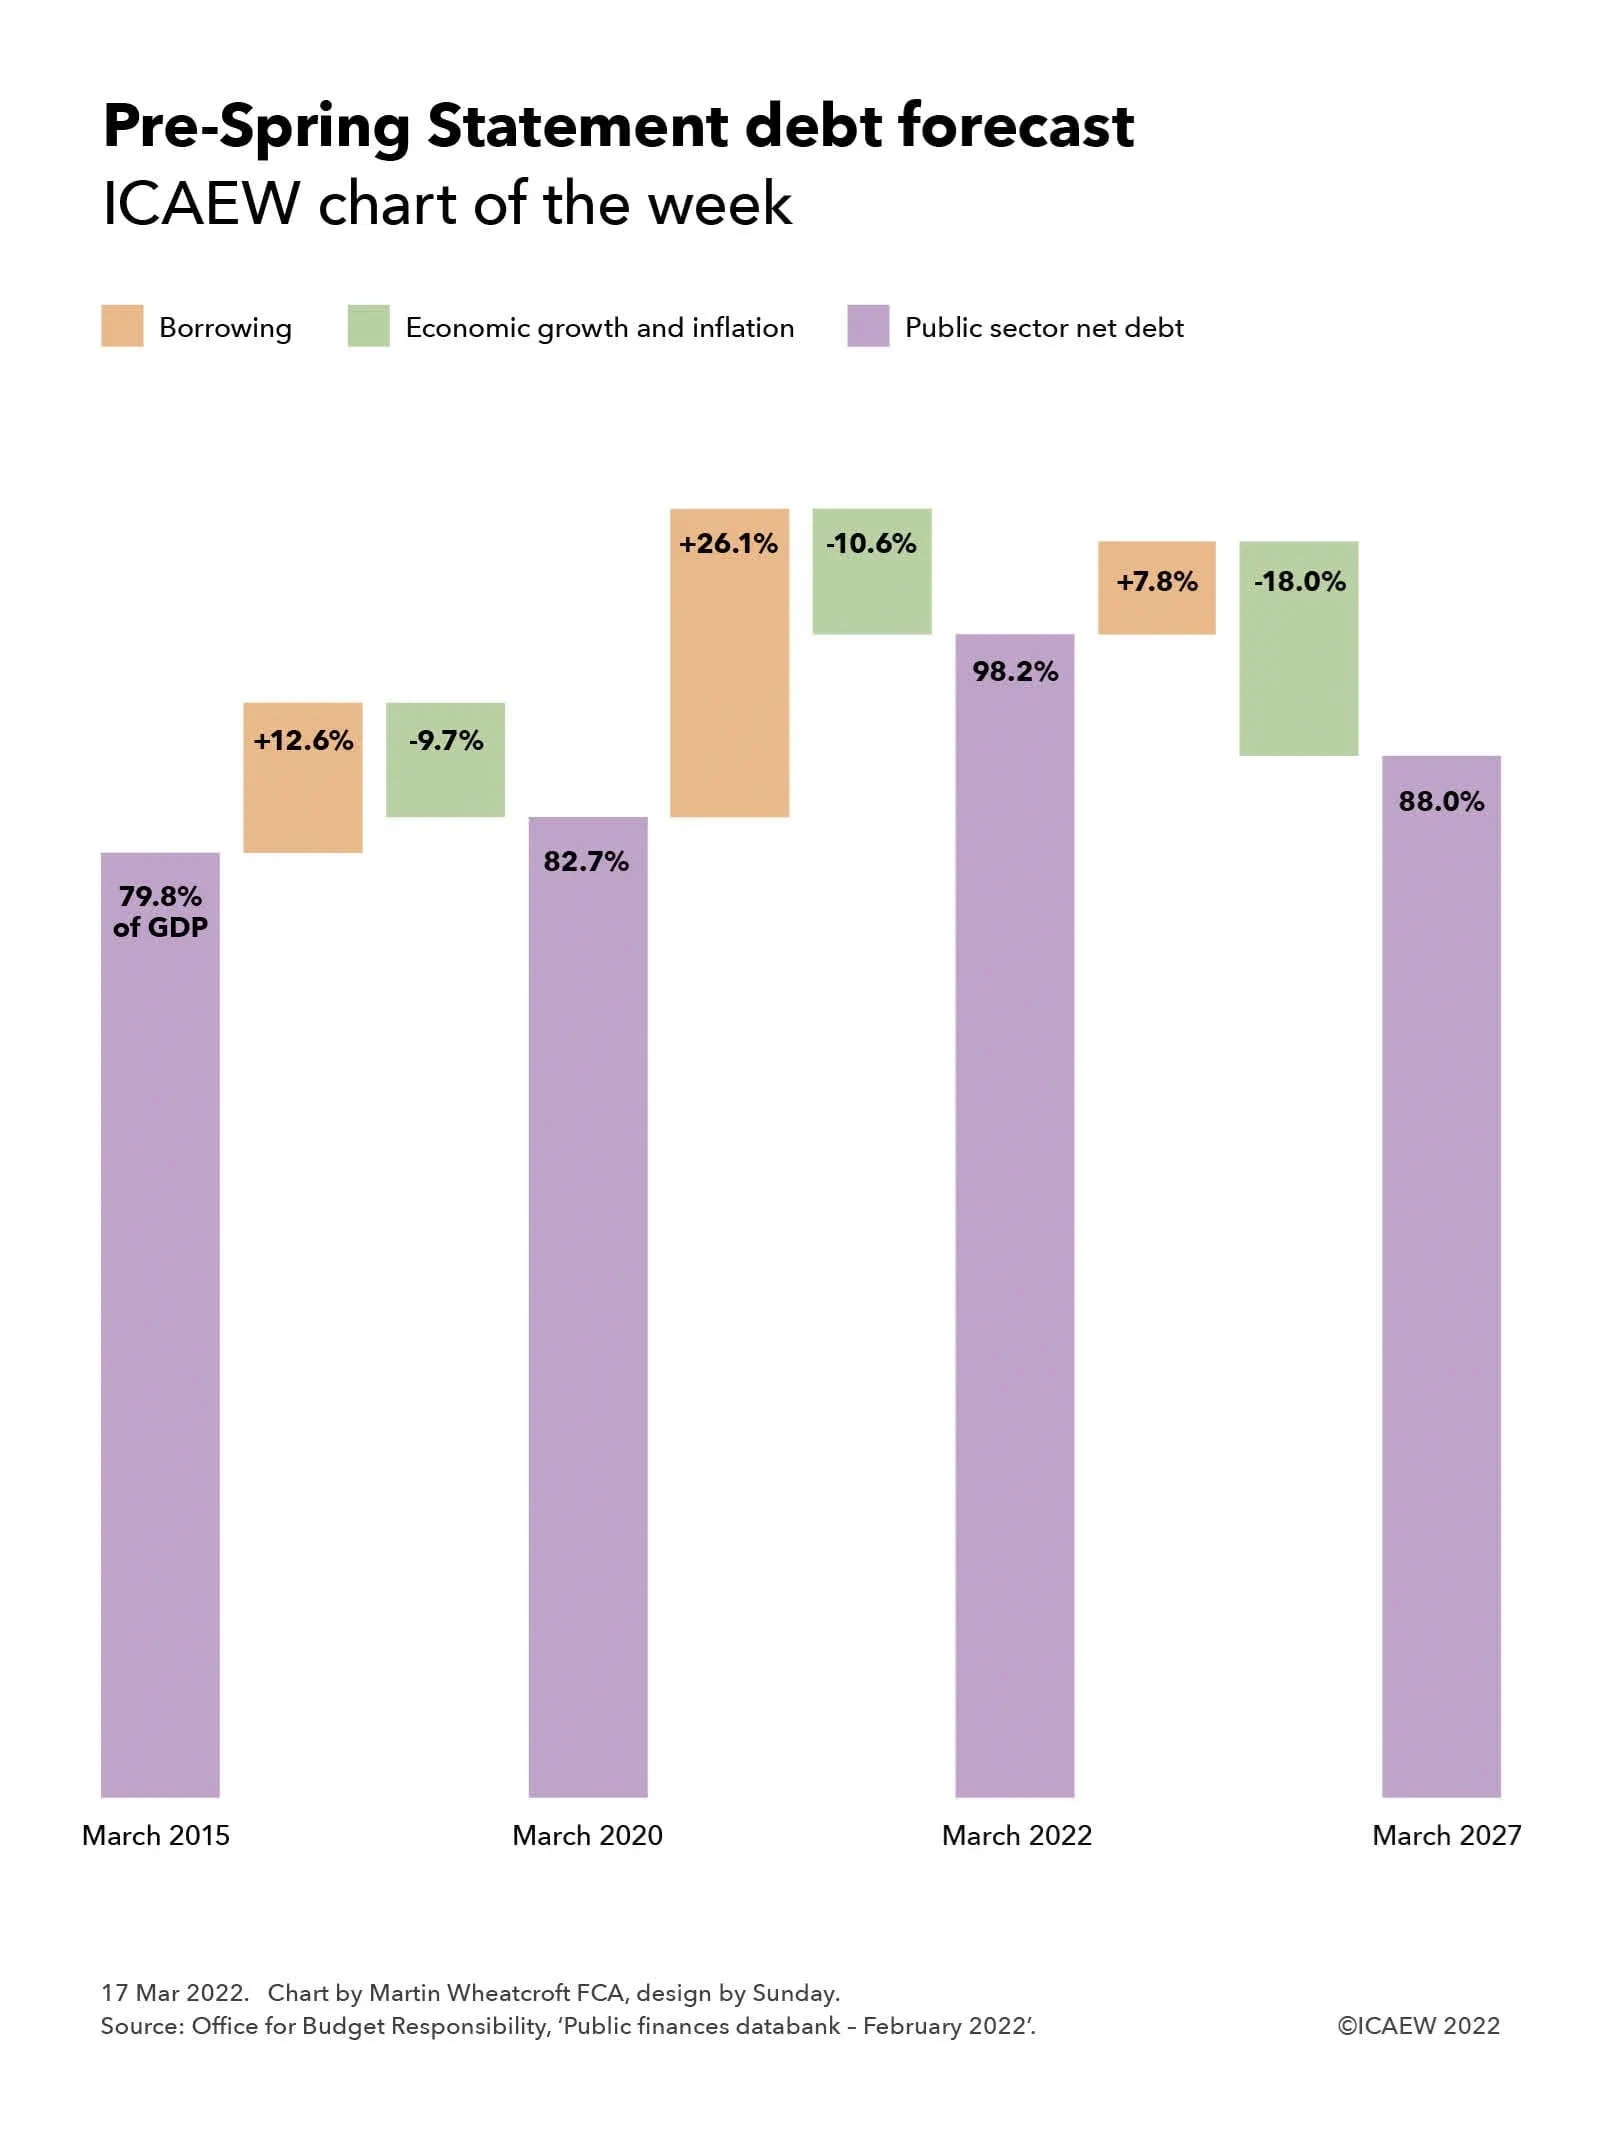
Public sector net debt increased by £6.6bn from £2,320.2bn at the end of January to £2,326.8bn or 94.7% of GDP at the end of February, with tax and loan recoveries partly offsetting the deficit for the month. Despite that, debt is £192.4bn higher than at the start of the financial year and £533.7bn higher than March 2020.
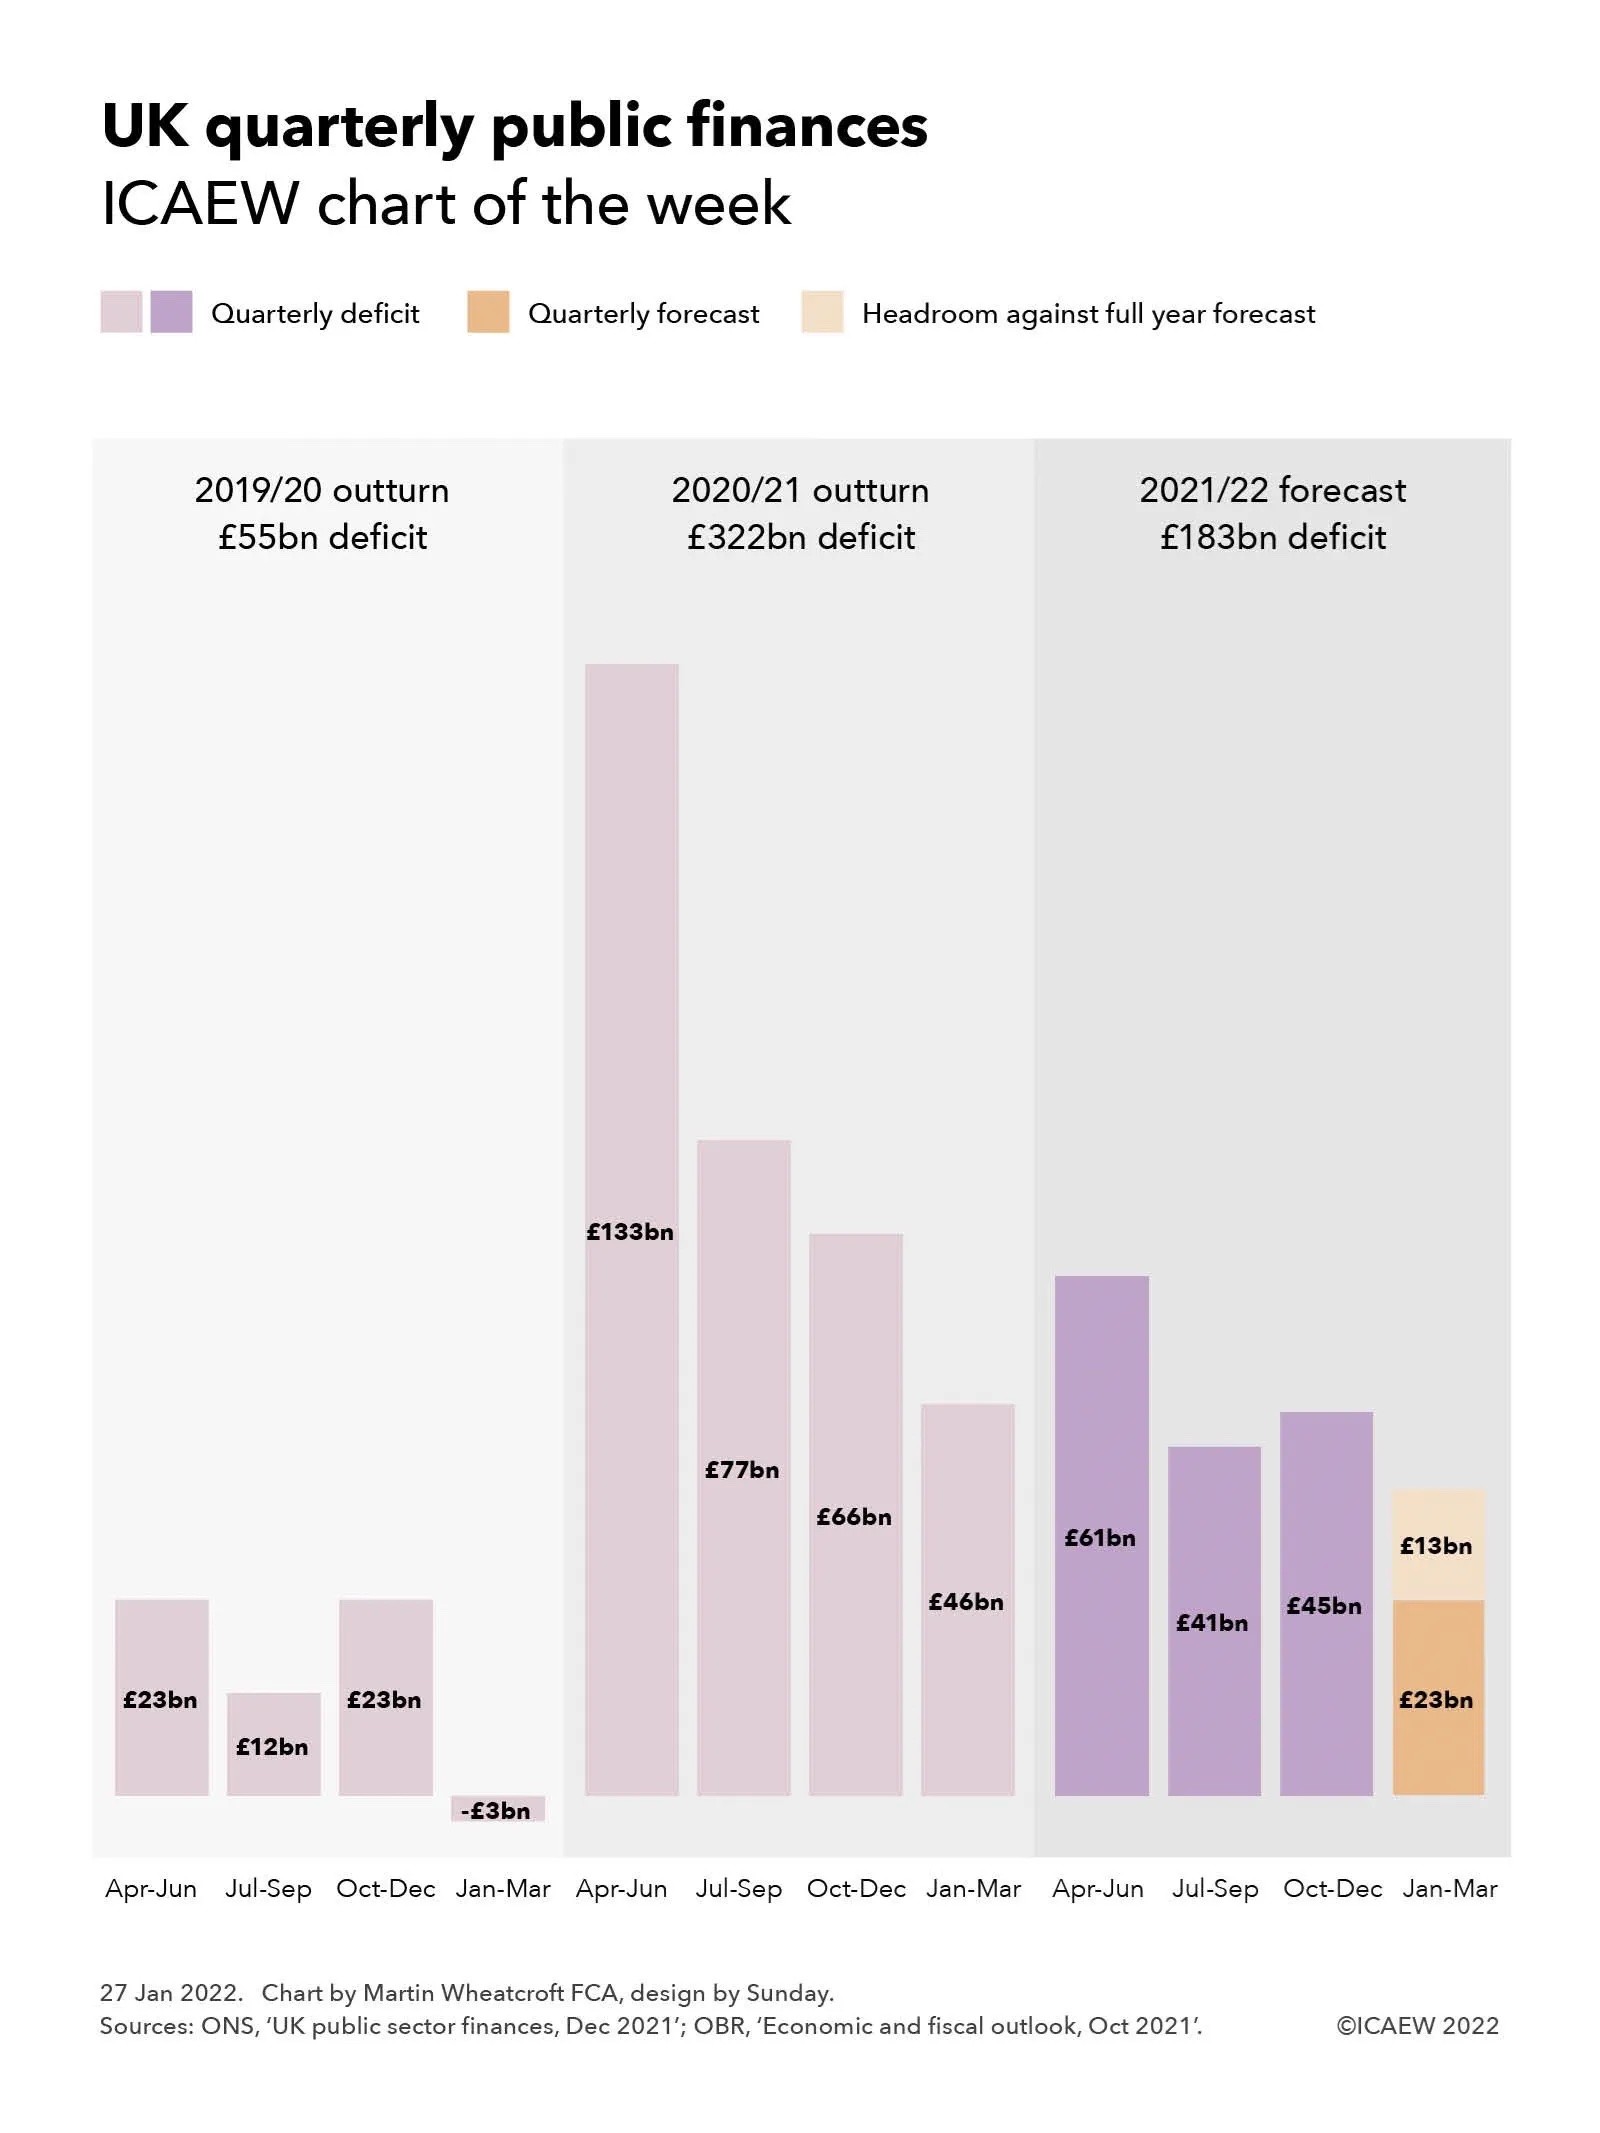
The year-to-date deficit of £138.4bn compares with a cumulative deficit for the first 11 months of the financial year of £290.9bn in 2020/21 and £48.7bn in 2019/20. This was £25.9bn below the forecast published by the Office for Budget Responsibility alongside last October’s Autumn Budget and Spending Review 2021, with higher-than-forecast tax receipts being partially offset by higher-than-forecast interest charges on index-linked debt. Both are driven by higher rates of inflation, which takes more time to feed through to non-interest expenditure. This suggests that the deficit for the full year could end up somewhere in the region of £30bn below the official forecast of £183bn.
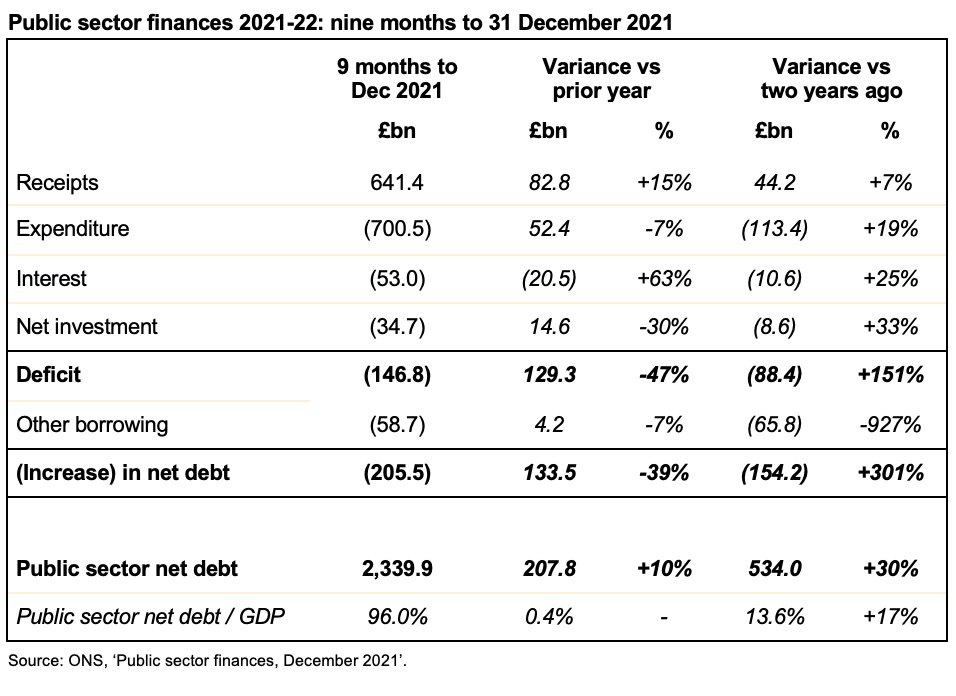
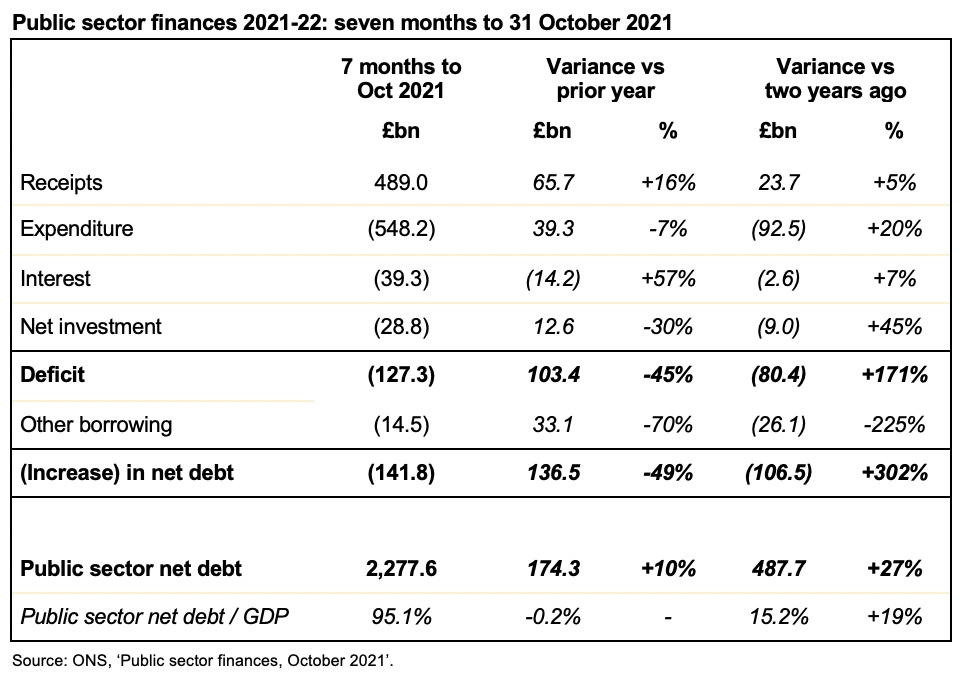
Cumulative receipts in the first 11 months of the 2021/22 financial year amounted to £826.0bn – £104.7bn or 15% higher than a year previously but £69.3bn or 9% above the level seen in the first 11 months of 2019/20. At the same time, cumulative expenditure excluding interest of £846.2bn was £65.1bn or 7% lower than the same period last year, but £127.4bn or 18% higher than two years ago.
Interest amounted to £69.2bn in the eleven months to 28 February 2022, which was £29.4bn or 74% higher than the same period in 2020/21, principally because of the effect of higher inflation on index-linked gilts. Interest costs were £17.8bn or 35% more than in the equivalent 11-month period ended 29 February 2020.
Cumulative net public sector investment up to February 2022 was £49.0bn. This was £12.1bn or 20% below the £29.7bn reported for the first 11 months of last year, which included around £17bn of COVID-19 related lending that the government does not expect to recover. Investment was £13.8bn or 39% more than two years ago, principally reflecting greater capital expenditures, including on HS2.
The increase in debt of £192.4bn since the start of the financial year comprises the cumulative deficit of £138.4bn and £54.0bn in other borrowing. The latter has been used to fund lending to banks through the Bank of England’s Term Funding Scheme, lending to businesses via the British Business Bank (including bounce-back and other coronavirus loans), student loans and other cash requirements, net of the recovery of taxes deferred last year and loan repayments.
Alison Ring OBE FCA, Public Sector and Taxation Director for ICAEW, says: “Today’s numbers show the impact inflation is having on the public finances as it continues to drive both tax receipts and interest costs higher. The deficit for the financial year is expected to be around £30bn lower than October’s official forecast of £183bn, while tomorrow’s Spring Statement forecasts could see a smaller deficit next year than the £62bn expected before the pandemic.
“Uncertainty about the impact of the war in Ukraine on the UK means it will be extremely difficult for the Chancellor to gauge the level of intervention needed to support households and businesses facing rocketing energy prices if he’s to avoid a recession that could permanently damage the economy and the public finances, and still leave room for tax cuts in the Autumn Budget.”
Caution is needed with respect to the numbers published by the Office for National Statistics (ONS), which are expected to be repeatedly revised as estimates are refined and gaps in the underlying data are filled.
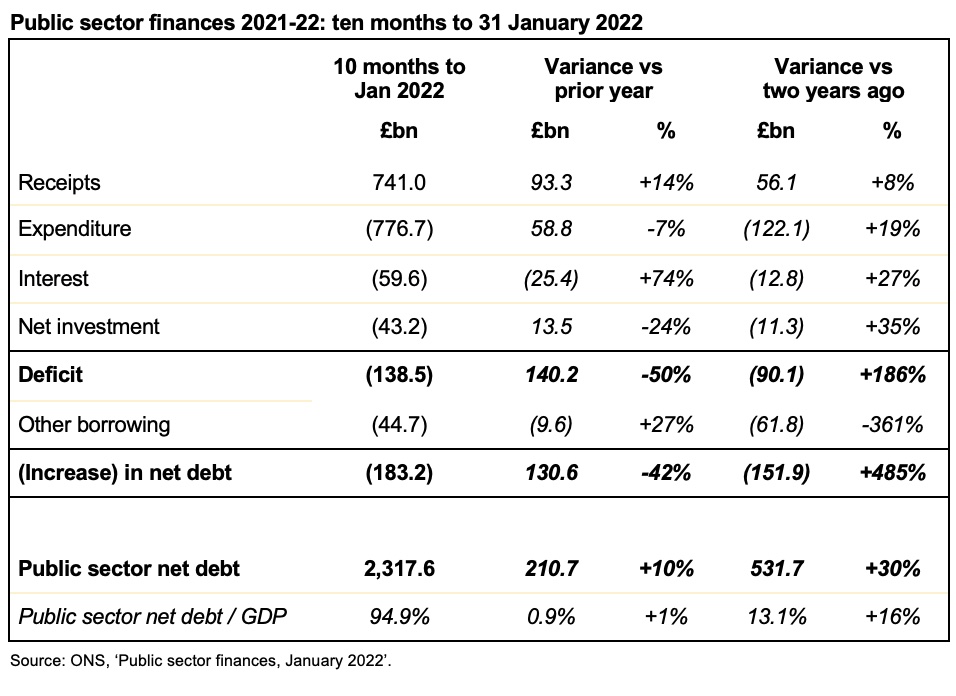
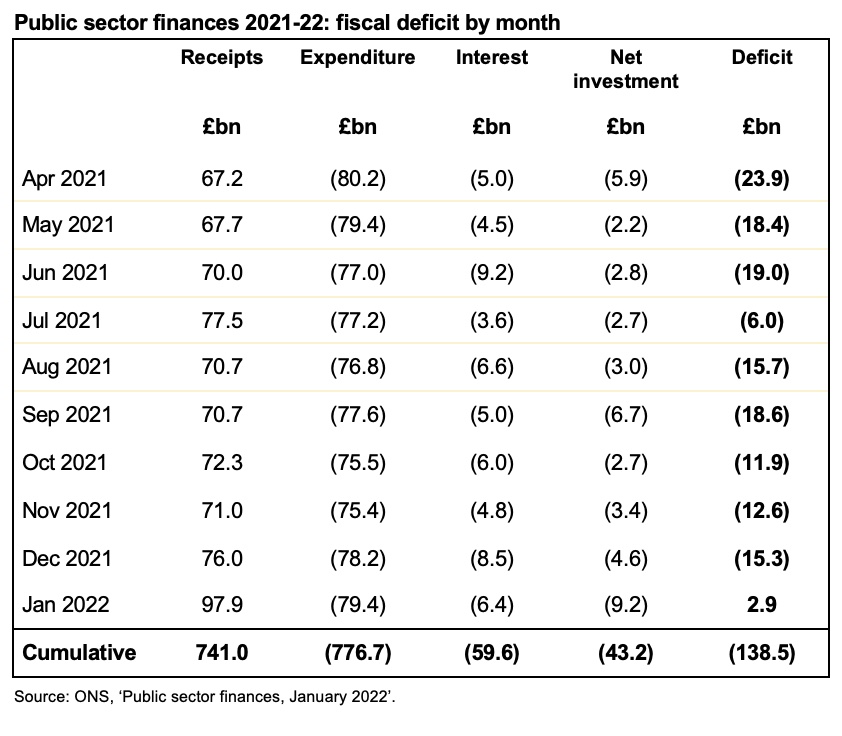
The ONS made a number of revisions to prior month and prior year fiscal numbers to reflect revisions to estimates. These had the effect of decreasing the reported fiscal deficit for the 10 months to January 2022 by £13.2bn from £138.5bn to £125.3bn and reducing the deficit for the year ended 31 March 2021 by £4.1bn from £321.9bn to £317.8bn.