Our chart looks at the projected state school population in England over the next six years, with an anticipated 10% fall in state nursery and primary school pupils implying school closures and mergers are on the way.

According to Department for Education statistics, there were an estimated 8,425,000 school pupils under the age of 16 in England at the start of the current academic year in 2023. Of these, 4,593,000 were in maintained nursery and state primary schools, 3,193,000 were in state secondary schools, 131,000 were in state special schools, 13,000 were in alternative provision, and 496,000 were in independent and other non-maintained schools.
Our chart this week shows how the first two categories are projected to change over the next six years, starting with a projected 10% fall in pupil numbers in state nursery and primary schools from 4,593,000 in the current academic year to 4,113,000 in the academic year starting in 2029.
Meanwhile the number of state secondary school pupils under the age of 16 at the start of the academic year is expected to increase from 3,193,000 in this academic year to peak at 3,244,000 next year before gradually declining to 3,146,000 in 2029, a fall of 3% from the peak.
Driven by a falling birthrate, the 10% projected fall in state nursery and primary school pupils is likely to be a major issue across England and a political hot potato for the next government. Larger primary schools may be able to cut the number of classes (ironically increasing class sizes) to mitigate reduced income from falling rolls, but this may not be enough. Smaller schools with just one class per year will find it more difficult to find savings.
Closures and mergers are likely, as are a rise in ‘save our local school’ campaigns as academy trusts and local authorities seek to find savings in response.
The 3% decline from the peak in secondary school pupil numbers will also present major challenges, especially as the fall in numbers is unlikely to be spread evenly across all state secondaries. Some will see smaller falls or even rises in their school rolls, while others will see a much greater drop in their intakes. Again, reducing the number of classes in each year is a likely response for those affected, but some closures and mergers are almost inevitable.
These projections are subject to some uncertainty, despite the core numbers being based on children who have already been born that are likely to stay in the English education system for the entirety of their school careers. The level of migration is a key assumption and could lead to even lower pupil numbers if recently implemented restrictions on the eligibility of immigrants to bring dependents with them are effective. The projections also assume a relatively stable number of pupils going to private schools, which may need to be adjusted in the light of Labour’s proposals to add 20% VAT to school fees.
These statistics are prepared on a full-time equivalent basis, but these are deemed to be the same as total pupil numbers for each age group, apart from the under 5s. Many nursery pupils and primary school reception class students only attend on a part-time basis, with 974,000 under 5s converting into 874,000 full-time equivalents (FTEs) in the current academic year. These numbers exclude most under 5s who attend private nurseries, receive other forms of childcare, or stay at home.
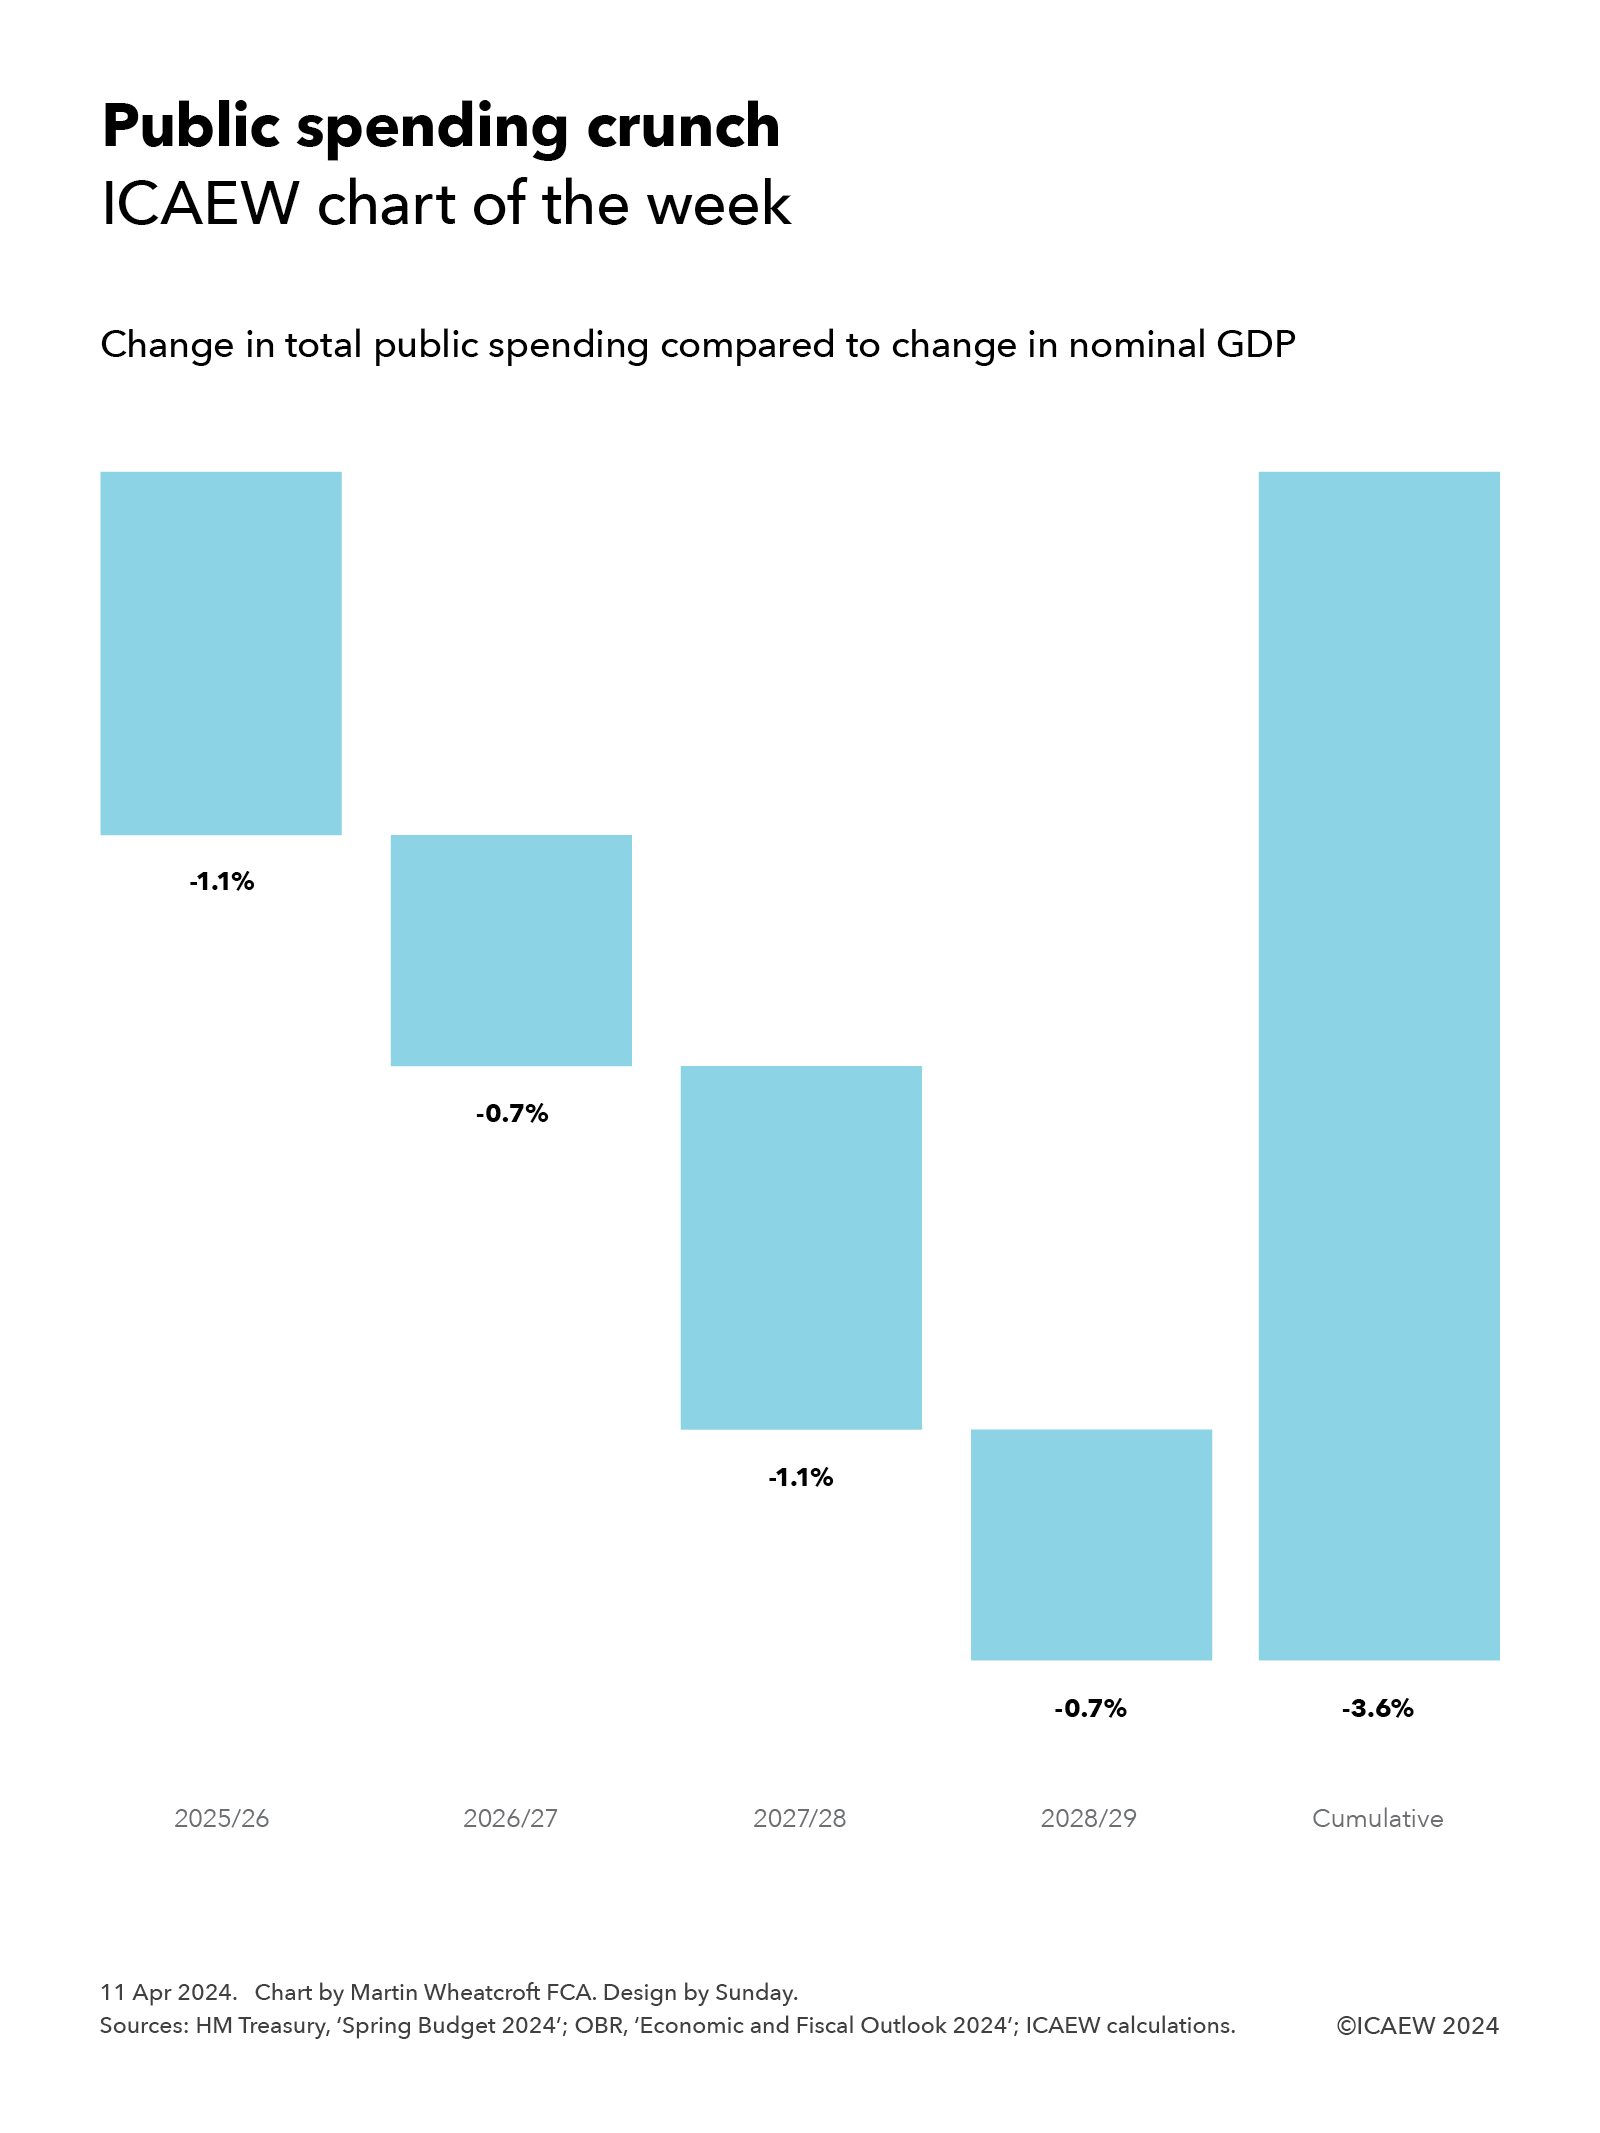
In theory, falling school rolls should reduce pressures on the education budget while at the same potentially increasing per-pupil funding, depending on how much is cut from the school budget. However, with the Spending Review now scheduled for after the general election likely to result in upward revisions to the Spring Budget 2024 medium-term spending plans, any such savings are likely to be swallowed up.