ICAEW chart of the week: Tax Day

26 March 2021: ICAEW’s chart this week is in honour of Tax Day, the newest fiscal event in the government calendar where reforms of the tax system under consideration are opened up to consultation.

Chart showing components of tax receipts of £732bn in 2021-22 and changes to the £928bn projected in 2025-26.

Numbers for chart elements included in the text below.

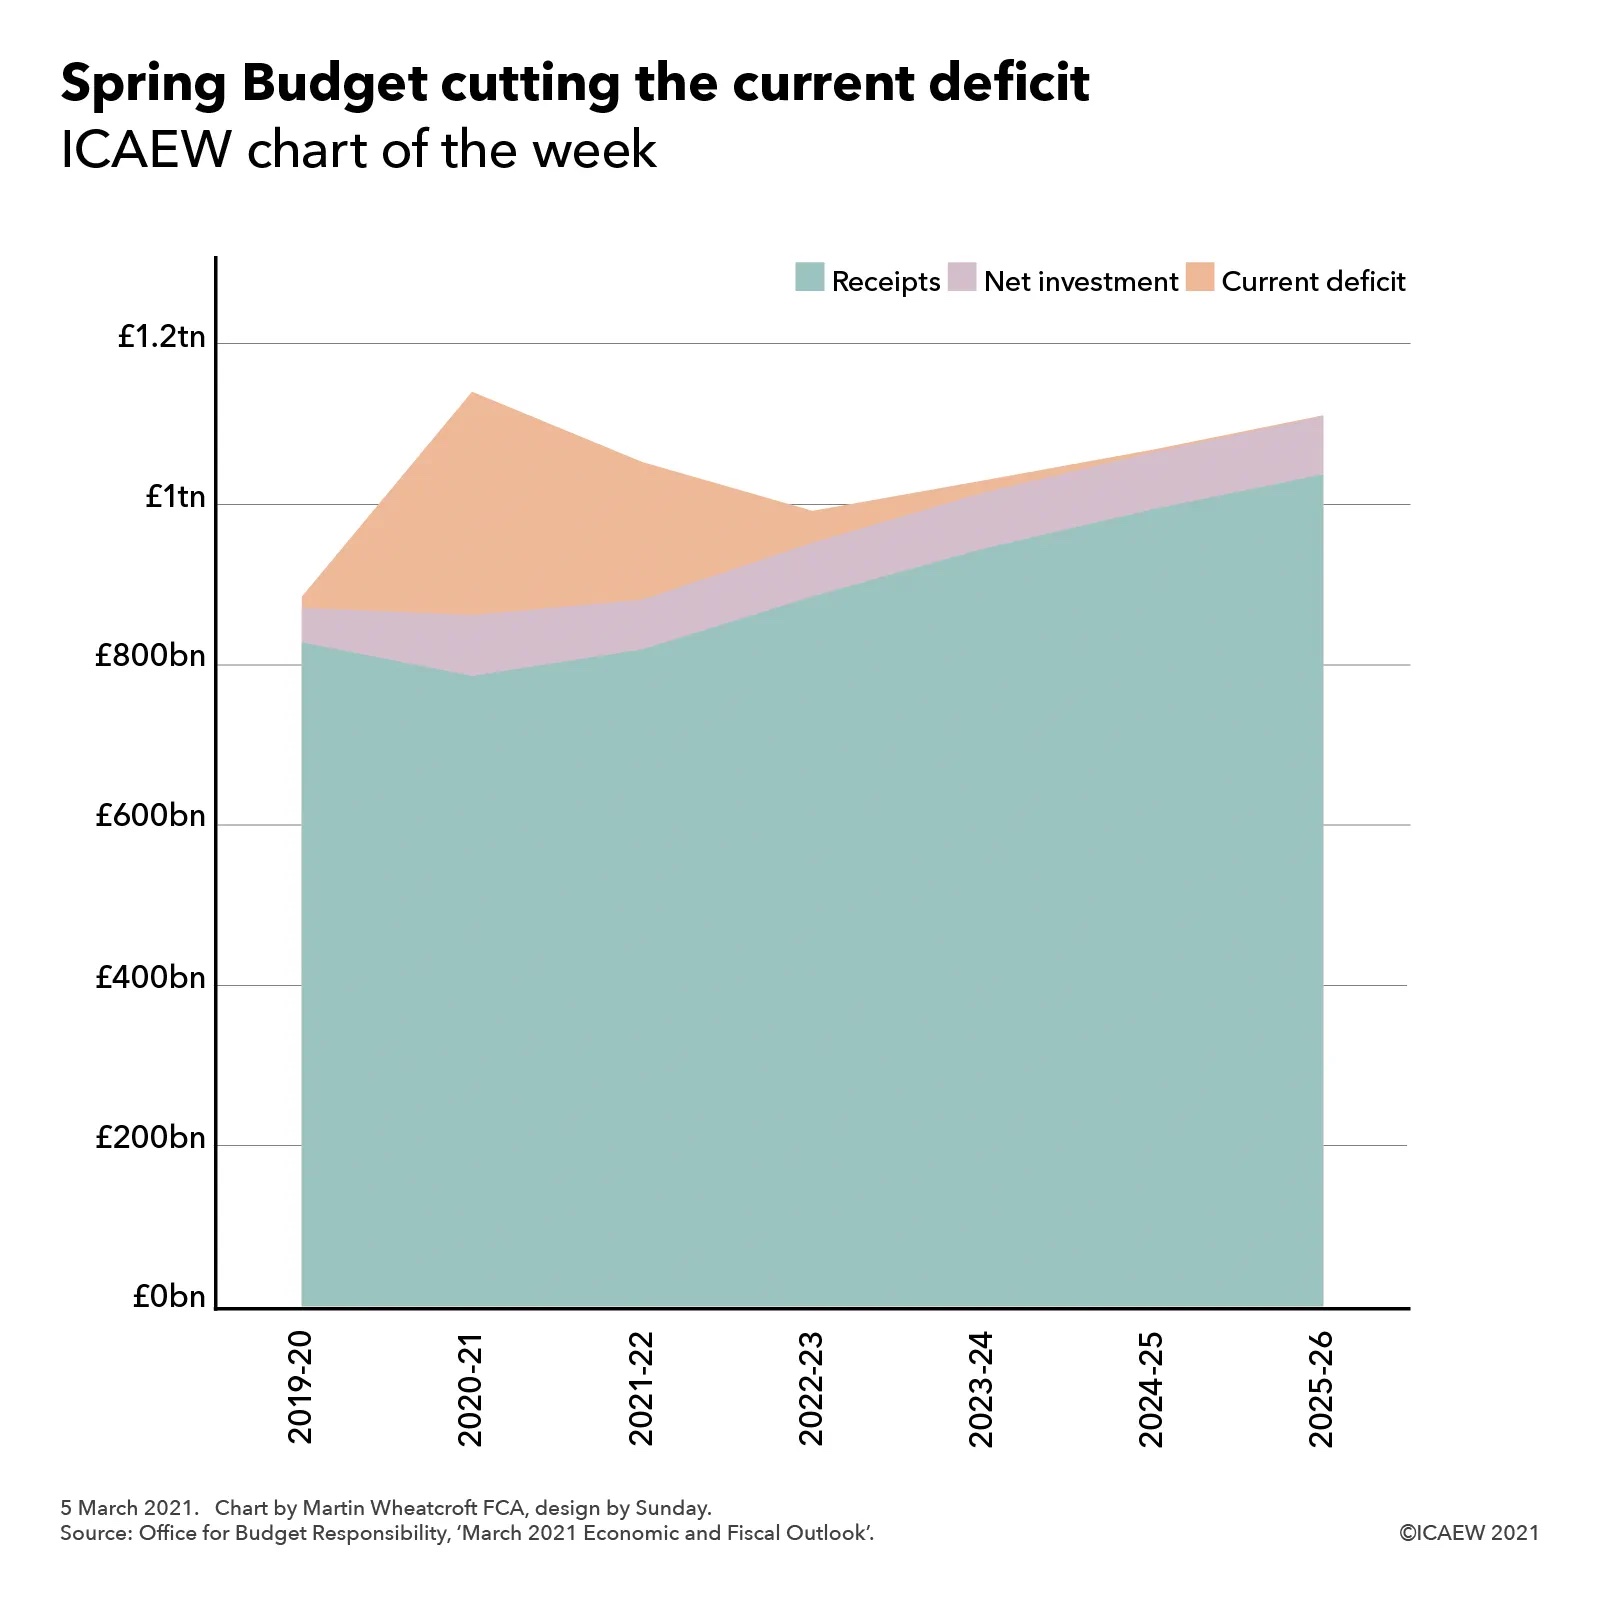
The #icaewchartoftheweek starts with the Spring Budget forecast tax receipts of £732bn for the coming financial year from 1 April 2021 and how these are expected to increase to £928bn in 2025-26 through a combination of economic growth, inflation and higher receipts principally from corporation tax, income tax, VAT and business rates. 

The chart illustrates how the ‘big three’: income tax (£198bn in 2021-22), VAT (£151bn) and national insurance (£147bn) together comprise 67.8% of the total tax take, with corporation tax (£40bn), council tax (£40bn), fuel duties (£26bn), business rates (£24bn), alcohol & tobacco duties (£22bn), stamp duty (£12bn) generating a further 22.4%. The next 5 taxes – environmental levies (£10bn), capital gains tax (£9bn), insurance premium tax (£7bn), vehicle excise duties (£7bn) and inheritance tax (£6bn) – generate 5.3%, while all other taxes (£33bn) comprise the balance of 4.5%.

With the Chancellor constrained by a commitment not to raise the main rates of income tax, VAT and national insurance, the principal focus of both the Spring Budget and Tax Day has been on improving the tax take from existing taxes, for example by looking at tax reliefs and tackling tax avoidance, and on raising more money from smaller taxes.

This is reflected in the Office for Budget Responsibility projections for tax receipts that accompanied the Spring Budget, which indicate that receipts from most taxes are expected to rise broadly in line with economic growth (generating £80bn in higher tax receipts) and inflation (£46bn) between 2021-22 and 2056-26. This reflects anticipated economic recovery from the pandemic as well as a boost from stimulus measures announced by the Chancellor in addition to existing plans to increase public investment.

The biggest incremental change is an expected increase in corporation tax receipts of £38bn over and above economic growth and inflation. Some of this rise is recovery to a more normal level, as businesses will be able to reduce their tax bills in the coming year by offsetting losses incurred during the pandemic and using the temporary ‘super deduction’ of 130% of qualifying capital expenditure, but the principal driver is an increase in the corporation tax rate on larger businesses from 19% to 25% in 2023.

The next highest increases are from income tax (+£16bn) and VAT (+£9bn) where a combination of fiscal drag from freezing tax allowances (income tax) and registration thresholds (VAT) will bring more transactions into the scope of both taxes and hence generate more revenue. Both taxes are also the focus of efforts to make taxes easier to pay and to tackle tax avoidance as addressed in several of the Tax Day consultations. 

The other significant increase is in business rates (+£7bn), although this mostly reflects pandemic related reliefs in the coming financial year that are not expected to continue into subsequent financial years. In practice, there are some questions as to whether this increase will be deliverable, with the Tax Day consultation on business rates suggesting that levels are too high and a reduction could help bricks and mortar businesses survive against online competition and so ‘save the high street’. The dilemma for the Chancellor is that if he were to cut business rates as some hope, then what tax lever he would need to pull to make up for that lost revenue?

Much of the focus of this first Tax Day has been on the efficiency and effectiveness of the tax system and how it can be made to work better. Perhaps future Tax Days will tackle some of the bigger questions surrounding the role of taxation in the long-term sustainability and resilience of the public finances – and whether some bigger tax levers might need to be pulled at some point in the future?

This chart was originally published by ICAEW.

ICAEW chart of the week: global military spending

19 March 2021: The UK’s Integrated Review is the inspiration for this week’s chart, illustrating the 20 countries around the world that spend the most on their militaries.

Chart showing global military spending in 2019 led by USA (£526bn) and China (£200bn) followed by 18 other countries - see text below the chart for details.

The UK Government launched its Integrated Review of Security, Defence, Development and Foreign Policy on 16 March 2021, setting out a vision for the UK’s place in the world following its departure from the European Union and in the context of increasing international tensions and emerging security threats.

At the core of the Integrated Review is security and defence, and ICAEW’s chart of the week illustrates one aspect of that by looking at military spending around the world. 

The chart shows spending by the top 20 countries, which together comprise in the order of £1.2tn of estimated total military spending of around £1.4tn to £1.5tn globally in 2019 – an almost textbook example of the 80:20 rule in action.

More than a third of the total spend is incurred by just one country – the USA – which spent in the order of £526bn in 2019 converted at current exchange rates. The next biggest were China and India at £200bn and £50bn respectively, although differences in purchasing power mean that they can afford many more soldiers, sailors and aircrew for the same amount of money. This is followed by Saudi Arabia (£45bn), Russia (£41bn), France (£38bn), the UK (£38bn), Germany (£38bn), Japan (£34bn), South Korea (£33bn), Australia (£21bn), Italy (£20bn), Canada (£17bn), Israel (£16bn), Brazil (£14bn), Spain (£13bn), Turkey (£11bn), the Netherlands (£9bn), Iran (£9bn) and Poland (£9bn).

Exchange rates affect the relative orders of many countries in the list, for example between Russia, France, the UK and Germany which can move up or down according to movements in their currencies, while there are a number of caveats over the estimates used given the different structures of armed forces around the world and a lack of transparency in what is included or excluded in defence budgets in many cases.

In addition, the use of in-year military spending does not necessarily translate directly into military strength. Military capabilities built up over many years or in some cases (such as the UK) over many centuries need to be taken into account, as do differing levels of technological development and spending on intelligence services, counter-terrorism and other aspects of security. Despite these various caveats, estimated military spending still provides a useful proxy in understanding the global security landscape and in particular highlights the UK’s position as a major second-tier military power – in the top 10 countries around the world.

Global Britain in a Competitive Age: the Integrated Review of Security, Defence, Development and Foreign Policy sets out some ambitious objectives for security and defence, which it summarises as follows: “Our diplomatic service, armed forces and security and intelligence agencies will be the most innovative and effective for their size in the world, able to keep our citizens safe at home and support our allies and partners globally. They will be characterised by agility, speed of action and digital integration – with a greater emphasis on engaging, training and assisting others. We will remain a nuclear-armed power with global reach and integrated military capabilities across all five operational domains. We will have a dynamic space programme and will be one of the world’s leading democratic cyber powers. Our diplomacy will be underwritten by the credibility of our deterrent and our ability to project power.”

The estimates of military spending used in the chart were taken from the Stockholm International Peace Research Institute (SIPRI)’s Military Expenditure Database, updated to current exchange rates.

This chart was originally published by ICAEW.

ICAEW chart of the week: Debt to GDP ratio

12 March 2021: This week’s chart illustrates how an expected increase of £1tn of additional public debt between 2020 and 2026 translates into the debt to GDP ratio.

Chart showing public sector net debt increased from £1,798bn (84.4% of GDP) at March 2020 to £2,747bn (109.7%) at March 2024 and £2,804bn (103.8%0 at March 2026.

This week’s #icaewchartoftheweek illustrates how a trillion pounds of extra public debt translates into the debt to GDP ratio. This rises from 84.4% last March to a forecast peak of 109.7% in 2024 before falling to 103.8% in 2026, according to the medium-term economic and fiscal forecasts from the Office for Budget Responsibility (OBR) that accompanied the Spring Budget. These forecast a rise in public sector net debt from £1.8tn at 31 March 2020 to £2.8tn at 31 March 2026.

Most of the additional borrowing is expected to occur in the period to March 2024, with £781bn (equivalent to 35.2% of a year’s GDP) borrowed to fund four years of deficits – an estimated £355bn (16.9% of GDP) in the current financial year and forecast deficits of £234bn (10.3% of GDP), £107bn (4.5% of GDP) and £85bn (3.5% of GDP) in 2021-22 through 2023-24 respectively. A further £168bn (7.5% of GDP) is needed over that same period to fund lending and working capital requirements.

Despite borrowing the equivalent of 42.7% of GDP, the debt to GDP ratio is expected to increase by a smaller amount – 25.3% of GDP from 84.4% at 31 March 2020 to 109.7% of GDP at 31 March 2024. This reflects an increase in the denominator for GDP, as a combination of inflation and economic growth ‘inflate away’ the debt by the equivalent of 17.4% over four years. This effect appears quite large, given the annualised growth of 0.7% a year forecast over the four years (comprising a 12% fall during the current financial year followed by growth of 10% in the coming financial year, 5% in 2022-23 and 1.5% in 2023-24) and an average GDP deflator inflation rate of 1.8%, but the magic of compounding, combined with timing differences in the value for GDP used in the calculation all multiply up.

The following two years see the forecast debt to GDP ratio decline to 103.8%. Debt is only expected to increase by £57bn (or 2.2% of GDP) over these two years because lending to businesses during the pandemic is expected to be repaid, reducing the £148bn (5.7% of GDP) needed to fund deficits of £74bn (2.9% of GDP) in 2024-25 and £74bn (2.8% of GDP) in 2025-26 by a net cash inflow of £91bn (3.5% of GDP). As a consequence, the debt to GDP ratio is forecast to drop by 5.9% overall once 8.1% of ‘inflating away’ is taken into account.

As with all forecasts, the reality will be different. A stronger economic recovery would both reduce the need for borrowing and increase the size of GDP at the same time, accelerating the decline in the debt to GDP ratio. A weaker recovery combined with higher spending in response to pressures on public services and/or higher interest rates might do the reverse. Either way, the debt to GDP is likely to remain at a significantly higher level than the pre-financial crisis 34% seen in 2008 for many years, if not decades, to come.

This chart was originally published by ICAEW.

ICAEW chart of the week: Spring Budget cutting the current deficit

5 March 2021: The Budget provides the basis for this week’s chart, which illustrates government plans to achieve a current budget surplus to meet a new fiscal rule that hasn’t yet been formally announced but was hinted at.

Chart showing receipts, net investment and the current deficit from 2019-20 to 2025-26, showing very large current deficit in 2020-21 falling to almost zero by 2025-26.

The Chancellor will use a corporation tax rise and spending cuts to cut the current deficit over the next five years, but this relies on the economy recovering as expected and being able to restrain pressures on public spending.

The current deficit – the difference between receipts and expenditure excluding net investment – is expected to go from £14bn in 2019-20 to £279bn in the current financial year before falling to £172bn in 2021-22, £40bn in 2022-23, £15bn in 2023-24, £3bn in 2024-25 and just under £1bn in 2025-26 – almost, but not quite meeting the anticipated fiscal rule hinted at by Rishi Sunak in his Budget speech.

This will only be achievable if the pandemic can be brought under control so that support measures are no longer needed, in addition to depending on the strength of the economic recovery. The government will be hoping that the economic stimulus it plans to provide over the next two years will help drive that growth, with the hope of higher corporate profits to pay a higher rate of corporation tax over the rest of the period.

Despite the uncertainties around the numbers, the Chancellor felt it necessary to trim £4bn a year from public spending to get within touching distance of meeting his non-target – signalling his commitment to ‘fiscal responsibility’ and helping to achieve his other main non-target, which is to see the debt to GDP ratio start to fall after peaking at 110% of GDP in 2024. However, a number of commentators have suggested that this appears unlikely to be achievable, given both pre-existing pressures on public spending and a likely need to provide additional post-pandemic support to the NHS, social care and education in particular.

This provides a challenging context for the three-year Comprehensive Spending Review later this year, especially as the longer-term challenges facing the public finances remain unaddressed. In the nearer term though, the Chancellor will be hoping for a bigger bounce back to the economy over the summer to provide him with more room for manoeuvre in the autumn.

This chart was originally published by ICAEW.

ICAEW chart of the week: an unsustainable path

26 February 2021: The Chancellor needs to build a bridge to economic recovery in his first Budget on Wednesday, focusing on jobs, exports and investment. But with the OBR’s official projections showing public debt to be on an unsustainable path, what vision will he set out for the public finances in the long-term?

The Spring Budget announcement on Wednesday will primarily be about the government’s fiscal budget for the financial year commencing 1 April 2021. The UK is still in the midst of a major health emergency and in a difficult economic situation, and the announcement is likely to provide for an extension of support measures for businesses and individuals affected by the pandemic, funding for under-pressure public services and stimulus measures to drive economic growth once restrictions are lifted, particularly in the second half of the financial year. 

In the absence of a formal fiscal strategy event in the Parliamentary calendar, the Budget is also the main forum the Chancellor has to discuss the medium and long-term prospects for the public finances. This includes considering the five-year fiscal forecasts prepared by the Office for Budget Responsibility (OBR), as well as setting out any medium-term fiscal rules the government might want to use in determining its tax and spending plans and in demonstrating financial credibility with debt investors and citizens.

What is often less discussed is the long-term path for the public finances, which – as the #icaewchartoftheweek illustrates – is on an unsustainable path according to the official 50-year fiscal projections prepared by the OBR last July.

These projections indicate that, in the absence of government action, public debt will rise steadily over the next fifty years as public spending grows in line with anticipated demand, and increasing amounts of borrowing will be needed to cover the shortfall between that spending and the amount collected in taxes. It is important to understand that these projections were already on this path before the pandemic arrived and the principal difference between the OBR’s 2020 and 2018 projections is that the initial level of debt has increased from in the order of 80% to just over 100% of GDP. The starting point may be higher, but the fundamental issues haven’t changed.

This financial backdrop permeates every Budget and is the reason the Chancellor finds himself constrained in the choices he can make, despite ultra-low interest rates that currently permit him to borrow huge sums for one-off expenditures at almost no cost. He doesn’t have the same freedom when it comes to permanent increases in spending, whether that be on health, social care, welfare, education, defence or other public services, especially if he wants to minimise the scale of any potential tax increases. Of course, higher economic growth would help – but as successive Chancellors have found that is not so easy to deliver.

So while much of the focus on the Budget on Wednesday will be on the short-term extension of the life support package for individuals and businesses while restrictions remain in place and the economic stimulus thereafter, the Chancellor’s words will also be scrutinised for his vision on the direction of travel for the public finances beyond the end of the next financial year.

This chart was originally published by ICAEW.

ICAEW chart of the week: US federal budget baseline projections

19 February 2021: Congressional Budget Office expects a decade of trillion-dollar deficits as the US public finances are hit by the pandemic.

The US Congressional Budget Office (CBO) recently updated its ten-year fiscal projections for the federal budget, providing the subject for this week’s #icaewchartoftheweek. 

As the chart illustrates, there was a shortfall of $3.1tn between revenues and spending by the federal government in the year ended 30 September 2020, with a projected deficit of $2.3tn in the current financial year and deficits ranging from $0.9tn to $1.9tn over the coming decade.

The CBO is at pains to stress that its projections are not a forecast of what will happen but instead, provide a baseline against which decisions can be assessed. This is particularly relevant at the moment as Congress debates a potential $1.9tn stimulus plan that would increase this year’s deficit significantly if passed.

On the path shown in the projections, the CBO calculates that debt held by the public will increase from $21.0tn (100% of GDP) in 2020 up to $35.3tn (107% of GDP) by 2031. Will policymakers in the US be comfortable in continuing to run with such a high level of debt compared with pre-pandemic levels of around 80% of GDP and a pre-financial crisis level of less than 40%?

The projections are based on assumed economic growth excluding inflation of 4.6% in the current financial year following on from a fall of 3.5% last year, with the recovery continuing into 2022 with growth of 2.9%. Economic growth over the following nine years to 2031 is expected to average around 1.9%. This is much lower than the average rate of growth experienced before the financial crisis just over a decade ago but may still prove optimistic given the potential for a recession at some point over the next ten years.

The UK counterpart to the CBO – the Office for Budget Responsibility (OBR) – is currently working its abacus quite hard on updating its five-year projections ready for the Budget on 3 March. The OBR’s projections will be extremely useful in understanding the near-term path in the UK’s public finances, including the effect of any tax and spending announcements that may be featured in the Budget. Unfortunately, they will be less useful than the CBO’s projections in that they are not expected to provide a refreshed baseline for the second half of the decade when the hard work of starting to repair the public finances is expected to take place.

This chart was originally published by ICAEW.

ICAEW chart of the week: CP Trans-Pacific Partnership

12 February 2021: The UK wrote to New Zealand at the start of this month formally requesting permission to apply for membership of the Comprehensive and Progressive Trans-Pacific Partnership. What is the CPTPP and what opportunities would joining provide to the UK?

The #icaewchartoftheweek is on the UK’s application to join the Comprehensive and Progressive Trans-Pacific Partnership (CPTPP), a group of eleven countries on the other side of the world. This trade organisation was established to improve trade links between countries surrounding the Pacific, reducing trade barriers between the countries involved and aligning regulations in areas such as intellectual property. 

It is sometimes described as the third largest free-trade area in the world, after the US-Mexico-Canada Free Trade Agreement (USMCA, formerly NAFTA) and the EU-EEA-Switzerland Common Market, but it is important to understand that it is much less integrated than a customs union (with shared tariffs), a common market (with fuller regulatory alignment) or an economic union (such as the highly integrated EU Single Market with unified standards and regulations). 

According to IMF forecasts for 2021, Japan is the largest economy in the CPTPP with GDP of £3,815bn, while Brunei is the smallest with GDP of £9bn. The other members are Canada (£1,335bn), Australia (£1,125bn), Mexico (£890bn), Malaysia (£280bn), Vietnam (£275bn), Singapore (£270bn), Chile (£220bn), New Zealand (£165bn) and Peru (£150bn). This compares with a forecast of £2,180bn for UK GDP in 2021.

Membership is not exclusive, with CPTPP members involved in a number of other multilateral free trade agreements. Canada and Mexico are also members of USMCA. Malaysia, Singapore, Vietnam and Brunei are members of the 10-nation Association of South East Asian Nations (ASEAN), which in turn has free trade agreements with Japan, Australia and New Zealand, China, India and South Korea. Mexico, Peru and Chile are members of the four-nation Pacific Alliance with Columbia. In addition, China is leading the formation of the Regional Comprehensive Economic Partnership which includes all of the non-Americas members of the CPTPP in addition to China, South Korea and the other members of ASEAN.

The CPTPP replaced the original proposal for a Trans-Pacific Partnership (TPP) that would have included the US, but the remaining nations decided that it was still worthwhile pursuing a revised trade arrangement even after the US withdrew its application four years ago. A new administration could see the USA change its mind and seek to join the CPTPP after all.

Why does the UK want to join a trade pact on the other side of the world? The immediate trade benefits are likely to be relatively modest given the distances involved and which are likely to be secured through bilateral trade agreements already under discussion.

One reason is likely to be geo-political, as membership would strengthen relationships with allies in the Pacific, advancing the UK Government’s ‘global Britain’ agenda. There may also be an advantage in being directly involved in the development of international trade policy in the Pacific region which contains the two largest individual economies in the world (the US and China), potentially influencing trade policy across the planet.

Of course, part of the motivation might be less about trade in the Pacific and more about trade across the Atlantic. After all, if the US were to join the CPTPP, the UK’s membership might provide a base from which to eventually develop a more comprehensive bilateral free trade agreement. This could fulfil a key strategic objective of improving trade ties with the USA by going around the world, albeit in a lot more than 80 days!

This chart was originally published by ICAEW.

ICAEW chart of the week: Japan Budget 2021-22

5 February 2021: This week’s chart focuses on the Japanese economy as it seeks to return to relative fiscal normality in the year commencing 1 April 2021, following multiple supplementary budgets in its current financial year.

The #icaewchartoftheweek is full of anticipation for the UK Budget next month and so decided to take a look at how the Japanese central government plans to borrow ¥28.9tn (£205bn) in the year to 31 March 2022. Together with taxes and other income of ¥63.0tn (£450bn), this will be used to fund ¥86.9tn (£620bn) of spending and a ¥5.0tn (£35bn) COVID-19 contingency.

This follows a significant amount of borrowing in the current financial year, with the 2020-21 Budget amended by three supplementary Budgets in response to the coronavirus pandemic. If temporary and special measures are excluded, the 2021-22 Budget reflects a 0.7% increase in spending over the previous year’s ¥86.3tn (£615bn) pre-COVID budget.

Spending comprises ¥35.8tn (£255bn) on social security, central government spending of ¥26.1tn (£185bn), and other spending of ¥16.5tn (£120bn), with the latter principally relating to transfers and grants to local government. Interest of ¥8.5tn (£60bn) is only marginally higher than the previous year’s ¥8.3tn, despite a 9% increase in the level of government bonds outstanding to ¥990tn (£7tn) – equivalent to 177% of GDP – at March 2022.

Borrowing has increased over pre-pandemic levels, with net borrowing of ¥28.9tn (£205bn) in 2021-22 compared with the 2020-21 pre-pandemic budget of ¥18.0tn (£130bn, not shown in the chart). This is principally driven by a 10% decline in anticipated income, with taxes and other income of ¥63.0tn (£450bn) falling from the ¥70.1tn (£500bn) originally budgeted for the current year (but not actually received).

The chart does not include the substantial amounts of taxation raised and spent by its 47 regional prefectures and so does not provide a complete fiscal picture for Japan. However, it does provide an indication of how the Japanese public finances have been able to respond to the pandemic.

The Japanese government will be hoping that there will be no need for supplementary Budgets in the coming financial year, as no doubt will UK Chancellor Rishi Sunak as he prepares for his government’s Budget on 3 March.

This chart was originally published by ICAEW.

ICAEW chart of the week: IMF world economic outlook update

29 January 2021: The UK economy is expected to shrink over the three years from 2020 to 2022, compared with flat growth in the Eurozone, modest growth by the USA and relatively strong growth by China.

The IMF released updated economic forecasts this week, estimating the world economy shrank by 3.5% in 2020 with output projected to increase by 5.5% in 2021 and 4.2% in 2022. World output over the three years is now expected to see an average annualised growth rate of 2.0%.

The UK’s economy has been one of the hardest hit by the coronavirus pandemic, shrinking by an estimated 10.0% in 2020. Growth prospects are weak, with forecasts of 4.5% and 5.0% in 2021 and 2022 respectively bringing the annualised average growth rate over three years to a negative 0.4%. This contrasts with the 1.4% average growth forecast last year in the Spring Budget 2020, meaning that the UK economy is now projected to be around 4.7% smaller in 2022 than pre-pandemic expectations.

Prospects for the Eurozone countries are also disappointing, with forecast growth in 2021 and 2022 expected to bring their economies back to where they started and substantially below where they might have expected to have been without COVID-19. 

The USA economy appears to be more resilient, with growth in 2021 expected to offset the decline experienced in 2020 by a modest amount, bringing annualised growth over the three years to 1.3%.

In contrast, China expects to see annualised growth of 5.3% as it recovers from much slower than normal growth in 2020 as a consequence of the pandemic. While this is relatively strong compared with most other countries, China itself will consider this to be a relatively modest level of growth compared to the recent past. 

IMF World Economic Outlook Update – summary and selected countries

  2020 2021 2022 Average
 World output (1) -3.5% +5.5% +4.2% +2.0%
 World growth at market exchange rates -3.8% +5.1% +3.8% +1.6%
 Emerging and developing economies -2.4% +6.3% +5.0% +2.9%
 Advanced economies -4.9% +4.3% +3.1% +0.8%
 Eurozone -7.2% +4.2% +3.6% +0.0%
 Argentina -10.4% +4.5% +2.7% -1,3%
 Australia -2.9% +3.5% +2.9% +1.1%
 Brazil -4.5% +3.6% +2.6% +0.5%
 Canada -5.5% +3.6% +4.1% +0.6%
 China +2.3% +8.1% +5.6% +5.3%
 Egypt (2) +3.6% +2.8% +5.5% +4.0%
 France -9.0% +5.5% +4.1% +0.0%
 Germany -5.4% +3.5% +3.1% +0.3%
 India (2) -8.0% +11.5% +6.8% +3.1%
 Indonesia -1.9% +4.8% +6.0% +2.9%
 Iran (2) -1.5% +3.0% +2.0% +1.1%
 Italy -9.2% +3.0% +3.6% -1.1%
 Japan -5.1% +3.1% +2.4% +0.1%
 Kazakhstan -2.7% +3.3% +3.6% +1.4%
 Korea -1.1% +3.1% +2.9% +1.6%
 Malaysia -5.8% +7.0% +6.0% +2.2%
 Mexico -8.5% +4.3% +2.5% -0.7%
 Netherlands -4.1% +3.0% +2.9% +0.5%
 Nigeria -3.2% +1.5% +2.5% +0.3%
 Pakistan (2) -0.4% +1.5% +4.0% +1.7%
 Philippines -9.6% +6.6% +6.5% +0.9%
 Poland -3.4% +2.7% +5.1% +1.4%
 Russia -3.6% +3.0% +3.9% +1.0%
 Saudi Arabia -3.9% +2.6% +4.0% +0.8%
 South Africa -7.5% +2.8% +1.4% -1.2%
 Spain -11.1% +5.9% +4.7% -0.5%
 Thailand -6.6% +2.7% +4.6% +0.1%
 Turkey +1.2% +6.0% +3.5% +3.5%
 UK -10.0% +4.5% +5.0% -0.4%
 USA -3.4% +5.1% +2.5% +1.3%

For more information, read the IMF World Economic Outlook Update.

This chart was originally published by ICAEW.

ICAEW chart of the week: BBC finances

22 January 2020: The BBC’s finances are in the spotlight for this week’s chart, as it struggles to generate the income it needs to fund its public service broadcasting mission.

National Audit Office report out this week on the BBC’s strategic financial management highlights the financial pressures facing the BBC as it seeks to deliver on its universal public service broadcasting obligation in the face of a rapidly changing media landscape.

The #icaewchartoftheweek illustrates how the BBC generated revenue of £4.9bn in the year ended 31 March 2020. This is less than the £9bn or so generated by Sky in the UK & Ireland each year, but more than ITV’s £3bn or Channel 4’s £1bn. 

The principal source of income is the TV licence fee, which generated £3.2bn in 2019-20 from 21.2m households. This excludes 4.5m households that received free licences, with the government providing £253m to cover this in addition to an £87m grant for the World Service. Other income generated by the public service broadcasting arm amounted to £0.2bn, while BBC Studios and other commercial activities had external revenues of £1.2bn.

Expenditure of £5.0bn included £4.0bn incurred on public service broadcasting, paying for eight TV channels and 60 radio stations in the UK, radio services around the world in more than 40 languages and extensive online services – most notably BBC iPlayer. 

The BBC’s domestic TV and radio channels cost £1,609m and £494m respectively, while £238m was spent on BBC Online and £315m on the BBC World Service, of which £228m was funded from the licence fee. £204m was incurred on other services (including a contribution to S4C), while distribution, support and other costs incurred amounted to £1,070m, excluding £119m of licence fee collection costs.

A colour TV licence in 2019-20 cost £154.50, equivalent to £12.88 per month and the BBC estimates that £6.83, £2.22, £1.24 and £1.24 of each licence fee went on TV, radio, BBC Online and the World Service respectively, while £1.35 paid for other services, distribution and support, licence fee collection and other costs.

Commercial activities contributed £176m to the bottom line, providing a small subsidy to licence fee payers, with attempts by the BBC to start a global subscription service for British TV content in partnership with ITV (Britbox) yet to bear much fruit. The principal commercial revenue stream remains sales by BBC Studios to broadcasters around the world, together with advertising from the seven UKTV channels now wholly owned by BBC Studios and declining amounts from DVD sales. 

At the bottom line, the BBC incurred a loss of £119m in 2019-20, following on from a loss of £69m in the previous year and a profit of £180m in 2017-18. An improved contribution from commercial activities was not enough to offset the cut in the government funding for free TV licences for over-75s, which fell from £656m in 2017-18 to £253m in 2019-20. This funding has now ceased and from 1 August 2020 the BBC reintroduced licence fees for around three million over-75s households, retaining free licences for 1.5m or so over-75s households receiving pension credit (a welfare benefit for pensioners on low incomes).

There is a lot of debate both inside and outside the BBC about the future of the licence fee model and whether it can survive in a landscape of global streaming services. As it approaches its 100th anniversary in October 2022, the BBC will be hoping it can find a way to extend its public service broadcasting mission for a second century.

This chart was originally published by ICAEW.