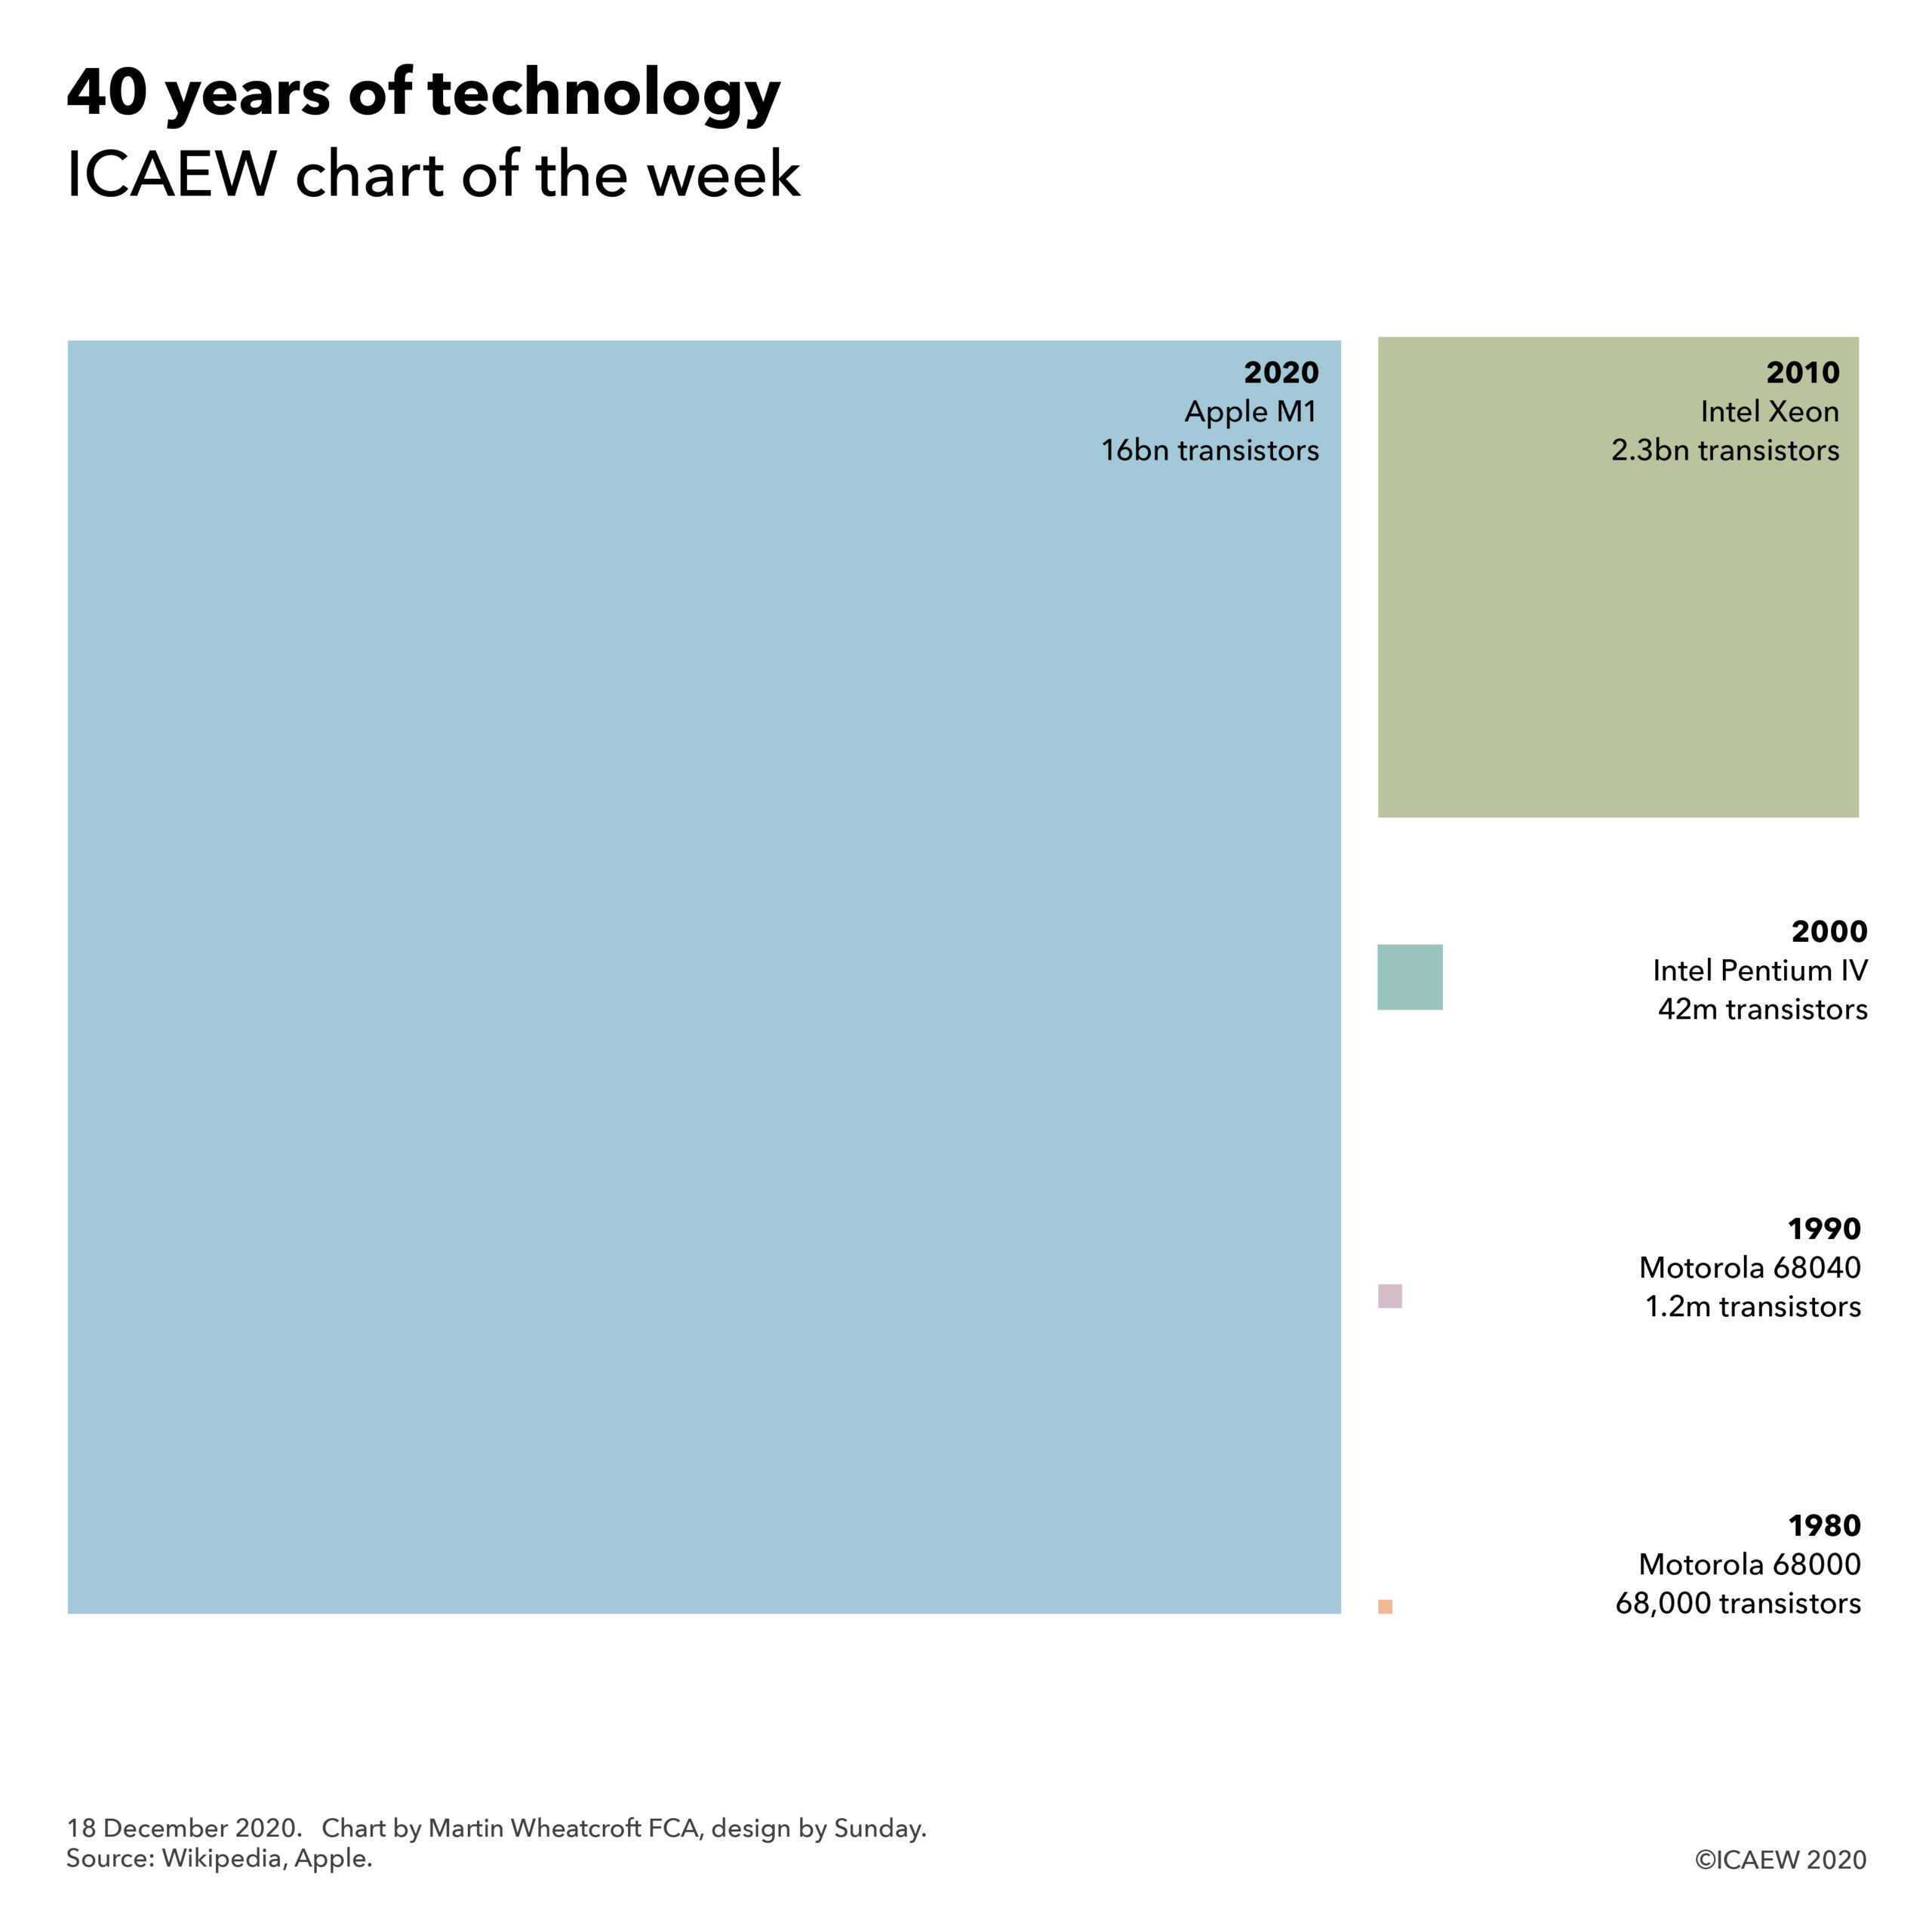
ICAEW chart of the week: A rush of capital spending in March

Our #ICAEWchartoftheweek this time is on the subject of public sector net investment. This is the government’s preferred measure of capital spending, including much needed investment in the UK’s economic and social infrastructure.

Over the years, the process for delivering capital expenditure in the public sector in the UK has had a pretty bad reputation. 

The anecdote goes that the first quarter is spent arguing about budgets, in the second everyone goes on holiday, and it is only in the third quarter that programmes finally get up and running, before everything stops for the Christmas break. The final quarter is then a mad rush to spend the remaining budget before the end of the financial year.

Unfortunately, there does appear to be some support for this conjecture when we take a look at the actual numbers.

According to the provisional financial results for the year released last week, around 41% of public sector net investment in 2018-19 was incurred in the last quarter. £8.2bn or 19% was reported in the last month alone!

Brexit has been an added complication in this particular financial year, with the government’s no-deal preparations in the run up to the end of March involving additional capital spending. Despite this, March was the peak month last year, as it has been over the years.

This is a stubbornly consistent feature of the public finances in the UK, even after numerous attempts within government to improve capital budgeting and delivery processes. For example, departments are now able to carry over some of their capital budgets to future years, which in theory should reduce the incentive to spend every last penny of their allocation in-year. In practice, a great deal of activity seems to take place in March, while April and May appear to be much quieter.

Of course, it is possible that our concerns about the quality of government’s investment delivery process are not fully justified. There could after all be some very good reasons as to why the winter months are the best time for carrying out public capital works!

ICAEW chart of the week: UK Government financial asset sales

The #ICAEWchartoftheweek is on the UK Government’s programme of financial asset sales, an important source of finance for the exchequer. These are expected to generate £16.4bn in 2019-20 and a further £25.5bn over the next four years as the government divests itself of assets acquired during the financial crisis in particular.

The £16bn to be raised in 2019-20 forms part of the overall £145bn funding that is needed to pay for a forecast £29bn shortfall in tax revenues, £99bn in debt repayments, and £17bn in net lending, including student and business loans.

Some £9.6bn of the proceeds in the current financial year are expected to be raised from the sale of the final tranche of Northern Rock and Bradford & Bingley mortgage and loan receivables. This should enable the government to finally close down the UK Asset Resolution ‘bad bank’ that was established during the financial crisis a decade ago.

Another legacy of the financial crisis is the government’s holding in Royal Bank of Scotland plc (RBS), rescued by the taxpayer at significant cost. £3.6bn is expected to be realised from the sale of shares this year, with a further £16.6bn expected to be recovered in future years as the remaining holding is divested. The exact amount to be raised will of course depend on the RBS share price at the time. Remember share prices can go down as well as up!

More controversial are plans to sell portions of the student loan portfolio. There are significant questions as to whether this makes financial sense given the significant losses that were recorded on the disposals made in 2018-19, and the losses expected to be recorded on future disposals.

Disposals of financial assets do not affect the fiscal deficit, but they do have the effect of reducing headline public sector net debt – helpful to the government’s objective of reducing debt as a share of GDP. Of course, whether this is right metric to be focusing on is a matter of debate.

There does seem to be a good logic for disposing of assets acquired as a by-product of bailing out the banking system at the height of the financial crisis that are not held for any strategic or policy purpose. However, the sale of student loans at a loss in order to improve a key performance indicator may not be the best financial decision ever made by the government.

ICAEW chart of the week: UK population over the next 25 years

Our #ICAEWchartoftheweek this time is on demographics, illustrating how the population is projected to increase by 10% over the next 25 years, from just short of 67m in June this year to 73½m in 2044.

The ONS have assumed that there will be 770,000 births and 672,000 deaths a year on average over the next quarter of a century, together with annual net inward migration of 168,000. This is an annual increase of 0.4% a year, lower than the 0.6% a year seen over the last twenty-five years, as a consequence of expectations for lower inward migration in the coming years.

What stands out in the chart is the number of people aged 75 or over, which is expected to go up from 5.7m in 2019 to 10.4m in 2044, an increase of 82%!

This is a dramatic change, and is of course good news. But, it will have significant implications for the public finances as increasing sums will be needed to fund state pensions, health, and social care. This will also put pressure on other public services, even if costs can be kept under control on a per person basis.

Unfortunately, there is no money set aside for these costs.

Unlike a number of other countries, social security payments collected from those of working age in the UK are not retained and invested, but are instead disbursed immediately, supporting earlier generations of workers under the ‘pay as you go’ fiscal strategy adopted by successive UK governments. Nor are there any funds available to cover the health or social care costs of those in retirement – when costs are much higher than those of working age.

This means that more and more money will need to be raised in taxes – or – alternatively, state provision for pensions, health and social care for millions of people will need to be dramatically scaled back from that provided today. The latter has already happened to a minor extent with a higher state retirement age, while the state pension triple-lock guarantee of annual increases is looking increasingly vulnerable.

Another option is for higher levels of immigration. This would increase the number of working age people paying into the system, reducing the scale of tax rises and/or cuts in provision that might otherwise be needed. However, this might prove difficult to achieve politically, even if the government wanted to encourage more people to come to the UK.

Unfortunately, there continues to be a lack of a proper debate about the UK’s fiscal strategy. In particular, is it sustainable to continue with the ‘pay as you go’ approach or should we move to a funded approach for some of the state’s financial obligations to its older citizens? While such a change would take time, and so would not be able to relieve some of the immediate pressures on the public finances, building up investment funds over the next quarter of a century might be a way of getting the UK onto a more sustainable path.

In the meantime, I am just keeping my fingers crossed and hoping that ‘my’ free (state-funded) bus pass will still be waiting for me when I eventually retire…

ICAEW chart of the week: Australia fiscal surplus

Commonwealth of Australia fiscal balance

The Commonwealth of Australia presented its budget for 2019-20 last week. Buoyed by higher tax revenues from natural resources, Treasurer Josh Frydenberg MP announced that Australia’s federal finances had returned to surplus, enabling a modest pre-election tax giveaway.

As illustrated by our ICAEW chart of the week, the latest forecast for the current financial year ending this June is for the federal element of general government revenues to exceed expenses and net investment by A$2bn, with a surplus of A$8bn planned for 2019-20 and further surpluses in the coming years. On a cash basis the turnaround is a year later, with a reduction in underlying cash balances of A$4bn in 2018-19 expected to be followed by an increase of A$7bn in 2019-20.

This is a welcome return to positive territory after a decade of red ink after the global financial crisis. 

Revenue is expected to total A$514bn or 25.6% of GDP in 2019-20, with expenses A$501bn (25.0% of GDP) and net capital investment of A$5bn (0.2% of GDP). The financial projections assume that expenses can be kept under control, with a plan to cut spending in some areas in real-terms to offset expected increases in the costs of education and social security and welfare. The ratio of revenue to GDP is expected to increase to 26.0% in 2021-22, before falling back again to 25.6% in 2022-23, while expenses as a share of GDP are expected to fall to 24.6% in 2022-23. Net capital investment is expected to increase to 0.5% of GDP over the same period.

On a per capita basis, revenue in 2019-20 is expected to be in the order of A$1,670 per month, with expenses of A$1,630 per month and net investment of A$15 per month to arrive at a fiscal surplus in the region of A$25 per month.

Surpluses in the years to come should help the Australian government improve its financial position, with net financial liabilities projected to reduce from A$491bn (25% of GDP) at 30 June 2019 to A$447bn (20% of GDP) at 30 June 2023. Net debt is expected to fall from A$374bn (19% of GDP) in 2019 to A$326bn (14% of GDP) in 2023, with a view to being eliminated by 2030.

The surplus for 2019-20 benefits from A$5bn in investment returns from the A$146bn Future Fund, which was established in 2006 to address the Australian government’s unfunded superannuation liabilities. These liabilities, forecast to add up to A$224bn at 30 June 2019, continue to grow, albeit more much slowly since the closure of defined benefit arrangements to new civilian and military employees from 2005 and 2016 respectively. Up until now earnings from the Future Fund have been reinvested, but from 2020-21 they will support pension payments, reducing the cash required from the Australian exchequer. The government has also established the DisabilityCare Australia Fund with assets of A$14bn, the Medical Research Future Fund (A$9bn) and the Aboriginal and Torres Strait Islander Land and Sea Future Fund (A$2bn) to support specific objectives, while there are plans to establish new funds this year for droughts and emergency response with initial investments of A$4bn in each case.

Australia has managed its balance sheet through a combination of expenditure control, financial investment and risk reduction. This contrasts with many other developed nations, which continue to struggle with proportionately much larger amounts of debt and public sector pension obligations. For example, public sector net debt in the UK is around 83% of GDP, while net financial liabilities (including public sector pensions) are in the order of 180%.

Might a similar approach help us to get our public finances here in the UK under control?

At 31 March 2019, £1 was equal to A$1.84. 

Amounts exclude public sector corporations (including the Reserve Bank of Australia) and locally-funded expenditure by Australian states and local government.

For more information go to budget.gov.au.

ICAEW chart of the week: Housing sales

The ICAEW chart of the week this week is on the topic of the residential housing market, one of the swathe of economic statistics published by the Office for National Statistics last week. 

While there is often great interest in what is happening to house prices, data on the number of transactions tends to get less publicity – despite perhaps being more important to the economy. After all, people moving home often generate a great deal of additional economic activity, such as redecorating and buying new furniture.

There were 856,000 housing sales in the year ended 30 September 2018, down from 948,000 in 2016 and 36% lower than the pre-crisis peak of 1,340,000 in 2007.

Much of the decline in the volume of transactions has been put down to the weak economic recovery, with low real family incomes making it difficult for many to buy, despite extremely low mortgage rates. Another culprit may be stamp duty, a friction in the housing market as it significantly increases the cost of moving home.

The total value of the transactions in 2018 was £253bn, meaning that the average price paid for house in England & Wales was £296,000.

The statisticians prefer to focus on the median value, which was £232,000 in 2018. The ONS uses this to calculate affordability, with the ratio to gross annual earnings at 7.83 in 2018, up from the 7.77 seen in 2017. Surprisingly this is higher than the 7.17 calculated for the peak in 2007, which in turn was significantly higher than the ratio of 4.13 back in 2000.

With politicians of all parties keen to increase housing supply, the hope is that more people will be able to get on the housing ladder and the volume of transactions will start to increase again. Whether that will actually happen remains to be seen.

ICAEW chart of the week: Ireland external trade

The ICAEW chart of the week returns to the topic of external trade; a topic of continuing interest in the UK as Parliament attempts yet again to resolve its differences over the proposed Withdrawal Agreement with the EU and the so-called ‘Irish backstop’ in particular.

Last week’s release by the Northern Ireland Statistics and Research Agency (NISRA) of its Broad Economy Sales and Exports Statistics for 2017 were particularly noteworthy (if not particularly timely). They put external sales of goods and services by Northern Irish businesses at £21.4bn, comprising sales to Great Britain (i.e. England, Wales and Scotland) of £11.3bn and exports to other countries of £10.1bn, including £3.9bn going to the Republic of Ireland.

We have compared these with international trade data from An Phríomh-Oifig Staidrimh, the Irish Central Statistical Office (CSO). They reported exports of €282bn in 2017, in the order of £250bn when converted into sterling. This included somewhere in the region of £3bn going to Northern Ireland (we couldn’t find a specific number for services exports in 2017, so this includes an inference from other data).

These numbers highlight the very different natures of the economies between the two parts of the island of Ireland, with the Republic exporting close to 12 times as much the North, even though only having 2.5 times as many people (4.8m in the Republic versus 1.9m in Northern Ireland). They also illustrate how trade with the North is of much less significance economically to the Republic (at around 1% of its exports), in contrast with Northern Ireland, where around 38% of its international exports (18% of external sales) are to the Republic.

Of course, high level economic statistics cannot provide the whole picture of economic relationships. For example, many of the Republic’s exports to the EU and elsewhere are transported via the UK, while the significance and importance of cross-border trade to the communities near to that border is likely to be much greater than for other parts of the island.

Ultimately, trade is only one element in the political, economic and constitutional relationships across the British and Irish Isles, and with their European neighbours. We may discover more about what is going to happen to those relationships in the next few days. Then again, we may not.

ICAEW chart of the week: UK Government financing for 2019-20

One of the primary purposes of the Spring Statement last week was to establish the Government’s financing for the coming financial year. As our ICAEW chart of the week illustrates, the plan is to raise £145bn from investors during 2019-20.

The largest element of this will come from the sale of government securities to professional and institutional investors, with the Debt Management Office (DMO) given a remit to issue £118bn in new gilts and treasury bills. Its current plan is to issue £85bn in conventional (fixed-interest) gilts, £22bn in index-linked gilts and £4bn by increasing short-term treasury bills outstanding, leaving £7bn yet to be determined.

This should be complemented by £11bn in fundraising by National Savings & Investments, the state-owned savings bank that offers premium bonds and savings products direct to the public.

A further £16bn is expected to be raised from the sale of financial assets. This includes £10bn from the final tranche of Northern Rock and Bradford & Bingley mortgages and other securities acquired during the financial crisis, £3.6bn from sales of RBS shares, and £2.7bn from selling a portion of the student loan portfolio.

The total of £145bn raised from investors will be used to plug the £29bn shortfall between planned spending and taxes and other income (£840bn versus £811bn) as well as funding net lending of £17bn. The latter includes £19bn to be lent to students, £4bn in Help to Buy loans and £5bn in other loans, offset by repayments of £5bn and cash flow timing effects of £6bn. 

This leaves a balance of £99bn that will be used to repay debts as they fall due during the course of the year, many of which were taken out during the financial crisis a decade ago.

In normal circumstances the work of the DMO and National Savings in funding the government goes on behind with the scenes, without any drama – even with the current significant economic and political uncertainties currently facing the UK.

For the unsung heroes at the DMO and National Savings this means continuing to labour in obscurity – just how they like it.

ICAEW chart of the week: OBR forecast revisions UPDATED FOR SPRING STATEMENT

Following the Spring Statement earlier today, we have updated our ICAEW chart of the week to reflect the changes in the official forecasts made by the Office for Budget Responsibility.

Rumours that the Chancellor would benefit from a ‘windfall’ in the form of higher than expected tax revenues turned out to be true, but only to a very modest extent. Overall, there was an average revenue uplift of £3.5bn per year over the forecast period, before taking into account some small tax increases of £0.8bn per year (most of which is for probate fees and the immigration health surcharge).

We were therefore quite right not to get carried away, as our updated ICAEW chart of the week is hardly changed from the previous version (see below).

The forecast for taxes and other income for 2019-20, the financial year about to start, has been increased by £1.6bn from the previous forecast presented with the Autumn Budget 2018. This comprises a revision to the revenue forecasts by the OBR of £1.0bn and a further £0.6bn from the consequence of government decisions (principally tax increases). 

As a consequence, the new forecast for current receipts of £811.4bn for 2019-20 is still £5.9bn below the position that Philip Hammond inherited.

Of course, the big concern overshadowing the Spring Statement was Brexit, with the Chancellor caveating pretty much everything he said, in particular on his proposed plans for future spending. 

This small upward revision (0.1%) in projected revenues was no doubt better for the Chancellor than a downward revision, but it won’t have done much to improve his mood after all.

See below for the original blog post:

The Spring Statement is this Wednesday, and there have been rumours that the Chancellor may benefit from a ‘windfall’ in the form of higher than expected tax revenues.

However, before getting carried away in giddy excitement by this prospect, we thought it might be worthwhile for our ICAEW chart of the week to look at what has happened to the Office for Budget Responsibility’s financial projections since Philip Hammond became Chancellor.

These projections cover multiple years, but for this purpose we have chosen to look at the forecast for taxes and other income for coming financial year. Back in 2016, the Chancellor inherited a forecast of £820.9bn for government revenue in 2019-20, although there have been some accounting and classification changes since then that means this is equivalent to a baseline forecast of £816.7bn (after also taking into account some modest net tax increases). 

As the latest forecast from the Autumn Budget last year is for current receipts to be £809.8bn in 2019-20, there is still a £6.9bn shortfall compared with the position that Philip Hammond inherited.

Of course, the Chancellor and the OBR had very good reasons to be cautious in 2016. The UK had just voted to leave the European Union and it was unclear as to what this might mean for the economy (plus ça change), while productivity growth remained stubbornly weak. A small upward revision in  March 2017 was followed by another downward revision in the November 2017 forecast, driven by even more pessimistic views on productivity.

These forecast downgrades in 2016 and 2017 have underpinned a generally gloomy Hammond Chancellorship, but he was marginally more cheerful in the last two fiscal events as upward revisions to the forecasts gave him some room to increase spending without adding further to borrowing.

Will the OBR be able to put a smile on the Chancellor’s face on Wednesday with a further upward revision to projected revenues? We look forward to finding out.

ICAEW chart of the week: UK GDP over the last two decades

The ICAEW chart of the week this time is on the size of the UK economy over the last couple of decades.

According to the Office for Budget Responsibility, economic activity in the UK is forecast to add up to £2,126bn for the year ending 31 March 2019, an average increase of 3.1% a year over the £1,564bn reported a decade earlier.

Excluding inflation of 1.66% per annum, this means economic growth has averaged 1.44% over the last ten years since the financial crisis. This is significantly lower than economic growth in the decade before the the financial crisis of 2.32%, as well as the average of 2.45% seen in the 30 years up to 1998-99.

Some economists are suggesting that low rates of growth may be a ‘new normal’ and that we should not expect a return to previous levels. If so, there will be significant implications for how the government manages the public finances, with reduced future revenues available to fund growing public liabilities and financial commitments such as the state pension.

Another reason perhaps to re-evaluate the ‘pay-as-you-go’ assumption that underpins the government’s long-term strategy for the public finances? 

ICAEW chart of the week: A resurgence of Quangos?

Who else remembers the great bonfire of the Quangos? It doesn’t seem too long ago that the government was busy abolishing or privatising as many Quangos (quasi-autonomous governmental organisations) as they could track down. A determined effort to cut back the tangled weeds of bureaucracy that had grown up over decades of government expansion.

However, in recent years this particular garden appears to have gone untended and the weeds seem to be making a comeback!

This week’s ICAEW #chartoftheweek highlights how according to gov.uk there has been a 14% increase in the number of government bodies over the last four years, with the website listing 541 government departments, government agencies and other public bodies, high profile groups, and public corporations in January 2019.

Of course, counting up the number of organisations listed on the main government website is unlikely to give a full picture of what is going on. After all, public bodies can range in size from small advisory committees up to large agencies with multi-billion pound budgets, often containing a number of subsidiary organisations not included in the main list. However, despite that, it does look like that Quangos are making a resurgence, with a range of new bodies set up in the last few years.

As any gardener will tell you, it is important not to leave weeding for too long if you don’t want your garden to become overrun and unmanageable. Time to get the wellies on and head outdoors again?