Our chart this week takes a look at the effect of the Spring Budget 2024 on the public finances.
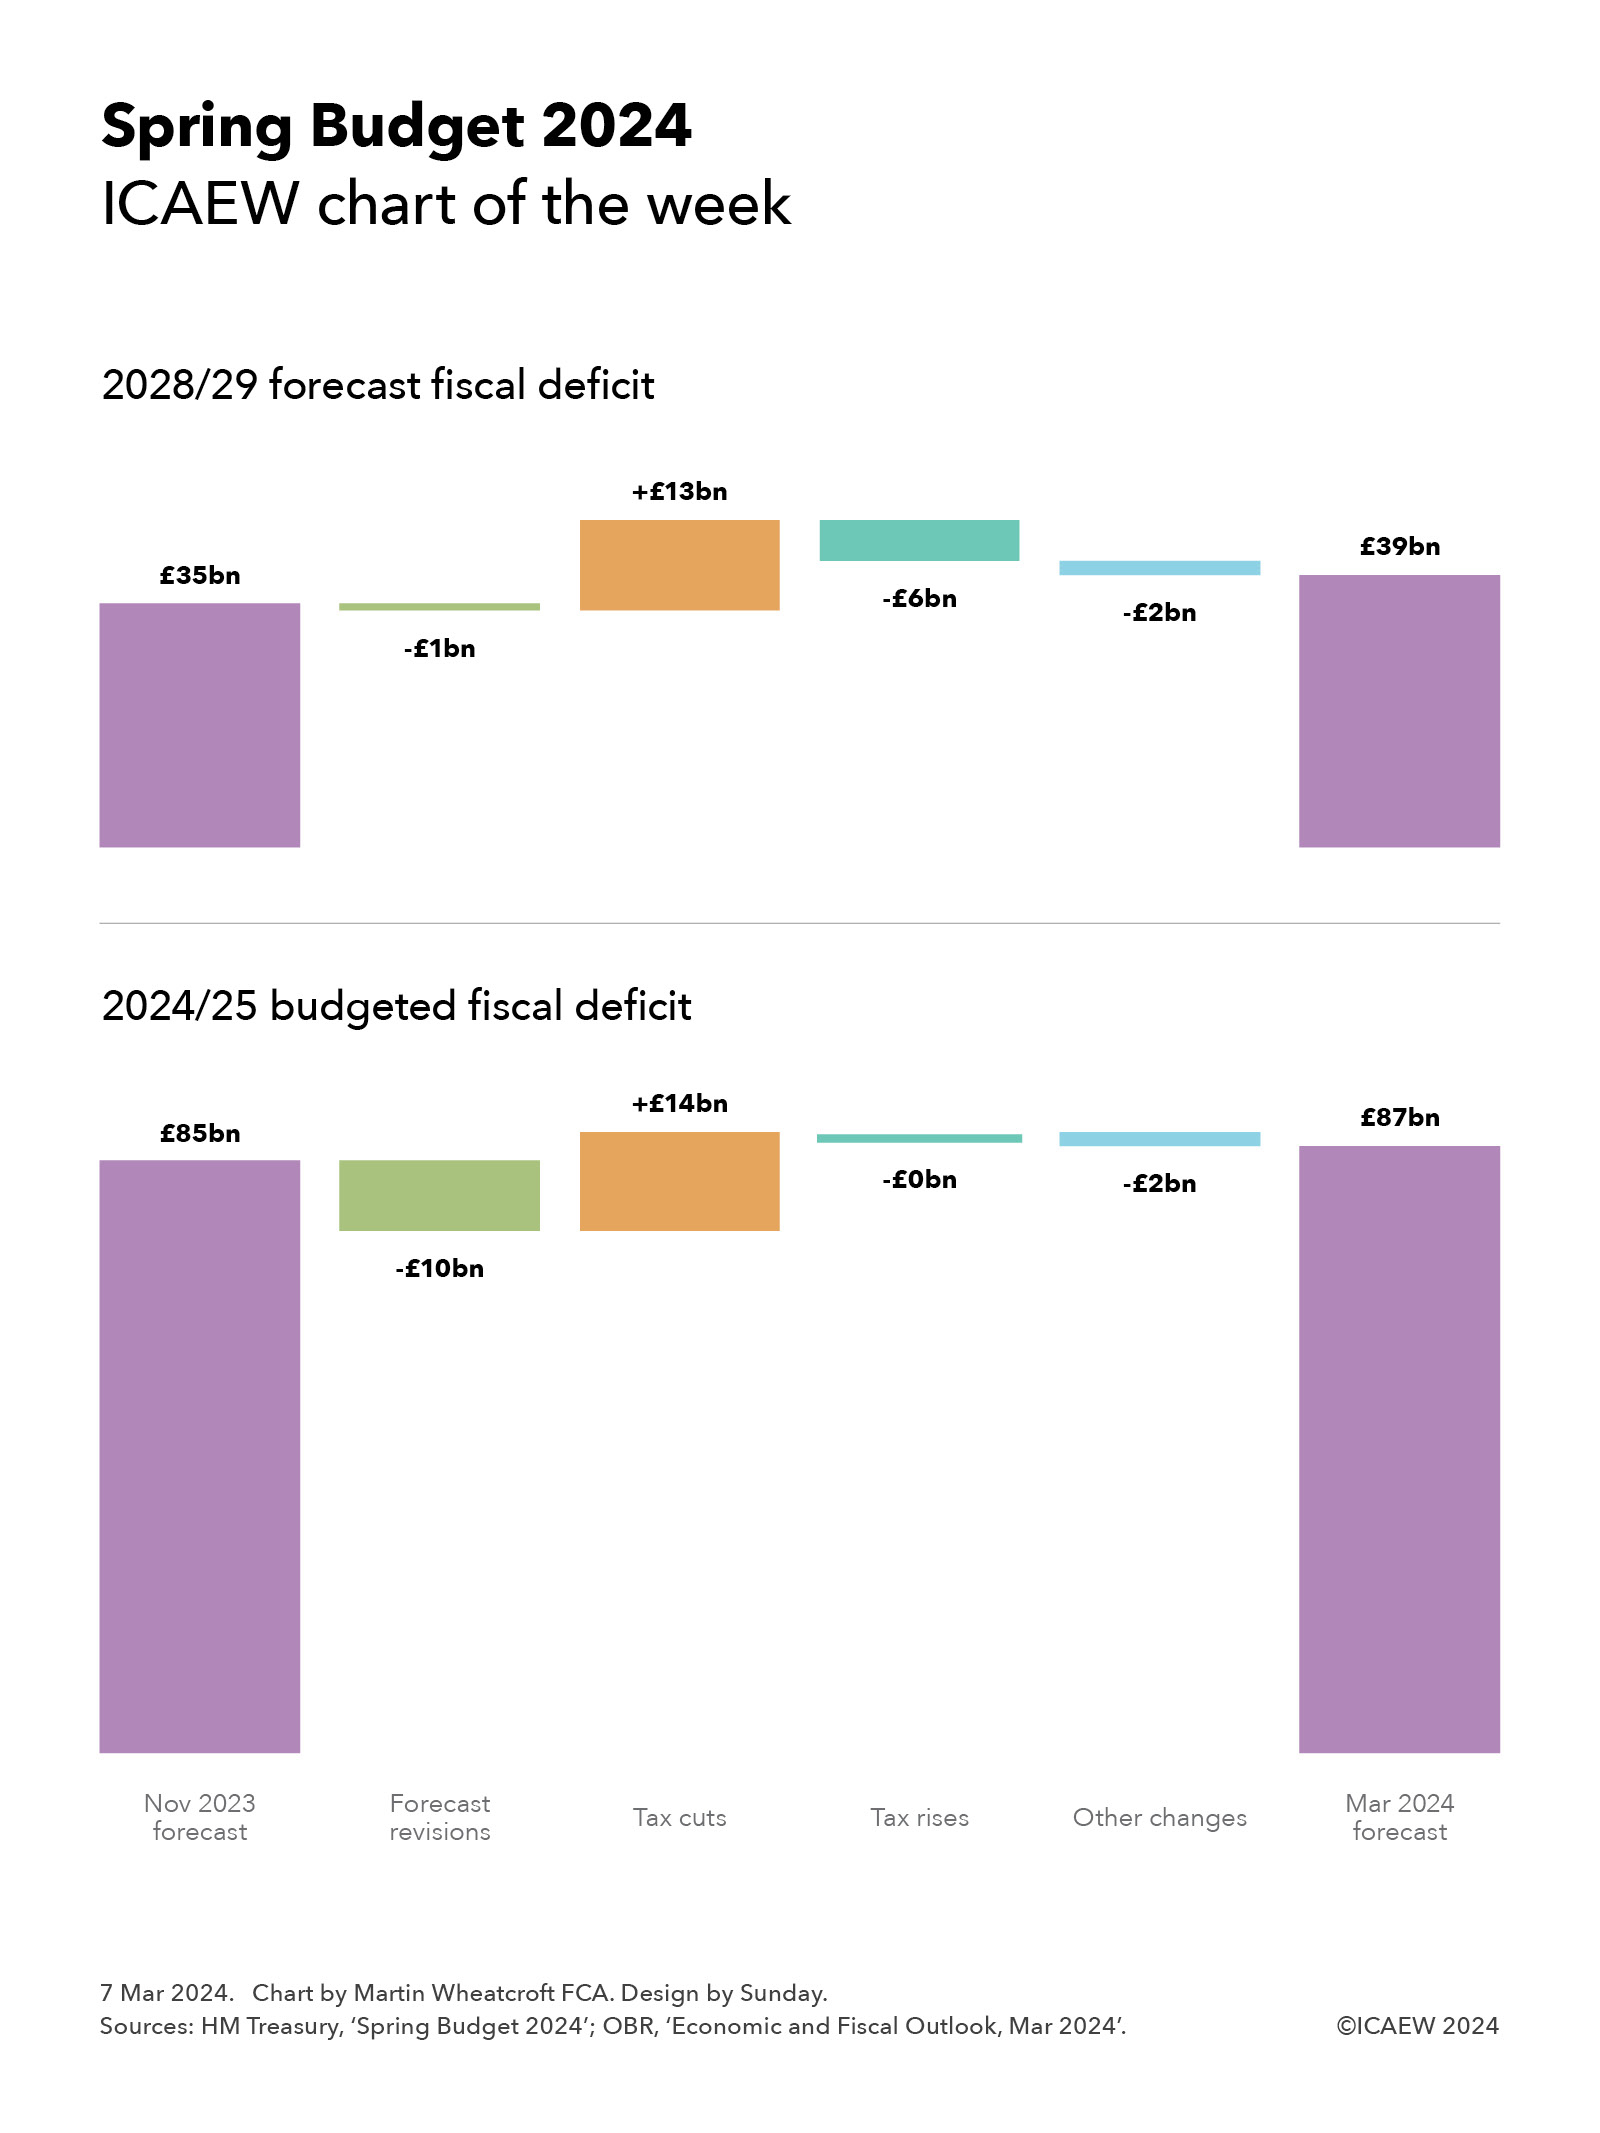
This week’s chart summarises the changes announced in the Spring Budget 2024, analysing the changes in the budgeted fiscal deficit for 2024/25 and the forecast fiscal deficit for 2028/29 since the forecasts that accompanied the Autumn Statement 2023 last November.
As the chart illustrates, the budgeted deficit for 2024/25 of £85bn anticipated in November has been revised up to £87bn, comprising forecast revisions reducing the deficit of £10bn, followed by tax cuts of £14bn increasing the deficit, offset by tax rises of close to zero and other changes of £2bn reducing the deficit.
The chart also shows the changes to the final year of the forecast period, with the forecast of deficit £35bn at the time of the Autumn Statement 2023 reduced by £1bn from forecast revisions, increased by £13bn to fund tax cuts, reduced by £6bn from tax rises and £2bn from other changes to reach a new forecast for the deficit in 2028/29 of £39bn.
The good news for the Chancellor was the improvement in the public finances in the earlier years of the forecast, with interest rate expectations coming down from last year. This resulted in an improvement in the forecasts of £16bn in 2024/25 and £14bn in 2028/29, offset by the effect of lower inflation expectations on tax and other receipts of £2bn and £13bn respectively to result in net forecast revisions of £10bn and £1bn respectively. The lower inflation assumption has a bigger impact over time as there is a compounding effect on tax and other receipts.
This allowed the Chancellor to announce a two-percentage point cut in national insurance pushing up the deficit by £10bn in 2024/25 and £11bn in 2028/29, together with freezes in fuel and alcohol duties, changes in the high-income child benefit charge, an increase in the VAT threshold from £85,000 to £90,000, and a four-percentage point cut in capital gains tax on property sales from 28% to 24%. The latter change is expected to increase tax receipts by a few hundred million pounds a year as it is expected to encourage more property sales, with higher volumes offsetting lower tax on each sale. Overall, these other tax cuts push up the deficit by £4bn in 2024/25 and £2bn in 2028/29.
The forecast revisions weren’t enough to allow the Chancellor to cover the cost of cutting taxes, and so he also announced some tax rises. These include the introduction of a duty on vaping and an increase in tobacco duty, an extension of the energy profits levy to March 2029, and changes in the tax treatment of ‘non-doms’. These have a relatively small effect in 2024/25 but build up to a reduction in the deficit around £6bn a year by 2028/29.
Other changes of £2bn in 2024/25 comprised £1bn in other policy measures and £1bn in indirect benefits to the economy from the Chancellor’s announcements in 2024/25, while the £2bn in 2028/29 reflected £1bn from improvements in tax collection, £1bn in other measures, and £2bn from indirect benefits to the economy, offset by £1bn from interest on increased borrowing, and £1bn to be invested in public sector productivity.
In summary, these are relatively tiny changes in the outlook for the public finance in the context of £1.2trn of public spending each year and public sector net debt that is still on track to exceed £3.0trn by the end of the forecast period in March 2029.
Even relatively small changes in economic assumptions, in spending plans, or in tax policies could have a significant impact on the fiscal forecasts, especially those for 2028/29.
For more information about the Spring Budget 2024 and ICAEW’s letters to the Chancellor and HM Treasury, click here.
While tax cuts will likely headline next week’s Spring Budget, debt markets will be questioning plans to reduce the deficit by constraining public spending.
Last week’s chart of the week looked at the pre-Budget forecast for debt and the very low level of headroom the Chancellor had against his primary fiscal rule of seeing debt falling by the final year of the forecast period.
Our chart this week is on the ‘P&L’ side of the equation, illustrating how the Chancellor’s plan at the time of the Autumn Statement 2023 was to bring down the deficit by constraining growth in public spending to less than the level of growth in tax and other receipts.
The starting point is the deficit of £85bn for the financial year ending March 2025 (2024/25) forecast by the Office for Budget Responsibility last November, with spending (excluding interest) expected to increase by less each year than receipts (net of interest): by £13bn and £21bn respectively in 2025/26, £10bn and £19bn in 2026/27, £5bn and £24bn in 2027/28, and £7bn and £21bn in 2089/29, to reach a projected deficit of £35bn in 2028/29.
If achieved, this would see the deficit reduce to the equivalent of 1.6% in 2027/28 and 1.1% of GDP in 2028/29, the first time the deficit would come in below 2% of GDP since 2002/03, a quarter of a century earlier.
Although the increases in taxes and other receipts may seem substantial, they are broadly in line with the projected growth in the size of the economy, with ‘fiscal drag’ from the freezing of several key tax allowances mitigating the effect of tax cuts announced last November. Meanwhile, planned spending increases are relatively small in the context of the overall public finances, equivalent to real terms rises in public spending excluding interest of 1.1%, 0.8%, 0.4% and 0.5% respectively.
This relatively low level of increase in spending may seem surprising in the context of demographic changes that are pushing up spending on pensions, health and social care, a deteriorating international security situation, the severe financial difficulties facing many local authorities, and the pressure many other public services are under, not to mention the need to increase investment in infrastructure if the economy is to return to growth.
The Institute for Fiscal Studies has questioned whether the Chancellor’s spending plans are realistically achievable, given that they imply significant cuts in the budgets of unprotected departments over the course of the forecast period. These are unlikely to be deliverable in practice.
A modest boost to public finances reported in the current financial year, together with moderating interest rate expectations, are expected to provide the Chancellor with capacity to cut taxes while still meeting his fiscal rules. But debt investors will be wondering how much an incoming government – irrespective of which party wins power – will actually be able to raise taxes to fully cover expected spending-plan revisions. Not raising taxes sufficiently in the first Budget after the election would likely lead to the next government needing to borrow even more at a time when the Bank of England is flooding debt markets with gilts as it unwinds quantitative easing.
For more information about the Spring Budget 2024 and ICAEW’s letters to the Chancellor and HM Treasury, click here.
My chart for ICAEW this week looks ahead to the Spring Budget and asks how much headroom the Chancellor will have available for tax cuts or higher spending while still meeting his fiscal targets.
The Chancellor is currently getting ready for his Spring Budget on Wednesday 6 March 2024, with rumours, leaks and misinformation swirling around ahead of what will be a keenly watched event – quite probably the last fiscal event before the general election.
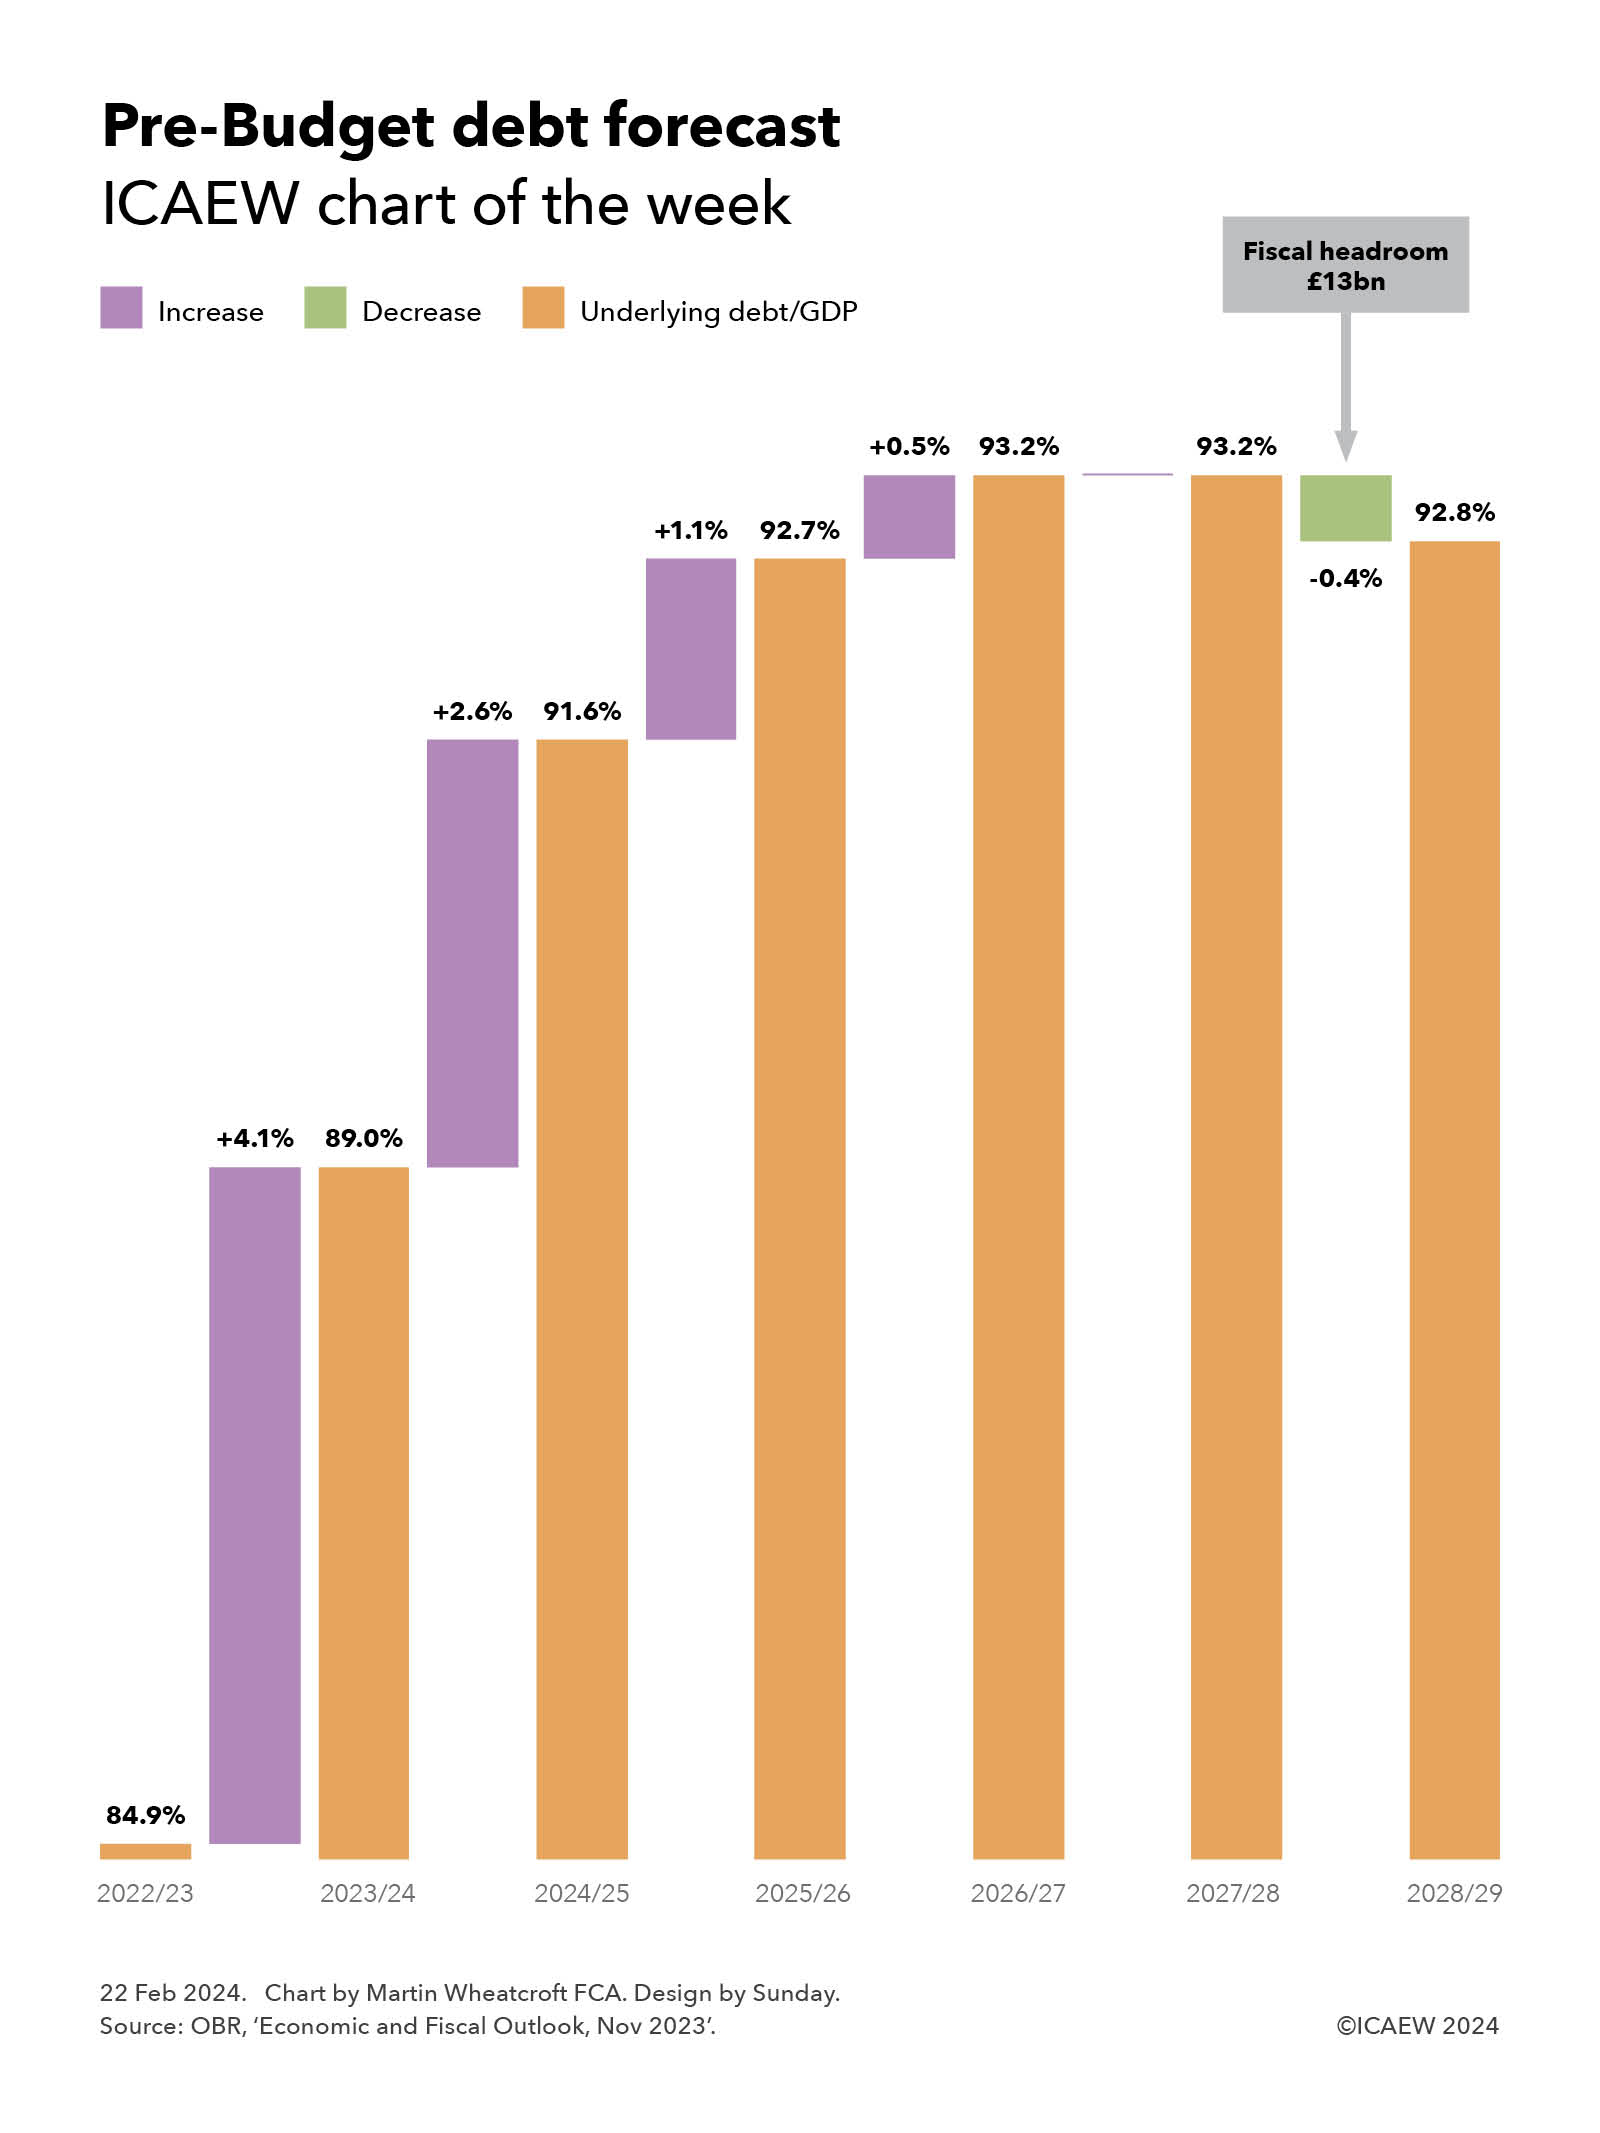
As our chart illustrates, the Office for Budget Responsibility (OBR) at the time of the Autumn Statement last November projected that the ratio of underlying debt to GDP would increase in the current financial year (2023/24) and further over the first four years of the forecast period, before starting to fall in the final year (2028/29).
Underlying debt is defined as public sector net debt (PSND) excluding Bank of England liabilities (PSNDexBoE). This alternative metric avoids distortion in the headline measure of debt caused by £170bn of Term Funding Scheme loan receivables not netted against related Bank of England liabilities that will reduce PSND as these loans are repaid, even though net financial assets and liabilities are not changing.
The projected increases are +4.1% from 84.9% at March 2023 to 89.0% at the end of 2023/24, +2.6% to 91.6% in 2024/25, +1.1% to 92.7% in 2025/26 and +0.5% to 93.2% in 2026/27, before staying flat in 2027/28 and then falling -0.4% to 92.8% in March 2029.
The fall in 2028/29 projected by the OBR in November provided the Chancellor with £13bn of fiscal headroom in the final year of the forecast. In theory this meant he could have planned to spend more, or cut taxes, by up to £13bn in 2028/29 and still met his primary fiscal target, which is for underlying debt/GDP to be declining in the final year of the fiscal forecast period.
Building such a relatively small amount of headroom into a forecast – less than four days of total government spending – is perhaps surprising given the high degree of uncertainty in predicting future receipts, spending and borrowing, not to mention GDP. These numbers can all move by tens of billions between forecasts, as the economic situation changes and policy and budgetary decisions are made.
GDP can be especially variable, with the Office for National Statistics making frequent revisions to its estimates, sometimes many years later. Several commentators also believe the numbers for planned public spending from April 2025 onwards are unrealistic and that there will be a need to revise these numbers upwards in subsequent fiscal events.
Although there has been a modest boost to the public finances in the reported numbers for the first 10 months of the current financial year, underlying debt/GDP at January 2023 was 88.1%, on track to end the financial year at close to the 89.0% in the November OBR forecast.
The news that the UK had entered recession in the last quarter of 2023 will not have been positive for the Chancellor in his search for additional headroom but, despite this, it is believed that the forecasts will improve sufficiently to allow him some capacity to either increase the total amounts allocated to public spending, or announce tax cuts, while still keeping with his fiscal targets. Of these options, tax cuts are considered much more likely.
Either way, underlying debt/GDP will be expected to be higher in five years’ time – potentially even higher than in previous forecasts. From a fiscal target perspective, what is important is whether the ratio is falling in the fifth year of the forecast period, not the overall change in the level between now and then.
For more information about the Spring Budget 2024 and ICAEW’s letters to the Chancellor and HM Treasury, click here.
Prior month revisions boost public finances despite worse than expected self assessment receipts, as a think tank says tax cuts in the Budget will be sandwiched between tax rises in the years before and after.
The monthly public sector finances for January 2024 reported a provisional surplus for the month of £17bn, slightly less than expected, while at the same time revising the year-to-date deficit down.
The figures, released by the Office for National Statistics (ONS) yesterday, show a cumulative deficit for the first 10 months of the financial year to £97bn, £3bn less than in the same period last year. The year-to-date variance against the Office for Budget Responsibility (OBR)’s Autumn Statement forecast improved from £5bn last month to £9bn this month.
Alison Ring OBE FCA, ICAEW Director for Public Sector and Taxation, said: “Lower self assessment tax receipts than expected in January were offset by revisions to numbers from previous months to improve the overall financial picture.
“This small improvement helps only a little with an extremely weak fiscal position facing the Chancellor as he approaches the Budget, with questions already being asked about whether existing plans to cut public spending in the near term are realistically achievable. Rumours that the Chancellor is thinking about further reductions in public spending to fund tax cuts will therefore need to be balanced with his ability to maintain credibility with debt markets.”
The Resolution Foundation reported that likely net tax cuts in the coming financial year of around £10bn are sandwiched between £20bn of tax rises that have already been implemented in the current financial year – including threshold freezes and the corporation tax rate rise from 19% to 25% – and £17bn in net tax rises that have been pre-announced up to 2027/28 (primarily from threshold freezes and stamp duty land tax).
The think tank’s pre-Budget analysis estimates that the cut in national insurance announced in November plus around £10bn in potential new tax cuts to be announced in the Budget would result in a net reduction in taxes of just under £10bn for 2024/25 after taking account of threshold freezes and other tax changes.
The Resolution Foundation analysis does not take account of the normal pattern that sees governments typically raise taxes in the first Budget after a general election, which is even more likely this time around given what many commentators believe are unrealistic spending assumptions for 2025/26 onwards.
Month of January 2024
Self assessment tax receipts were lower than expected in January 2024, with the fiscal surplus of £17bn for the month coming in at £9bn better than last year but £2bn less than the OBR’s Autumn Statement projection.
Taxes and other receipts amounted to £120bn, up 4% compared with January 2023, while total managed expenditure was £103bn, down 5%.
Public sector net debt as of 31 January 2024 was £2,646bn or 96.5% of GDP, £41bn lower than 31 December but £107bn higher than at the start of the financial year.
Ten months to January 2024
The provisional shortfall in taxes and other receipts compared with total managed expenditure for the first five sixths of the 2023/24 financial year to January 2024 was £97bn, £3bn less than the £100bn deficit reported for the first ten months of 2022/23. This reflected a year-to-date shortfall between tax and other receipts of £901bn and total managed expenditure of £998bn, up 6% and 5% compared with April 2022 to January 2023.
Inflation benefited tax receipts for the first 10 months compared with the same period in the previous year, with income tax up 11% to £224bn and VAT up 6% to £165bn. Corporation tax receipts were up 17% to £85bn, partly reflecting the increase in the corporation tax rate from 19% to 25% from 1 April 2023.
Meanwhile,national insurance receipts were up by just 1% to £148bn as the abolition of the short-lived health and social care levy in 2022/23 offset the effect of wage increases in the current financial year, as well as the cut in national insurance implemented in January.
Council tax receipts were up 6% to £36bn, but stamp duty on properties was down by 25% to £11bn and the total for all other taxes was flat at £137bn as economic activity slowed. Non-tax receipts were up 10% to £95bn, primarily driven by higher investment income and higher interest charged on student loans.
Total managed expenditure of £998bn in the ten months to January 2024 can be analysed between current expenditure excluding interest of £846bn, interest of £105bn and net investment of £47bn, compared with £949n in the same period in the previous year, comprising £810bn, £114bn and £25bn respectively.
The increase of £36bn or 4% in current expenditure excluding interest was driven by a £28bn increase in pension and other welfare benefits (including cost-of-living payments), £18bn in higher central government pay and £10bn in additional central government procurement spending, less £13bn in lower subsidy payments (principally relating to energy support schemes) and £7bn in net other changes.
The fall in interest costs for the ten months of £9bn or 8% to £105bn comprises a £23bn or 50% reduction to £23bn for interest accrued on index-linked debt as the rate of inflation fell, partially offset by a £14bn or 21% increase to £82bn from higher interest rates on variable-rate debt and new and refinanced fixed-rate debt.
The £21bn increase in net investment spending to £47bn in the first ten months of the current year is distorted by a one-off credit of £10bn arising from changes in interest rates and repayment terms of student loans recorded in December 2022. Adjusting for that credit, the increase of £12bn reflects high construction cost inflation amongst other factors that saw a £16bn or 19% increase in gross investment to £101bn, less a £4bn or 8% increase in depreciation to £54bn.
Public sector finance trends: January 2024
The cumulative deficit of £97bn for the first 10 months of the financial year is £9bn below the OBR’s November 2023 forecast of £106bn for that same period. The OBR is forecasting deficits of £6bn and £12bn in February and March to result in a full year forecast of £124bn, or £115bn if the £9bn forecast variance persists.
Balance sheet metrics
Public sector net debt was £2,646bn at the end of January 2024, equivalent to 96.5% of GDP.
The debt movement since the start of the financial year is £107bn, comprising borrowing to fund the deficit for the ten months of £97bn plus £10bn in net cash outflows to fund lending to students, businesses and others, net of loan repayments and working capital movements.
Public sector net debt is £831bn more than the £1,815bn reported for 31 March 2020 at the start of the pandemic and £2,108bn more than the £538bn number as of 31 March 2007 before the financial crisis, reflecting the huge sums borrowed over the last couple of decades.
Public sector net worth, the new balance sheet metric launched by the ONS this year, was -£677bn on 31 January 2024, comprising £1,584bn in non-financial assets and £1,047bn in non-liquid financial assets minus £2,646bn of net debt (£303bn liquid financial assets – £2,949bn public sector gross debt) and other liabilities of £662bn. This is a £62bn deterioration from the -£615bn reported for 31 March 2023.
Revisions
Caution is needed with respect to the numbers published by the ONS, which are expected to be repeatedly revised as estimates are refined and gaps in the underlying data are filled.
The latest release saw the ONS revise the reported deficit for the nine months to December 2023 down by £6bn from £119bn to £113bn as estimates of tax receipts and expenditure were updated for better data and the correction of errors in HMRC reporting, while the debt to GDP ratio at the end of December 2023 was revised up by 0.5 percentage points from 97.7% to 98.2% as GDP estimates were updated.
The ONS also revised its estimate for the deficit for the financial year to March 2023, down by £1bn to £129bn for 2022/23.
Year-to-date deficit of £119bn is £5bn lower than latest Office for Budget Responsibility forecast – but is still £11bn worse than this time last year.
Public sector finances for December 2023, released by the Office for National Statistics (ONS) on Tuesday, reported a provisional deficit of £8bn – less than expected – while at the same time revising the year-to-date deficit down by £5bn. This brought the cumulative deficit for the first three-quarters of the financial year to £119bn, £11bn more than in the same nine-month period last year.
Alison Ring OBE FCA, ICAEW Director for Public Sector and Taxation, comments: “Today’s numbers show a cumulative deficit of £119bn for the first three-quarters of the financial year, the fourth highest on record. This should be close to the total at the end of the tax year, as income from self-assessment tax receipts in January is likely to offset deficits in February and March. At £5bn less than the Office for Budget Responsibility’s latest forecast, the Chancellor will be pleased by this marginal improvement in fiscal headroom just when he needs it most.
“However, the Chancellor will still be concerned by the tough economic landscape, with disappointing retail sales data for the final quarter of 2023 and an unexpected rise in inflation last month, and what that might mean for the fiscal forecasts. He is under significant pressure to cut taxes ahead of the general election, but will be all too aware of the need for greater investment in public services and infrastructure if he is to be able to lay the foundations for economic growth in the next Parliament. The risk of local authorities going bust will also be on his mind as he seeks to generate positive economic vibes going into the general election campaign.”
Month of December 2023
The provisional shortfall in taxes and other receipts compared with total managed expenditure for the month of December 2023 was £8bn, made up of tax and other receipts of £89bn less total managed expenditure of £97bn, up 6% and down 3% respectively compared with December 2022.
This was the lowest December deficit since 2019, principally because interest on Retail Prices Index-linked debt fell from £14bn in December 2022 to close to zero in December 2023.
Public sector net debt as at 31 December 2023 was £2,686bn or 97.7% of GDP, up £15bn during the month and £146bn higher than at the start of the financial year.
Nine months to December 2023
The provisional shortfall in taxes and other receipts compared with total managed expenditure for the first three quarters of the financial year to December 2023 was £119bn, £11bn more than the £108bn deficit reported for the first nine months of 2022/23.
This reflected a year-to-date shortfall between tax and other receipts of £776bn and total managed expenditure of £895bn, both up 6% compared with April to December 2022.
Inflation benefitted tax receipts for the first nine months compared with the same period in the previous year, with income tax up 10% to £178bn and VAT up 7% to £150bn. Corporation tax receipts were up 18% to £76bn, partly reflecting the increase in the corporation tax rate from 19% to 25% from 1 April 2023, while national insurance receipts were up by just 1% to £132bn as the abolition of the short-lived health and social care levy in 2022/23 offset the effect of wage increases in the current financial year.
Council tax receipts were up 6% to £33bn, but stamp duty on properties was down by 27% to £10bn and the total for all other taxes was down by 3% to £112bn as economic activity slowed. Non-tax receipts were up 11% to £84bn, primarily driven by higher investment income and higher interest receivable on student loans.
Total managed expenditure of £895bn in the nine months to December 2023 can be analysed between current expenditure excluding interest of £761bn, interest of £97bn and net investment of £37bn, compared with £841bn in the same period in the previous year, comprising £722bn, £103bn and £16bn respectively.
The increase of £39bn or 5% in current expenditure excluding interest was driven by a £24bn increase in pension and other welfare benefits (including cost-of-living payments), £15bn in higher central government pay and £8bn in additional central government procurement spending, less £6bn in lower subsidy payments (principally relating to energy support schemes) and £2bn in net other changes.
The fall in interest costs for the nine months of £6bn to £97bn comprises an £18bn or 39% fall to £28bn for interest accrued on index-linked debt from a lower rate of inflation, partially offset by a £12bn or 21% increase to £69bn for interest not linked to inflation from higher interest rates.
The £21bn increase in net investment spending to £37bn in the first nine months of the current year is distorted by a one-off credit of £10bn arising from changes in interest rates and repayment terms of student loans recorded in December 2022. Adjusting for that credit, the increase of £11bn or 42% reflects high construction cost inflation, among other factors, which saw a £14bn or 20% increase in gross investment to £85bn, less a £3bn or 7% increase in depreciation to £48bn.
Public sector finance trends: December 2023
The cumulative deficit of £119bn for the first three-quarters of the financial year is £5bn below the Office for Budget Responsibility (OBR)’s November 2023 forecast of £124bn for the nine months to December 2023. The OBR is also forecasting a full year forecast of £124bn as it expects self-assessment tax receipts in January to offset projected deficits in February and March 2024.
Balance sheet metrics
Public sector net debt was £2,686bn at the end of December 2023, equivalent to 97.7% of GDP.
The debt movement since the start of the financial year is £146bn, comprising borrowing to fund the deficit for the nine months of £119bn plus £27bn in net cash outflows to fund lending to students, businesses and others, net of loan repayments and working capital movements.
Public sector net debt is £871bn more than the £1,815bn reported for 31 March 2020 at the start of the pandemic and £2,330bn more than the £538bn number as of 31 March 2007 before the financial crisis, reflecting the huge sums borrowed over the last couple of decades.
Public sector net worth, the new balance sheet metric launched by the ONS this year, was -£715bn on 31 December 2023, comprising £1,584bn in non-financial assets and £1,049bn in non-liquid financial assets minus £2,686bn of net debt (£296bn liquid financial assets – £2,982bn public sector gross debt) and other liabilities of £662bn. This is a £100bn deterioration from the -£615bn reported for 31 March 2023.
Revisions
Caution is needed with respect to the numbers published by the ONS, which are expected to be repeatedly revised as estimates are refined and gaps in the underlying data are filled.
The latest release saw the ONS revise the reported deficit for the eight months to November 2023 down by £5bn from £116bn to £111bn as estimates of tax receipts and expenditure were updated for better data, while the debt to GDP ratio at the end of November 2023 was revised down by 0.1 percentage points from 97.5% to 97.4%.
The ONS also revised its estimate for the deficit for the financial year to March 2023, down by £1bn to £130bn for 2022/23.
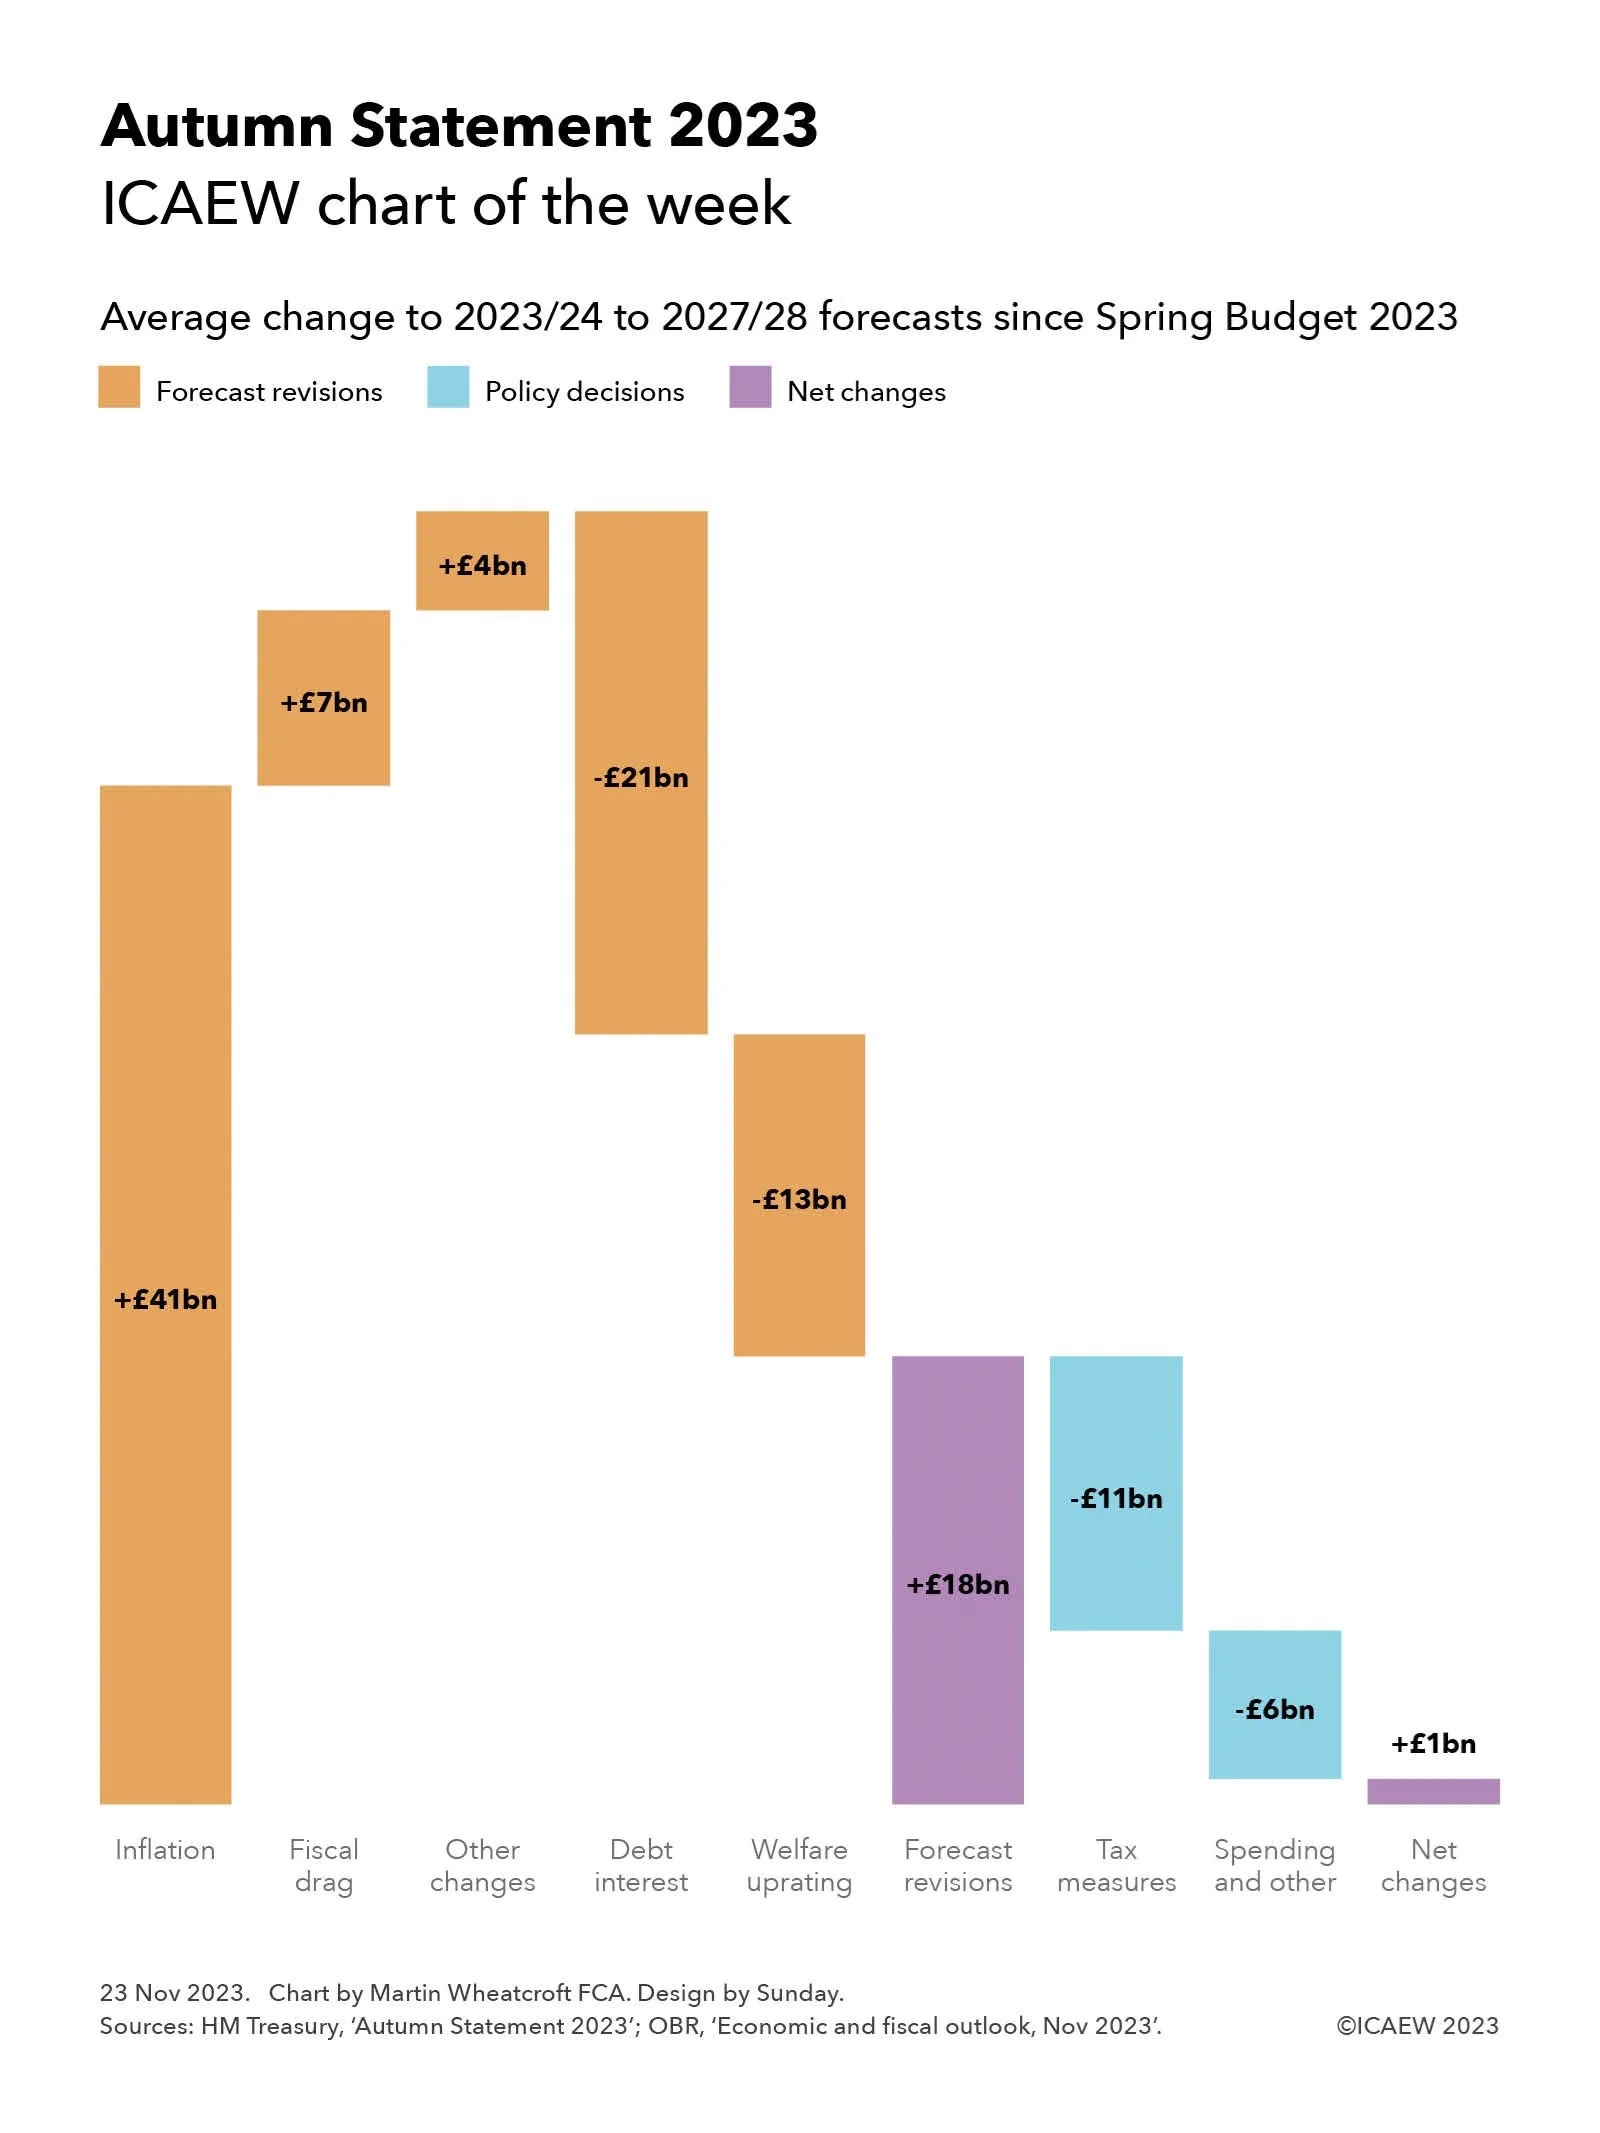
My chart for ICAEW this week illustrates how Chancellor Jeremy Hunt used almost all of the available upside from inflation and fiscal drag to fund his tax measures and a series of business growth initiatives.
The Autumn Statement 2023 on Wednesday 22 November featured a surprise tax cut to national insurance and a perhaps less surprising decision to make full expensing of business capital expenditure permanent.
As my chart illustrates, the forecasts for the deficit over the next five years benefited by £41bn a year on average in higher receipts from inflation, £7bn a year on average in additional ‘fiscal drag’ as higher inflation erodes the value of frozen tax allowances more quickly, and a net £4bn in other upward forecast revisions. These improvements to the forecasts were offset by an average of £21bn a year in higher debt interest and £13bn from the expected inflation-driven uprating of the state pension and welfare benefits, to arrive at a net improvement of £18bn a year on average over the five financial years from 2023/24 to 2027/28 before policy decisions.
In theory, these upward forecast revisions should be absorbed by more spending on public services as higher inflation feeds through into salaries and procurement costs. However, the Chancellor has chosen to (in effect) sharply cut public spending and use almost all of the upward revisions to fund tax measures and business growth initiatives instead. These amounted to £11bn a year on average in tax changes and £6bn a year on average in spending increases and other changes to reduce the net impact to just £1bn a year on average over the five-year period.
The resulting net change of £1bn on average in forecasts for the deficit is to reduce the forecast deficit by £8bn for the current year (from £132bn to £124bn) and by £1bn for 2024/25 (to £85bn), with no net change in 2025/26 (at £77bn), an increase of £5bn in 2027/28 (to £68bn), and no net change for 2027/28 (at £49bn).
The main tax changes announced were the cuts in national insurance for employees by 2 percentage points from 12% to 10% and by 1 percentage point for the self-employed from 9% to 8%, reducing tax receipts by an average of £9bn over five years. This is combined with the effect of making full expensing permanent of £4bn – this change mainly affects the later years of the forecast (£11bn in 2027/28), although ironically the average is a better proxy for the long-term cost of this change, which the OBR estimates is around £3bn a year.
Other tax changes offset this to a small extent.
Spending and other changes of £6bn a year on average comprise incremental spending of £7bn a year plus £2bn higher debt interest to fund that spending, less £3bn in positive economic effects from that spending and from the tax measures above.
Although the cumulative fiscal deficit over five years has been revised down by £4bn, the OBR has revised its forecast for public sector net debt as of 31 March 2028 up by £94bn from to £3,004bn. This principally reflects changes in the planned profile of quantitative tightening and higher lending to students and businesses.
The big gamble the Chancellor appears to be making by choosing to opt for tax cuts now is that the OBR and Bank of England’s pessimistic forecasts for the economy are not realised – enabling him to find extra money in future fiscal events to cover the effect of inflation on public service spending. Otherwise, while it may be possible to cut public spending by as much as the Autumn Statement suggests, it is difficult to see how he can do so without a further deterioration in the quality of public services given he is not providing any additional investment in technology, people and process transformation to deliver sustainable efficiency gains.
Higher self-assessment tax receipts and end of energy support payments help improve what is otherwise a disappointing set of numbers.
The monthly public sector finances for July 2023 were released by the Office for National Statistics (ONS) on Tuesday 22 August 2023. These reported a provisional deficit for the fourth month of the 2023/24 financial year of £4bn, bringing the total deficit for the four months to £57bn, £14bn more than in the first third of the previous year.
Alison Ring OBE FCA, Public Sector and Taxation Director for ICAEW, said: “These numbers reflect a mixed set of results for the first four months of the financial year, as higher self assessment tax receipts and the end of energy price guarantee support payments led to an improved fiscal situation in July. But debt remains on track to hit £2.7trn by the end of the year, up from £1.8trn before the pandemic, adding to the scale of the challenge facing the government and taxpayers in repairing the public finances.
“Stubbornly high core inflation and the prospect of further interest rate rises will concern the Chancellor as he bears down on public spending in the hope of freeing up the money he needs to both pay for the state pension triple-lock and find room for pre-election tax cuts.”
Month of July 2023
The provisional shortfall in taxes and other receipts compared with total managed expenditure for the month of July 2023 was £4bn, being tax and other receipts of £93bn less total managed expenditure of £97bn, up 5% and 9% respectively compared with July 2022.
This was the fifth-highest July deficit on record since monthly records began in 1993, despite being a £3bn improvement over July 2022, driven by higher self assessment tax receipts and the end of payments under the energy price guarantee.
Four months to July 2023
The provisional shortfall in taxes and other receipts compared with total managed expenditure for the four months to July 2023 was £57bn, £14bn more than the £43bn deficit reported for the first third of the previous financial year (April to July 2022). This reflected a widening gap between tax and other receipts for the four months of £343bn and total managed expenditure of £400bn, up 7% and 10% respectively compared with April to July 2022.
Inflation benefited tax receipts for the four months, with income tax up 13% to £85bn and VAT up 9% to £65bn. The rise in corporation tax, up 17% to £30bn, reflected both inflation and the increase in the corporation tax rate to 25% from 1 April 2023. However, national insurance receipts were down by 3% to £57bn because of the abolition of the short-lived health and social care levy last year, while the total for all other taxes was down by 1% to £69bn as economic activity slowed. Other receipts were up 17% to £37bn, driven by higher investment income.
Total managed expenditure of £400bn in the four months to July can be analysed between current expenditure excluding interest of £334bn (up £26bn or 8% over the same period in the previous year), interest of £51bn (up £7bn or 16%), and net investment of £15bn (up £4bn or just over a third).
The increase of £26bn in current expenditure excluding interest compared with the prior year has been driven by £11bn from the uprating of benefit payments, £8bn in higher central government staff costs, £3bn in central government procurement and £5bn in energy support scheme costs, less £1bn in net other changes.
The rise in interest costs of £7bn to £51bn reflects a fall in the interest payable on index-linked debt of £6bn from £30bn to £24bn as inflation has moderated compared with the same period last year, combined with a £13bn increase in interest on non-inflation linked debt from £14bn to £27bn as the Bank of England base rate rose.
The £4bn increase in net investment spending to £15bn in the first four months of the current year reflects high construction cost inflation among other factors that saw a £5bn or 17% increase in gross investment to £35bn, less a £1bn increase in depreciation to £20bn.
Public sector finance trends: July 2023
Four months to
Jul 2019 (£bn)
Jul 2020 (£bn)
Jul 2021 (£bn)
Jul 2022 (£bn)
Jul 2023 (£bn)
Receipts
270
234
282
320
343
Expenditure
(259)
(348)
(310)
(308)
(334)
Interest
(24)
(15)
(23)
(44)
(51)
Net investment
(10)
(26)
(13)
(11)
(15)
Deficit
(23)
(155)
(64)
(43)
(57)
Other borrowing
4
(66)
(22)
5
10
Debt movement
(19)
(221)
(86)
(38)
(47)
Net debt
1,796
2,036
2,239
2,420
2,579
Net debt / GDP
80.1%
96.9%
97.7%
96.6%
98.5%
Source: ONS, ‘Public sector finances, July 2023’.
Caution is needed with respect to the numbers published by the ONS, which are expected to be repeatedly revised as estimates are refined and gaps in the underlying data are filled. The latest release saw the ONS revise the reported deficit for the three months to June 2023 down by £2bn as estimates of tax receipts and expenditure were updated for better data, as well as reduce the reported deficit for the 2022/23 financial year by £1bn from £132bn to £131bn for similar reasons. The ONS also revised its estimates of GDP for more recent economic data, resulting in a lower reported net debt / GDP ratio.
Balance sheet metrics
Public sector net debt was £2,579bn at the end of July 2023, equivalent to 98.5% of GDP.
The debt movement since the start of the financial year was £47bn, comprising borrowing to fund the deficit for the four months of £57bn plus £10bn in net cash inflows as loan repayments and positive working capital movements exceeded cash outflows for lending to students, business and others.
Public sector net debt is £764bn or 42% higher than it was on 31 March 2020, reflecting the huge sums borrowed since the start of the pandemic.
Public sector net worth, the new balance sheet metric launched by the Office for National Statistics this year, was -£631bn on 31 July 2023, comprising £1,604bn in non-financial assets, £1,011bn in non-liquid financial assets and £336bn in liquid financial assets less public sector gross debt of £2,915bn and other liabilities of £667bn. This is a £54bn deterioration from the -£577bn reported for 31 March 2023.
This new measure seeks to capture more assets and liabilities than the narrowly focused public sector net debt measure traditionally used to assess the financial position of the UK public sector. However, it excludes unfunded employee pension liabilities that amounted to more than £2trn at 31 March 2021 according to the Whole of Government Accounts, although they are expected to be much lower today as discount rates have risen significantly since then.
The mystery of just why so many businesses sit just below the VAT registration threshold will be a big topic of debate at ICAEW’s VAT at 50 conference on Monday 22 May.
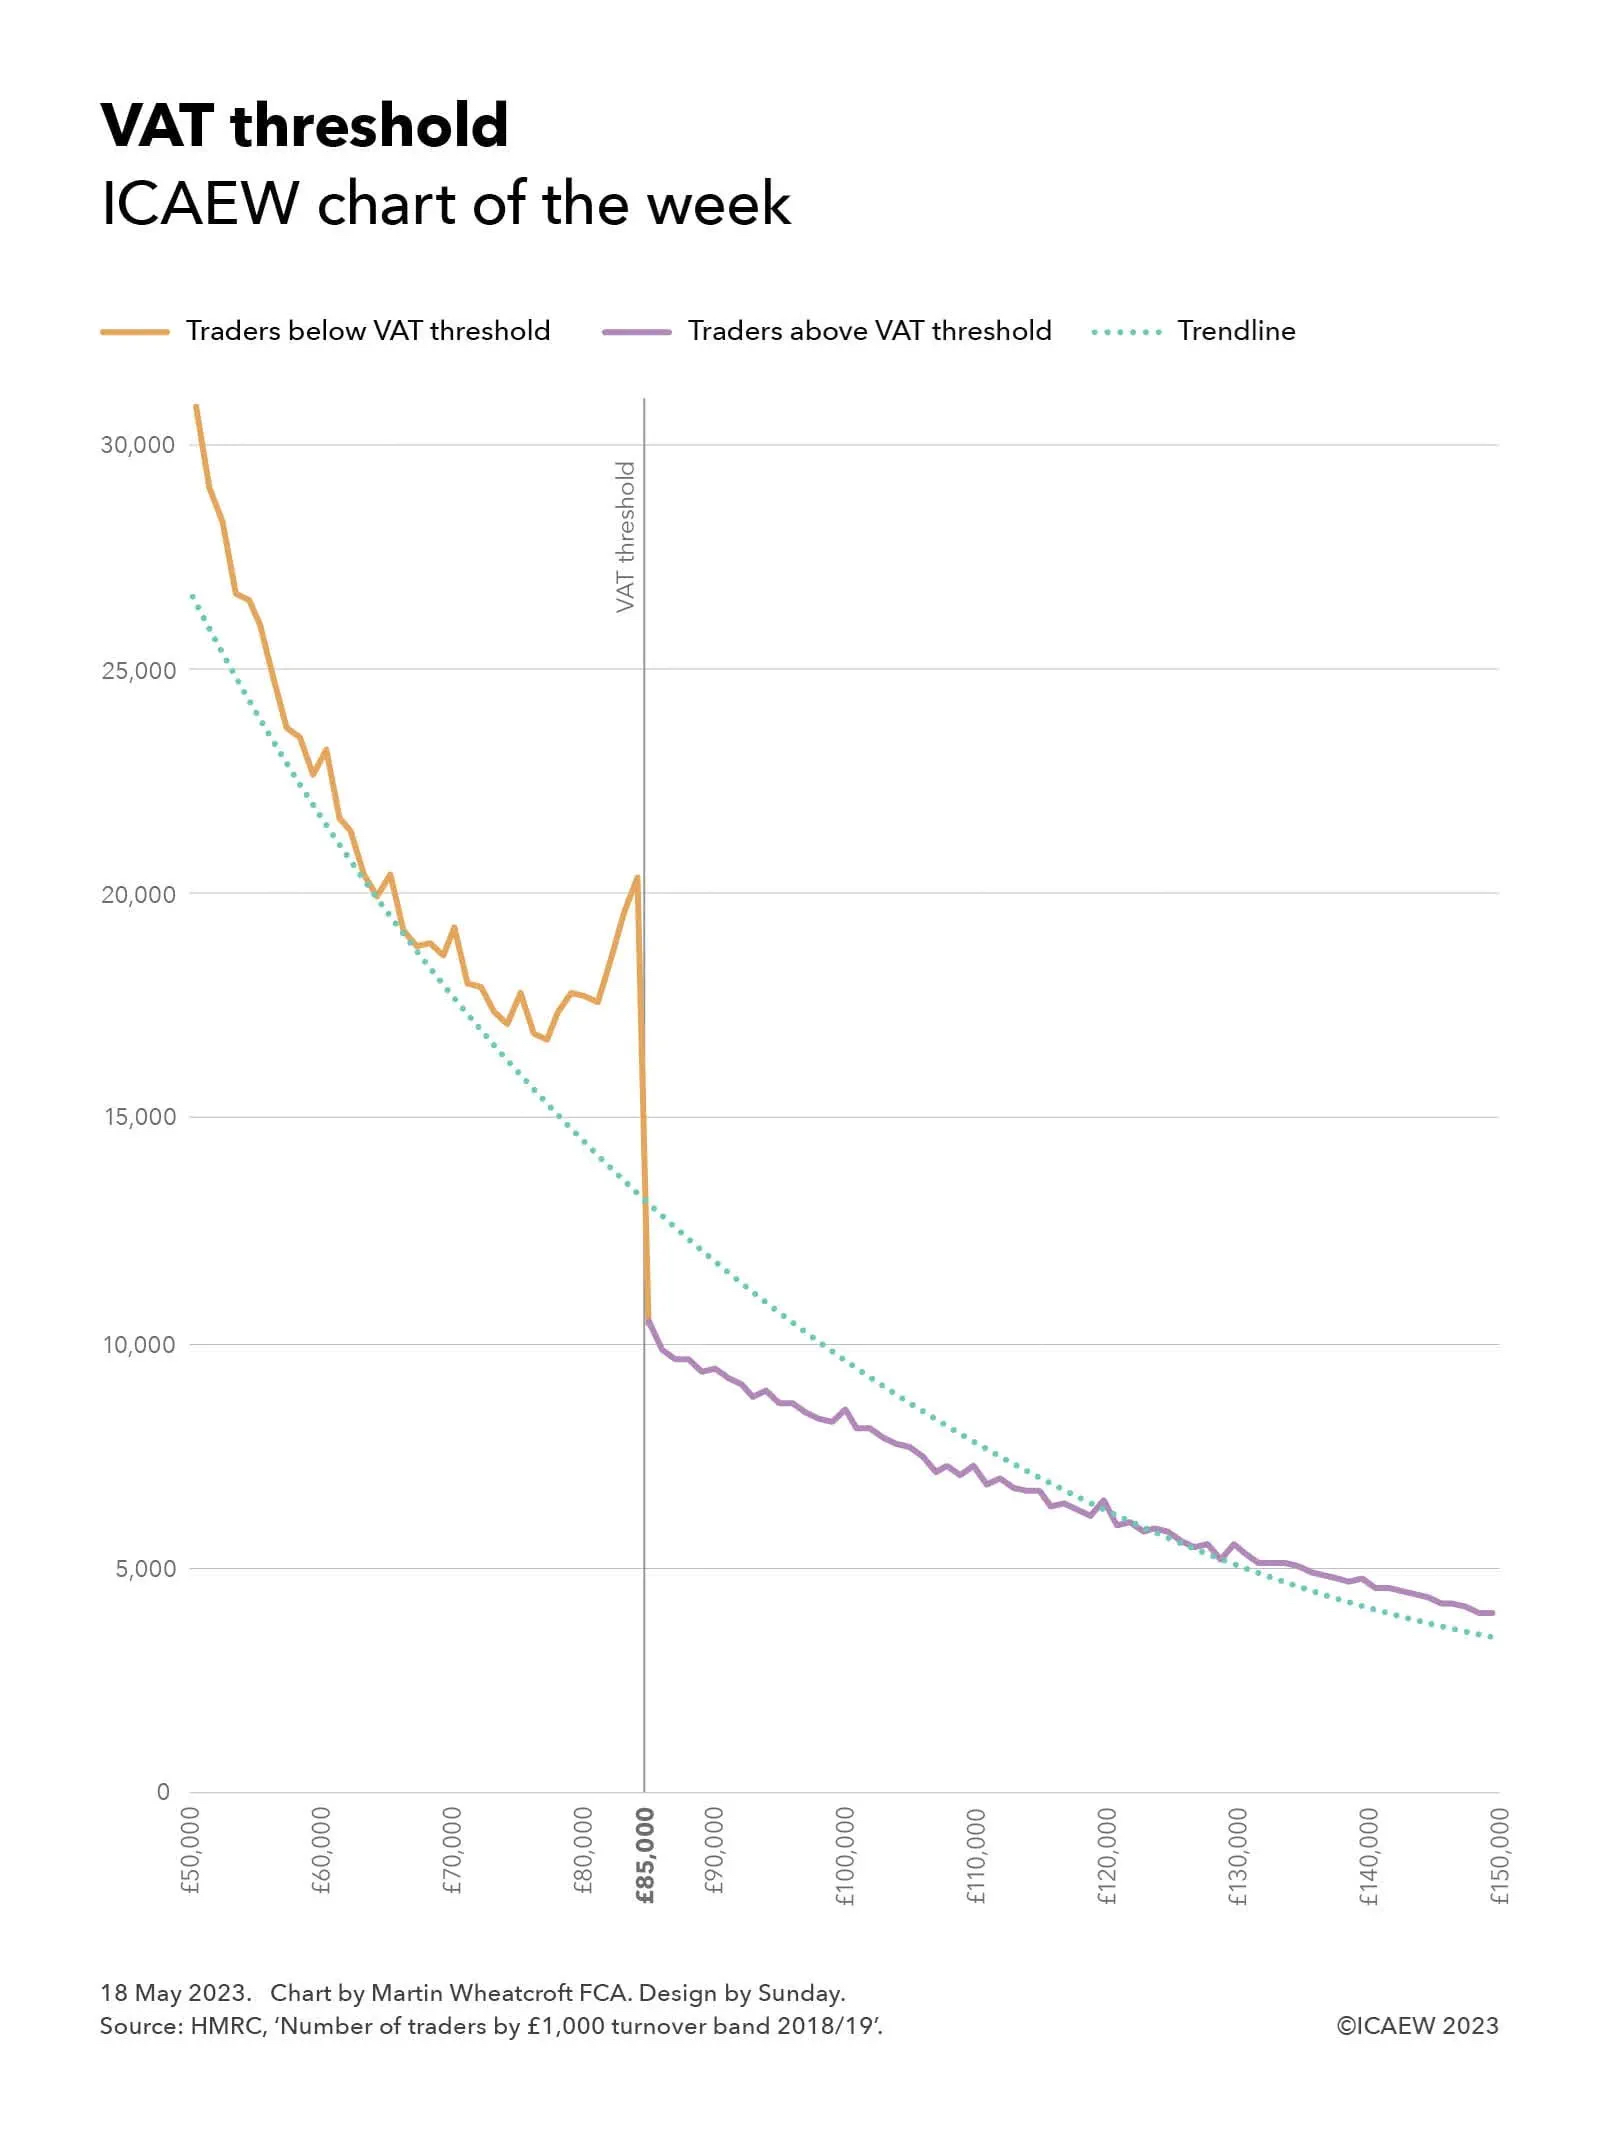
Our chart this week celebrates the 50th anniversary of the introduction in the UK of Value Added Tax (VAT), the indirect tax on commercial transactions that now generates around 20% of tax receipts.
One of the big mysteries in the tax system is why so many small businesses and sole traders cluster just below the VAT threshold of £85,000.
As illustrated by our chart, the number of businesses below the threshold gradually falls from almost 31,000 in the turnover band between £50,000 and £50,999 to just under 17,000 in the turnover band between £77,000 and £77,999, before diverging above the trendline to increase up to just over 20,000 in the £84,000 to £84,999 turnover band – immediately below the threshold for registering for VAT. This is almost twice as many as the just over 10,000 traders in the £85,000 to £85,999 turnover band, the first band legally required to register for VAT.
One explanation may be that there is some gaming (or possibly even misreporting) going on, with business owners approaching the threshold for VAT deciding to spread their business activities across multiple legal entities or keeping ‘cash-in-hand’ transactions off the books to avoid, or evade, adding VAT of 20% in most cases onto their prices.
However, perhaps a more worrying concern is if these businesses are not getting around the rules, but instead deliberately choosing to keep their businesses small given the competitive disadvantage that goes with adding VAT to prices charged to consumers, and the hassles and hazards involved with becoming a tax collector on behalf of the government.
This is a big issue for a UK economy experiencing weak economic growth. Not only is government income at stake, but also the wider benefits of more prosperous small businesses to the overall economy and what that means for the national economy.
Of course, many businesses do register despite being below the threshold, with around 1.1m traders in 2018/19 with turnover less than £85,000 signed up to VAT.
Other countries take a different approach, with much lower registration thresholds across most of Europe. Domestic thresholds range from nil in Spain, Italy and Greece, NOK40,000 (approximately £3,000) in Norway, €22,000 (£19,000) in Germany and €37,500 (£33,000) in Ireland, up to €50,000 (£43,000) in Slovenia. Switzerland is an exception with a higher registration threshold than the UK at CHF100,000 (£89,000).
In general, this means that a much greater proportion of actively trading businesses across Europe are registered for VAT compared with the UK, where there are estimated to be more than 3m or so traders with annual revenue of between £10,000 and £84,999 who have not registered for VAT – more than £100bn in total revenue.
Some believe that raising the threshold would provide a boost to the economy, given that many businesses would be more willing to grow (or declare) more of their revenue, while others believe the better option would be to reduce the threshold to capture many more businesses. The former would likely result in lower tax receipts overall, by allowing businesses just above the existing threshold to stop collecting VAT. The latter should in theory generate much more in tax receipts, perhaps as much as £20bn a year, in addition to removing one of the distortions that the tax system creates in this part of the economy.
The irony is that a relatively high VAT threshold in the UK designed to encourage and support small businesses may be one of the factors holding back economic growth. And with an unchanged threshold combined with inflation of more than 10% over the past year, this may be an even bigger drag on the economy/incentive to cheat than it has been in the past.
Click here to find out more about VAT at 50, ICAEW’s celebration (if that is the right word) of the 50th anniversary of VAT, and what the future holds for our most beloved of indirect taxes.
February fiscal deficit hits £17bn, while the cumulative deficit for 11 months of £132bn doesn’t include backdated public sector pay awards.
The monthly public sector finances for February 2023 released on Tuesday 21 March 2023 reported a provisional deficit for the month of £17bn, which is a return to red after a surplus of £8bn last month in January 2023.
The deficit was £10bn more than the £7bn deficit reported for the same month last year (February 2022), as higher interest costs, higher inflation on index-linked debt, and the cost of the energy price guarantee for households and businesses incurred during the month drove up the need to borrow.
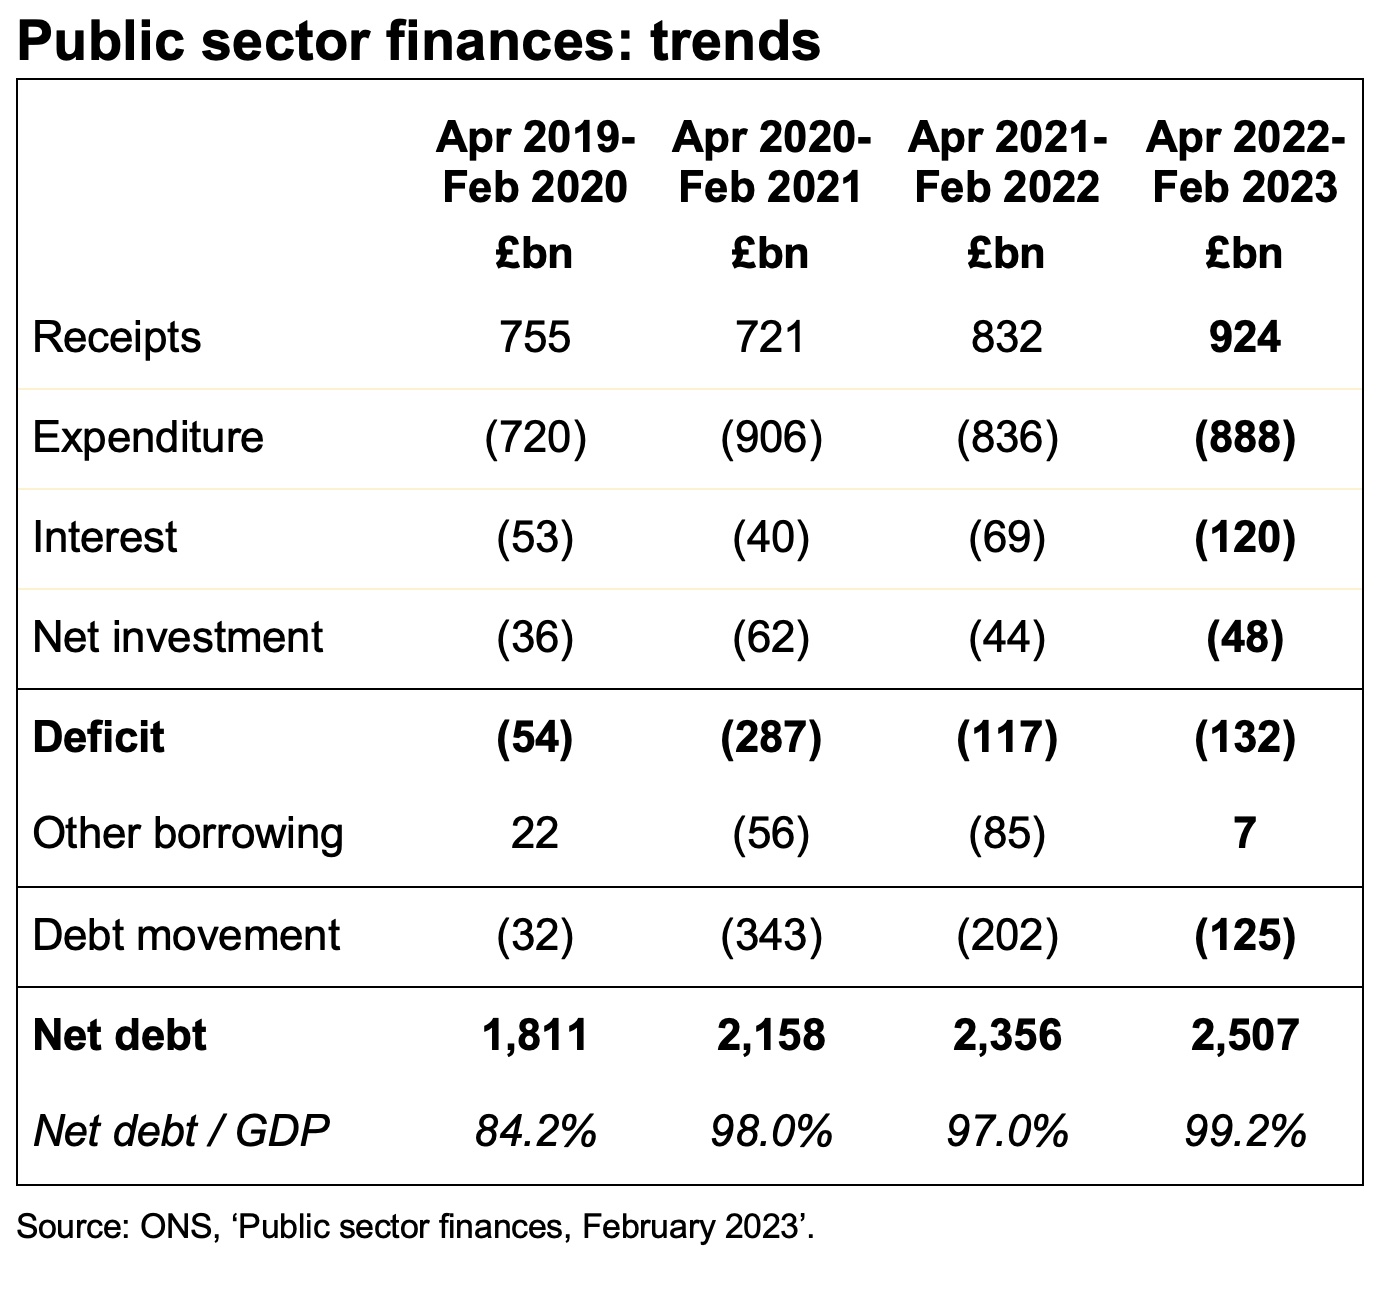
The cumulative deficit for the first 11 months of the financial year was £132bn, which is £15bn more than in the same period last year but £155bn lower than in 2020/21 during the first stages of the pandemic. It was £78bn more than the deficit of £54bn reported for the first 11 months of 2019/20, the most recent pre-pandemic pre-cost-of-living-crisis comparative period.
The reported deficit does not reflect backdated public sector pay settlements that have been or are expected to be agreed in March 2023, although the numbers are broadly in line with the £152bn estimated deficit for the full year in the Office for Budget Responsibility (OBR)’s revised forecasts made at the time of the Spring Budget. This was lower than their previous forecast of £177bn in November, primarily because the energy price guarantee is costing less than anticipated.
Public sector net debt was £2,507bn or 99.2% of GDP at the end of February 2023. This is £692bn higher than net debt of £1,815bn on 31 March 2020, reflecting the huge sums borrowed since the start of the pandemic. The OBR’s latest forecast is for net debt to reach £2,546bn by March 2023 and to exceed £2.9trn by March 2028.
Tax and other receipts in the 11 months to 28 February 2023 amounted to £924bn, £91bn or 11% higher than a year previously. Higher income tax and national insurance receipts were driven by rising wages and the higher rate of national insurance for part of the year, while VAT receipts benefited from inflation in retail prices.
Expenditure excluding interest and investment for the 11 months of £888bn was £52bn or 6% higher than the same period in 2021/22, with Spending Review planned increases in spending, the effect of inflation, and the cost of energy support schemes partially offset by the furlough programmes and other pandemic spending in the comparative period not being repeated this year.
Interest charges of £120bn for the 11 months were £51bn or 73% higher than the £69bn reported for the equivalent period in 2021/22, through a combination of higher interest rates and higher inflation driving up the cost of RPI-linked debt.
Cumulative net public sector investment to February was £48bn, £4bn more than this time last year. This is much less than might be expected given the Spending Review 2021 pencilled in significant increases in capital expenditure budgets in the current year.
The increase in net debt of £125bn since the start of the financial year comprised borrowing to fund the deficit for the 11 months of £132bn, less £7bn in net cash inflows from repayments of deferred taxes, and loans made to businesses during the pandemic, less funding for student, business and other loans together with working capital requirements.
Alison Ring OBE FCA, Public Sector and Taxation Director for ICAEW, said: “The public finances are back in the red this month as a deficit of £17bn brings the total for the 11 months to February to £132bn, with public sector net debt in excess of £2.5trn. Although broadly in line with the OBR’s improved estimate accompanying the Spring Budget, the numbers don’t reflect the cost of backdated public sector pay settlements to be recorded in the final month of the 2022/23 financial year.
“The chancellor still needs to top up departmental budgets for pay awards in the next financial year, reducing his capacity to address inflationary cost pressures in other areas. HS2 may not be the only capital programme at risk of being scaled back or delayed as he seeks to make savings.”
Caution is needed with respect to the numbers published by the ONS, which are expected to be repeatedly revised as estimates are refined and gaps in the underlying data are filled.
The ONS made several revisions to prior period fiscal numbers to reflect revisions to estimates. These had the effect of reducing the reported fiscal deficit for the 10 months ended 31 January 2023 by £1bn to £116bn.
My chart this week is on the Chancellor’s tax and spending plans for the coming financial year commencing on 1 April 2023.
Chancellor Jeremy Hunt presented his first Budget to Parliament on Wednesday 15 March 2023, setting out his formal Budget estimate for the financial year ended 31 March 2024 (2023/24) accompanied by fiscal forecasts from the Office for Budget Responsibility (OBR) for the period up to 2027/28 and the OBR’s final estimate for the current financial year ending on 31 March 2023.
Our chart this week starts by summarising the final estimate for 2022/23, highlighting an expected shortfall of £152bn between anticipated receipts of £1,020bn and spending of £1,172bn. This is followed by a similar analysis for the budget year of 2023/24, with a deficit of £132bn resulting from a shortfall between estimated taxes and other receipts of £1,057bn and spending of £1,189bn.
Receipts in 2022/23 and 2023/34 respectively comprise £922bn and £950bn in tax and £98bn and £107bn in other receipts. The increase in tax of 3.0% is perhaps lower than might be expected given the level of inflation and the new higher rate of corporation tax from 1 April 2023, with an anticipated 10% growth in corporation tax receipts (net of full expensing of business investment) offset by flat or relatively small growth in other taxes. Other receipts are expected to increase by 9%, primarily the effect of higher interest rates on investments.
Total managed expenditure in 2022/23 and 2023/24 respectively comprise £968bn and £1,015bn in current expenditure excluding energy support costs and debt interest, £30bn and £5bn in energy support packages, £115bn and £95bn in debt interest, and £59bn and £74bn in net investment.
Current expenditure excluding energy support costs and debt interest is expected to increase by 4.9% in 2023/24 compared with 2022/23, more than the 2.5% ‘whole economy’ measure of inflation used by the government and the 4.1% forecast for consumer price inflation. This partly relates to inflation in the current financial year feeding through into next year’s budgets, as well as spending measures announced by the Chancellor.
The three-month extension of the energy price guarantee is anticipated to cost £3bn in 2023/24, with other energy support measures adding a further £2bn to the forecast.
Debt interest is expected to fall by 17% to £95bn, principally because of the effect of a much lower rate of inflation on index-linked debt more than offsetting higher interest rates overall.
Public sector net investment comprises gross investment of £116bn and £134bn in the two years respectively, net of depreciation of £57bn and £60bn respectively. The increase in gross investment is flattered by a £8bn one-off credit in the current financial year arising from changes to student loans, which if excluded implies an 8% increase in capital expenditure and other public investment overall. This reflects delays in capital programmes that are expected to come in significantly under budget in the current financial year but cost more in the next, relatively high construction price inflation, and an extra £2bn of capital investment allocated to defence.
The final estimate for the deficit in the current financial year of £152bn is £25bn lower than was expected in the OBR’s November 2022 forecast of £177bn, while the Budget estimate for 2023/24 of £132bn is £8bn lower than the £140bn forecast last time. The reduction in 2022/23 reflects the benefit of a slightly improved economic outlook, with policy decisions for the last couple of weeks of the financial year by the Chancellor netting off to close to nil. This contrasts with 2023/24, where forecast upsides amounting to around £27bn have been mostly offset by a net cost of £19bn from tax and spending decisions.
Overall, the chart highlights just how much money the UK raises in tax and incurs in public spending. Tax and other receipts are expected to approach £1.1trn in the coming financial year, while public spending is anticipated to be just under £1.2trn.
On a per capita basis in 2023/24 this is equivalent to receipts and spending of approximately £1,290 per month and £1,450 per month for each person in the UK respectively, a shortfall of £160 per person per month that needs to be funded by borrowing.
The challenge for the Chancellor is that with the number of pensioners projected to increase by 9% over the next five years (with consequent implications for spending on pensions, welfare, health and social care), there is not much room to invest in public services or in infrastructure at the same time as also reducing taxes as he would very much like to do.
The Chancellor wasn’t able to square this circle in the Spring Budget 2023, so watch this space to see whether he can be any more successful in future fiscal events.

![Table with fiscal numbers for the ten months to Jan 2020, Jan 2021, Jan 2022, Jan 2023 and Jan 2024, all in £bn.
Receipts: 685 | 647 | 754 | 849 | 901
Expenditure: (588) | (746) | (686) | (722) | (761)
Interest: (44) | (33) | (55) | (103) | (97)
Net investment: (26) | (51) | (35) | (16) | (37)
[subtotal] Deficit: (61) | (270) | (123) | (108) | (119)
Other borrowing: 3 | (67) | (85) | (8) | (27)
[total] Debt movement: (58) | (337) | (208) | (116) | (146)
Net debt: 1,835 | 2,152 | 2,360 | 2,497 | 2,686
Net debt / GDP: 84.8% | 98.7% | 97.9% | 95.8% | 97.7%](https://martinwheatcroft.com/wp-content/uploads/2024/02/Public-sector-finance-trends-2024-01.jpg)
![Table showing fiscal numbers for the nine months to Dec 2019, 2020, 2021, 2022 and 2023.
Receipts: 597 | 560 | 653 | 733 | 776
Expenditure: (588) | (746) | (686) | (722) | (761)
Interest: (44) | (33) | (55) | (103) | (97)
Net investment: (26) | (51) | (35) | (16) | (37)
[subtotal] Deficit: (61) | (270) | (123) | (108) | (119)
Other borrowing: 3 | (67) | (85) | (8) | (27)
[total] Debt movement: (58) | (337) | (208) | (116) | (146)
Net debt: 1,835 | 2,152 | 2,360 | 2,497 | 2,686
Net debt / GDP: 84.8% | 98.7% | 97.9% | 95.8% | 97.7%](https://martinwheatcroft.com/wp-content/uploads/2024/02/Public-sector-finance-trends-2023-12.jpg)