ICAEW chart of the week: The start of a new fiscal year

My first chart of the financial year starting 1 April 2026 for ICAEW looks at the government’s £1.4tn budget for 2026/27.
ICAEW chart of the week: The start of a new fiscal year. 

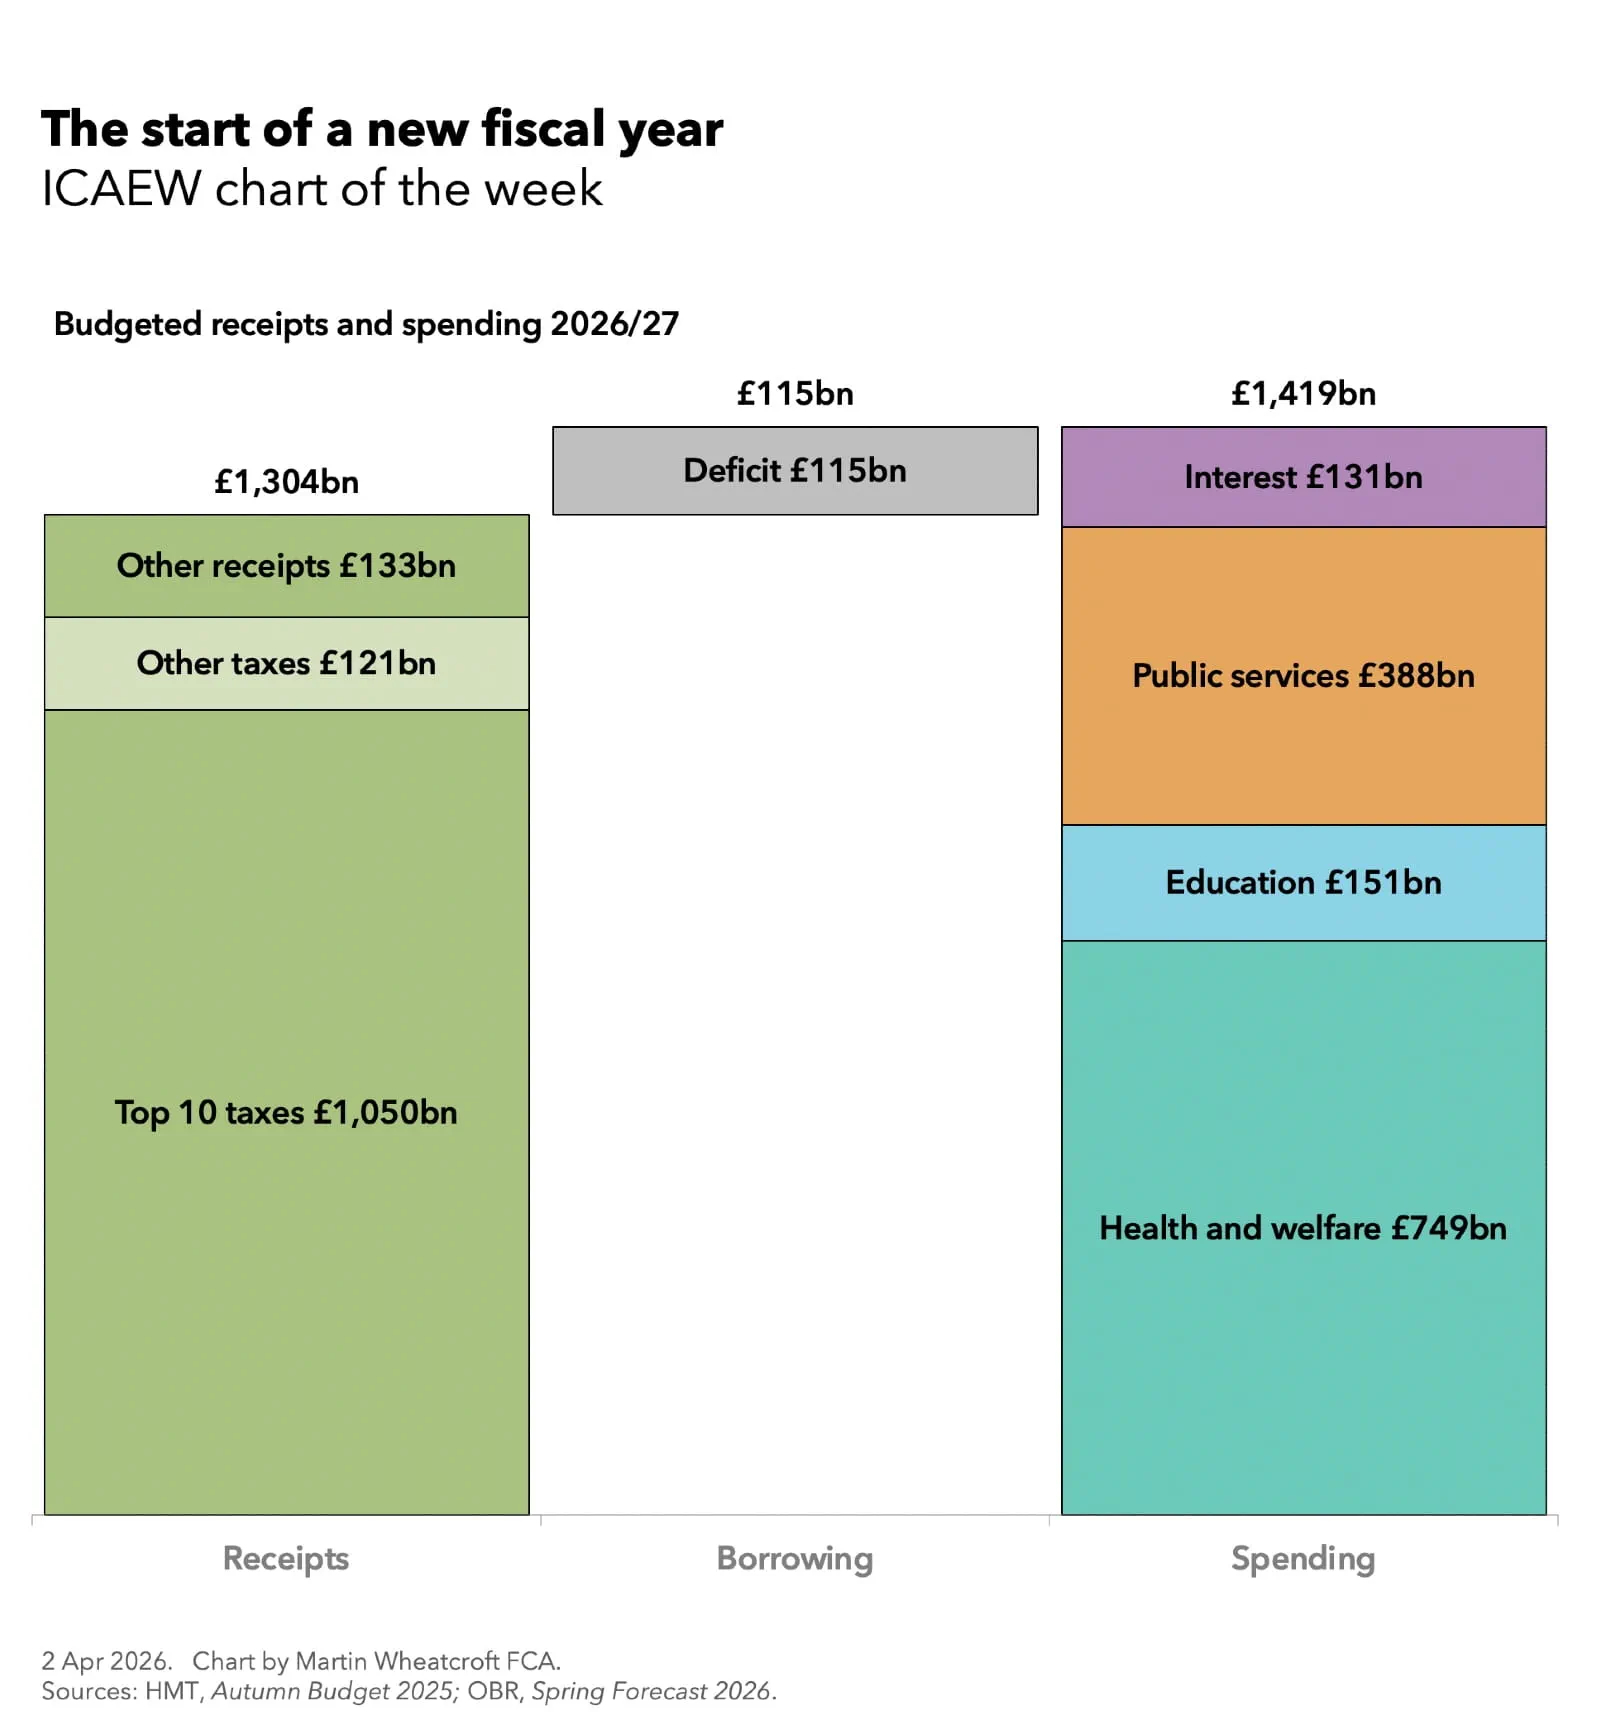
A step chart showing budgeted receipts and spending for 2026/27. 

Receipts £1,304bn = Top 10 taxes £1,050bn + Other taxes £121bn + Other receipts £133bn. 

Borrowing £115bn = deficit £115bn. 

Spending £1,419bn = Health and welfare £749bn + Education £151bn + Public services £388bn + Interest £131bn. 

2 Apr 2026. Chart by Martin Wheatcroft FCA. 
Sources: HMT, Autumn Budget 2025; OBR, Spring Forecast 2026.

My chart fir ICAEW this week is on the public sector budget for the 2026/27 financial year which began on 1 April 2026, showing how there is expected to be a shortfall of £116bn between anticipated receipts of £1,304bn and planned spending of £1,419bn.

This is equivalent to a deficit of 3.6% of GDP, calculated as receipts of 41.2% of GDP less total managed expenditure of 44.8% of GDP.

The chart highlights how the top 10 taxes are expected to generate £1,050bn (81% of total receipts), with all other taxes contributing £121bn (9%) and other receipts generating £133bn (10%). 

The top 10 taxes comprise: income tax which generates £360bn, VAT (£220bn), employer national insurance (£155bn), corporation tax (£102bn), employee and self-employed national insurance (£57bn), council tax (£54bn), business rates (£37bn), fuel duties (£24bn), capital gains tax (£21bn) and property transaction taxes (stamp duty in England) generating £20bn. 

The remaining £121bn of tax receipts comprises £84bn from the next 10 largest taxes: environmental duties (£16bn), alcohol duties (£13bn), vehicle excise duty (£10bn), inheritance tax (£9bn), insurance premium tax (£9bn), tobacco duties (£7bn), air passenger duty (£5bn), stamp duty on shares (£5bn), customs duties (£5bn) and the apprenticeship levy (£5bn), and £37bn from all other taxes and duties.

Other receipts comprise £87bn from operating surpluses (including social housing rents and the profits of public corporations), £43bn in interest and dividends (on investments and cash balances), and £3bn other receipts.

On the spending side, the chart illustrates how the £749bn budgeted for health and welfare is more than half of the total (approximately 53%), while education spending is budgeted to be £151bn (11%), public services outside of health, social care and education amount to £388bn (27%) and interest is forecast to be £131bn (9%).

Health and welfare spending comprises £401bn on welfare (including the state pension), £294bn on health (principally the NHS), and social care provision of £54bn. Budgeted spending on public services outside of health, social care and education include defence and security of around £70bn, transport £69bn, public order and safety £62bn, industry, agriculture and employment £56bn, and housing and environment £51bn, together with £80bn across the hundreds of other public services provided by central and local government.

The planned borrowing to fund the deficit of £116bn, the difference between receipts and total managed expenditure, excludes £15bn in other borrowing to fund government lending activities and working capital movements, with public sector net debt scheduled to rise above £3tn during the coming financial year. 

The problem for the Chancellor – and for all of us – is that the actual numbers for 2026/27 could be significantly worse from the budgeted amounts presented in our chart. Not only is she already under significant pressure to increase defence spending and alleviate student loans (amongst many other spending challenges), but the conflict with Iran will make the situation even more challenging for both the government and the nation.

On that cheery note, we would like to wish you all the best for the new (financial) year. 
This chart was originally published by ICAEW.

ICAEW chart of the week: Receipts and spending by age

My chart this week looks at how receipts and spending vary by age, a key driver for public finances that new Chancellor Kwasi Kwarteng will need to factor into his fiscal plans.

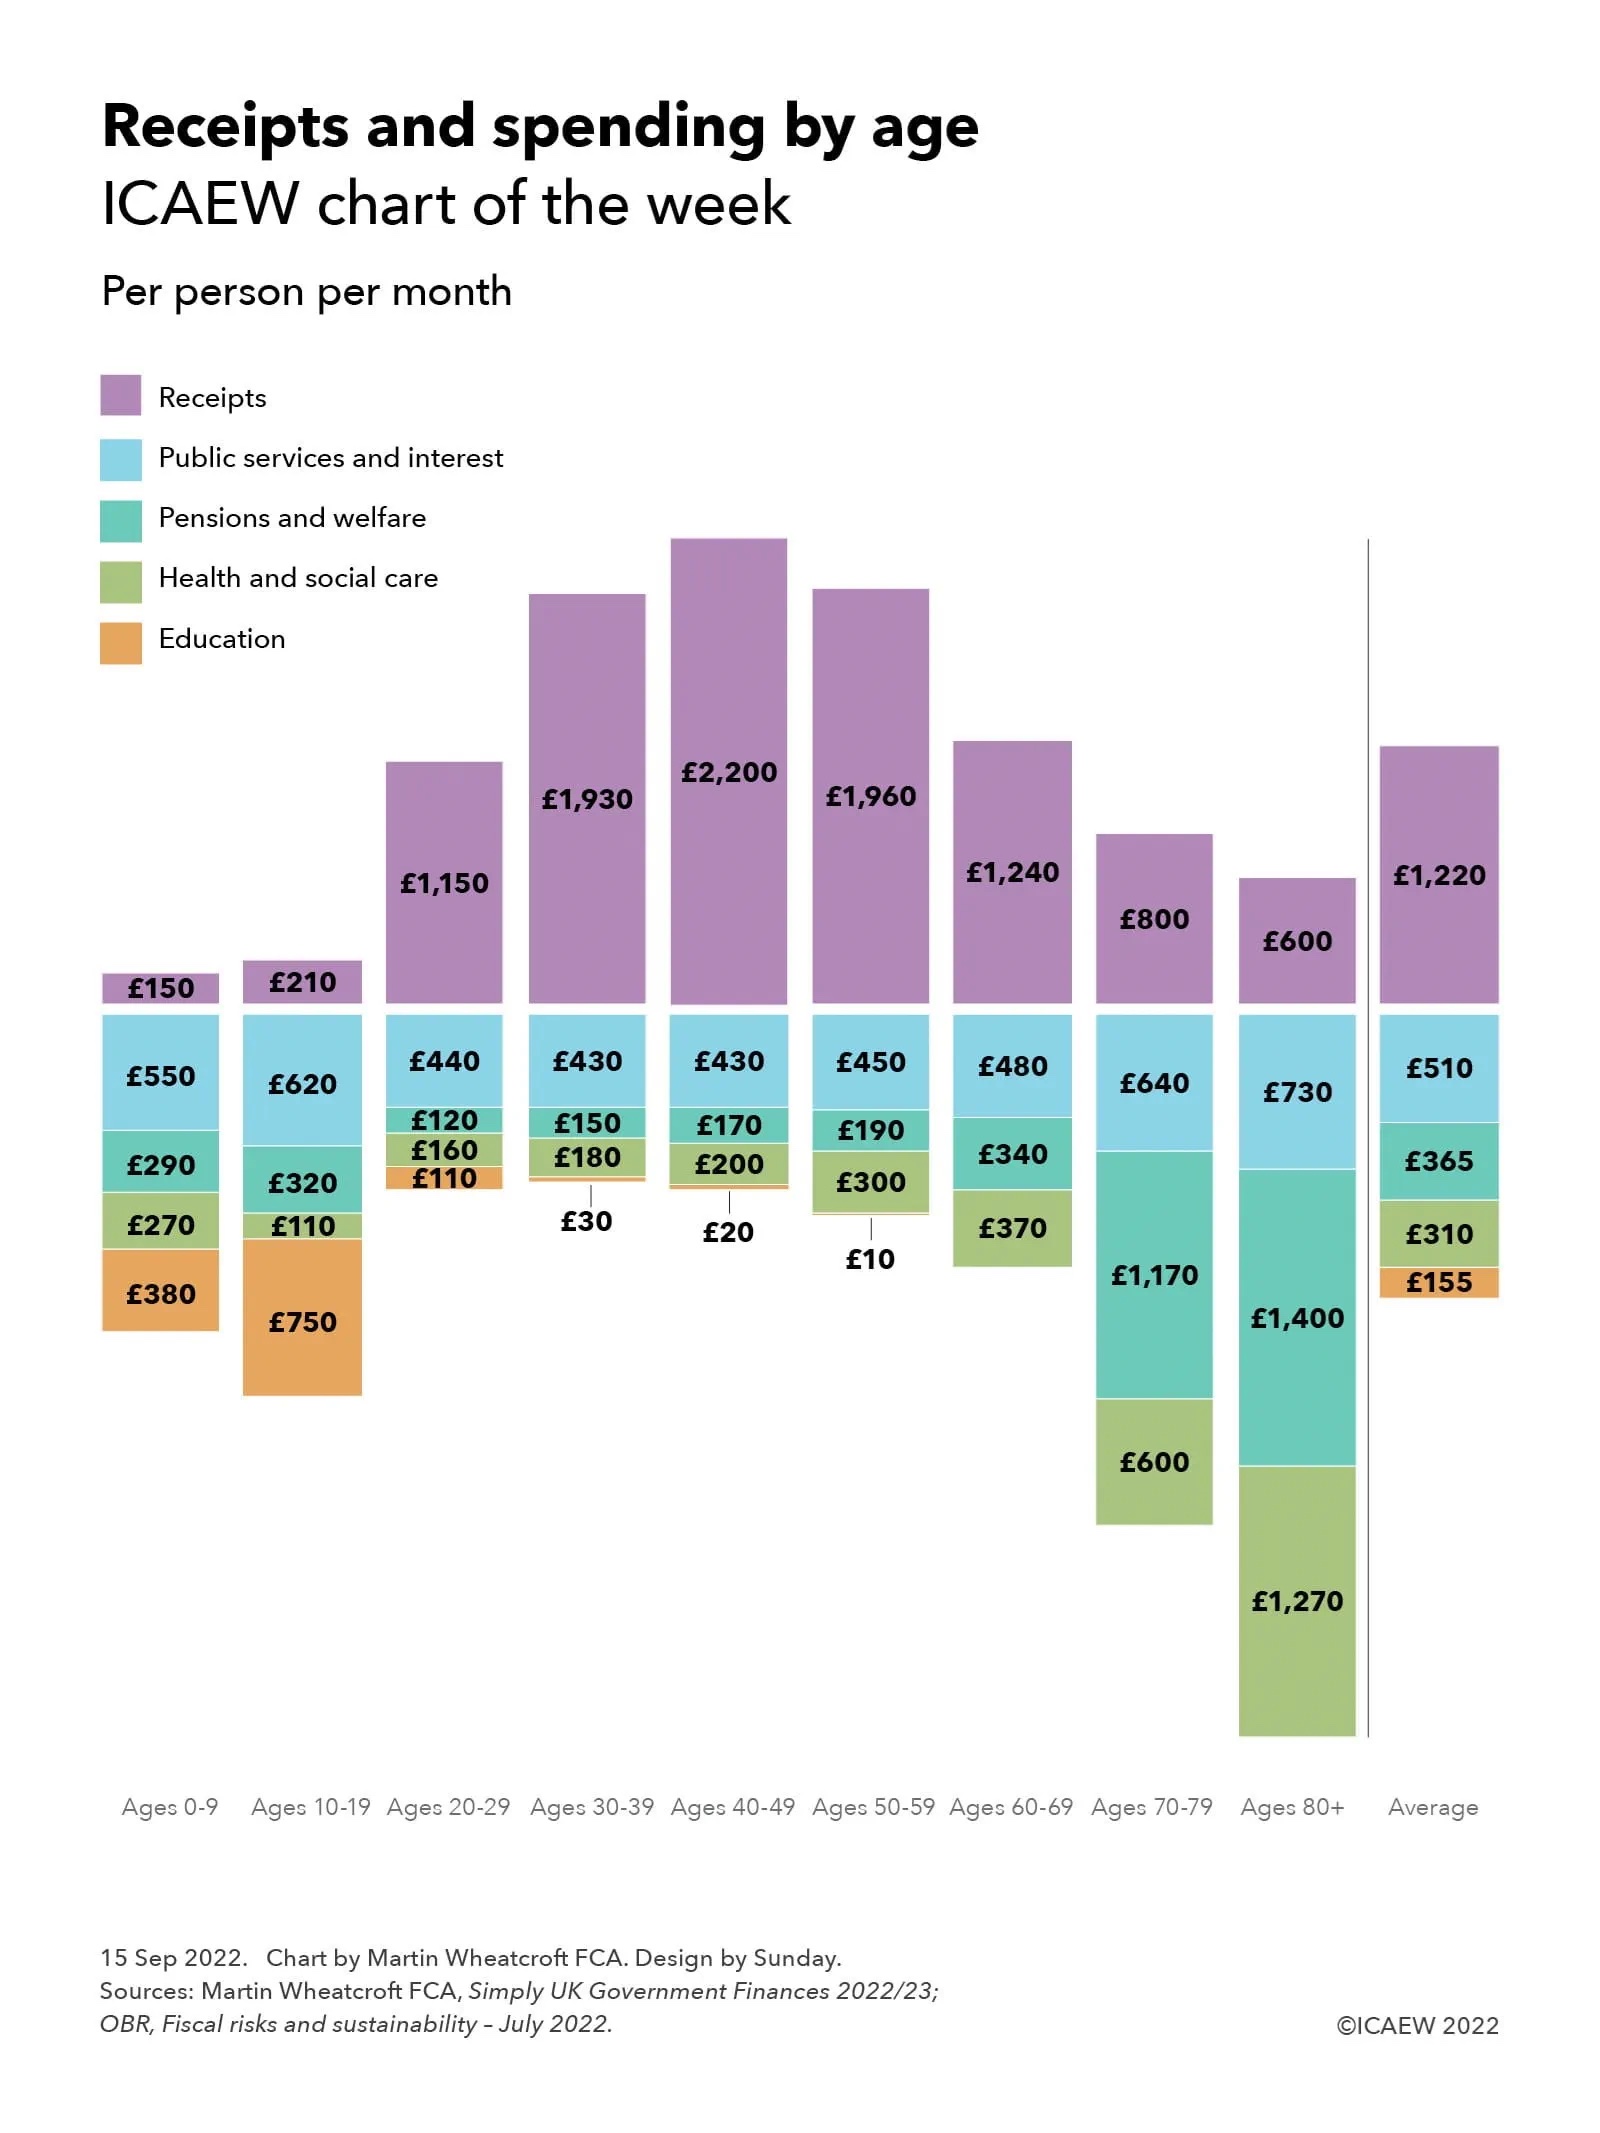
Column chart - showing receipts by age group per person per month above the line and spending below the line.

0-9: £150 (receipts) - £550 (public services and interest), £290, (pensions and welfare), £270 (health and social care), £380 (education)

10-19: £210 - £620, £320, £110, £750

20-29: £1,150 - £440, £120, £160, £110

30-39: £1,930 - £430, £150, £180, £30

40-49: £2,200 - £430, £170, £200, £20

50-59: £1,960 - £450, £190, £300, £10

60-69: £1,240 - £480, £340, £370, -

70-79: £800 - £640, £1,170, £600, -

80+: £600 - £730, £1,400 - £1,270

Average: £1,220 - £510, £365, £310, £155

Kwasi Kwarteng’s first Budget will be an emergency one, not only setting out his plans for the financial year commencing on 1 April 2023, but also re-opening the budget for the current financial year. It will be dominated by the emergency support package for individuals and businesses already announced, alongside starting to deliver on Prime Minister Liz Truss’s commitments to cut taxes and ‘shrink the state’.

The new Chancellor is likely to find that cutting public spending is not going to be easy given the increasing financial commitments made by successive governments since the Second World War on education, pensions, health and social care, the areas that now dominate public spending. He supported adding to those commitments only a couple of years ago when then Prime Minister Boris Johnson decided to expand eligibility for social care, and former Chancellor Rishi Sunak re-committed to the ‘triple-lock’ that guarantees increases in the state pension every year.

As our chart this week illustrates, receipts and spending vary significantly across age groups, with spending on education higher on the young, who pay very little in taxes, and spending on pensions, health and social care much higher for older generations who contribute less than the average, especially after reaching retirement age. This contrasts with the profile for those of working age who pay the most into the system while on average taking the least out.

Derived from an analysis from the Office for Budget Responsibility’s fiscal risks and sustainability report published in July, the chart shows how – before the emergency Budget scheduled for 21 September – budgeted tax and other receipts for the current financial year 2022/23 are equivalent to £1,220 per person per month, based on forecast receipts of £988bn and a population of 67.5m. This is below budgeted public spending of £1,340 per person per month (£1,087bn/67.5m people/12 months), with the deficit of £120 per person per month (£99bn in total) funded by borrowing.

Average receipts per person per month by age group are estimated to be in the order of £150, £210, £1,150, £1,930, £2,200, £1,960, £1,240, £800 respectively for those aged 0-9, 10-19, 20-29, 30-39, 40-49, 50-59, 60-69, 70-79 and 80+ respectively. These numbers include £115 per person per month of non-tax receipts spread evenly across everyone. 

Spending on public services and interest in the order of £510 per person per month, or £550, £620, £440, £430, £430, £450, £480, £640, £730 by age group, is less variable across age groups because it much of this spending is incurred on behalf of everyone, including £125 in interest, £73 on defence and security and £53 on policing, justice and safety for example.

Spending on pensions and welfare of £365 per person per month is less evenly spread, with £290 and £320 per month spent on those in their first two decades and £440, £430, £430 and £450 on those in their twenties, thirties, forties and fifties respectively. This increases to average spending per person per month of £480, £640 and £730 on those in their sixties, seventies and eighties or over. 

Health and social care spending of £310 is biased towards older generations, with per person per month spending of £270, £110, £160, £180 and £200 for the first five decades of life contrasting with the £300, £370, £600 and £1,270 spent on average on those in their fifties, sixties, seventies and eighties or over. 

As you would expect, education spending of £155 per person per month on average is mostly spent on the young, with around £380 per person per month spent on the under-10s, £750 spent on those between 10 and 19, £110 spent on those in their twenties, and £30, £20 and £10 respectively spent on those in their thirties, forties and fifties.

The reason this chart is so critical is because demographics are not in a steady state, with the ONS projecting that there will be an additional 3.3m pensioners in 20 years’ time, a 27% increase. This will have significant cost implications for this and future governments over a period when the working-age population – who pay most of the taxes to fund public spending – is projected to grow by just 4% in total. 

While a declining birth rate might relieve some of the pressure on education spending over the next 20 years, spending on the state pension, the NHS and on social care will grow significantly if the commitments made by the current and previous governments to provide for income in retirement, universal free health care and an increasing level of social care provision are to be met, at the same time as running public services to the standard required.

Kwasi Kwarteng’s predecessors have been able to cover the expanding share of public spending going on pensions and health and social care without raising taxes above 40% of the economy by cutting spending on public services, in particular the defence budget, which has declined from in the order of 10% of GDP to around 2% over the last half century. However, with defence already at the NATO minimum, and many public services under significant pressure to improve delivery, there is much less scope to find savings than there has been in the past.

This poses a very big challenge for the Chancellor as he puts together his medium-term fiscal plans. Economic growth needs to be much higher than it has been in recent years, not only to cover the cost of tax cuts that he hopes will generate that growth, but also to generate the extra tax receipts needed to fund pensions and health and social care as more people live longer lives.

This chart was originally published by ICAEW.