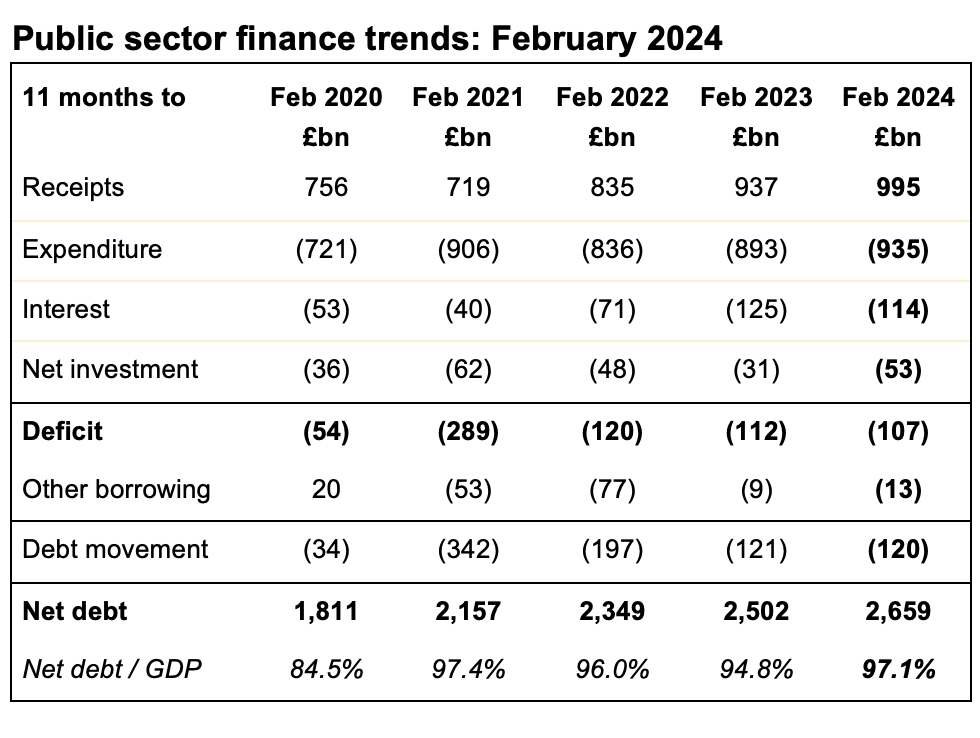
Only a small improvement in the year-to-date deficit of £107bn reported in the penultimate monthly public finance release for 2023/24 over the same period a year ago.
The monthly public sector finances for February 2024 released by the Office for National Statistics (ONS) on Thursday 21 March 2024 reported a provisional deficit for the month of £8bn, while at the same time revising the year-to-date deficit up by £2bn. This increased the cumulative deficit for the first 11 months of the financial year to £107bn, £5bn less than in the same period last year.
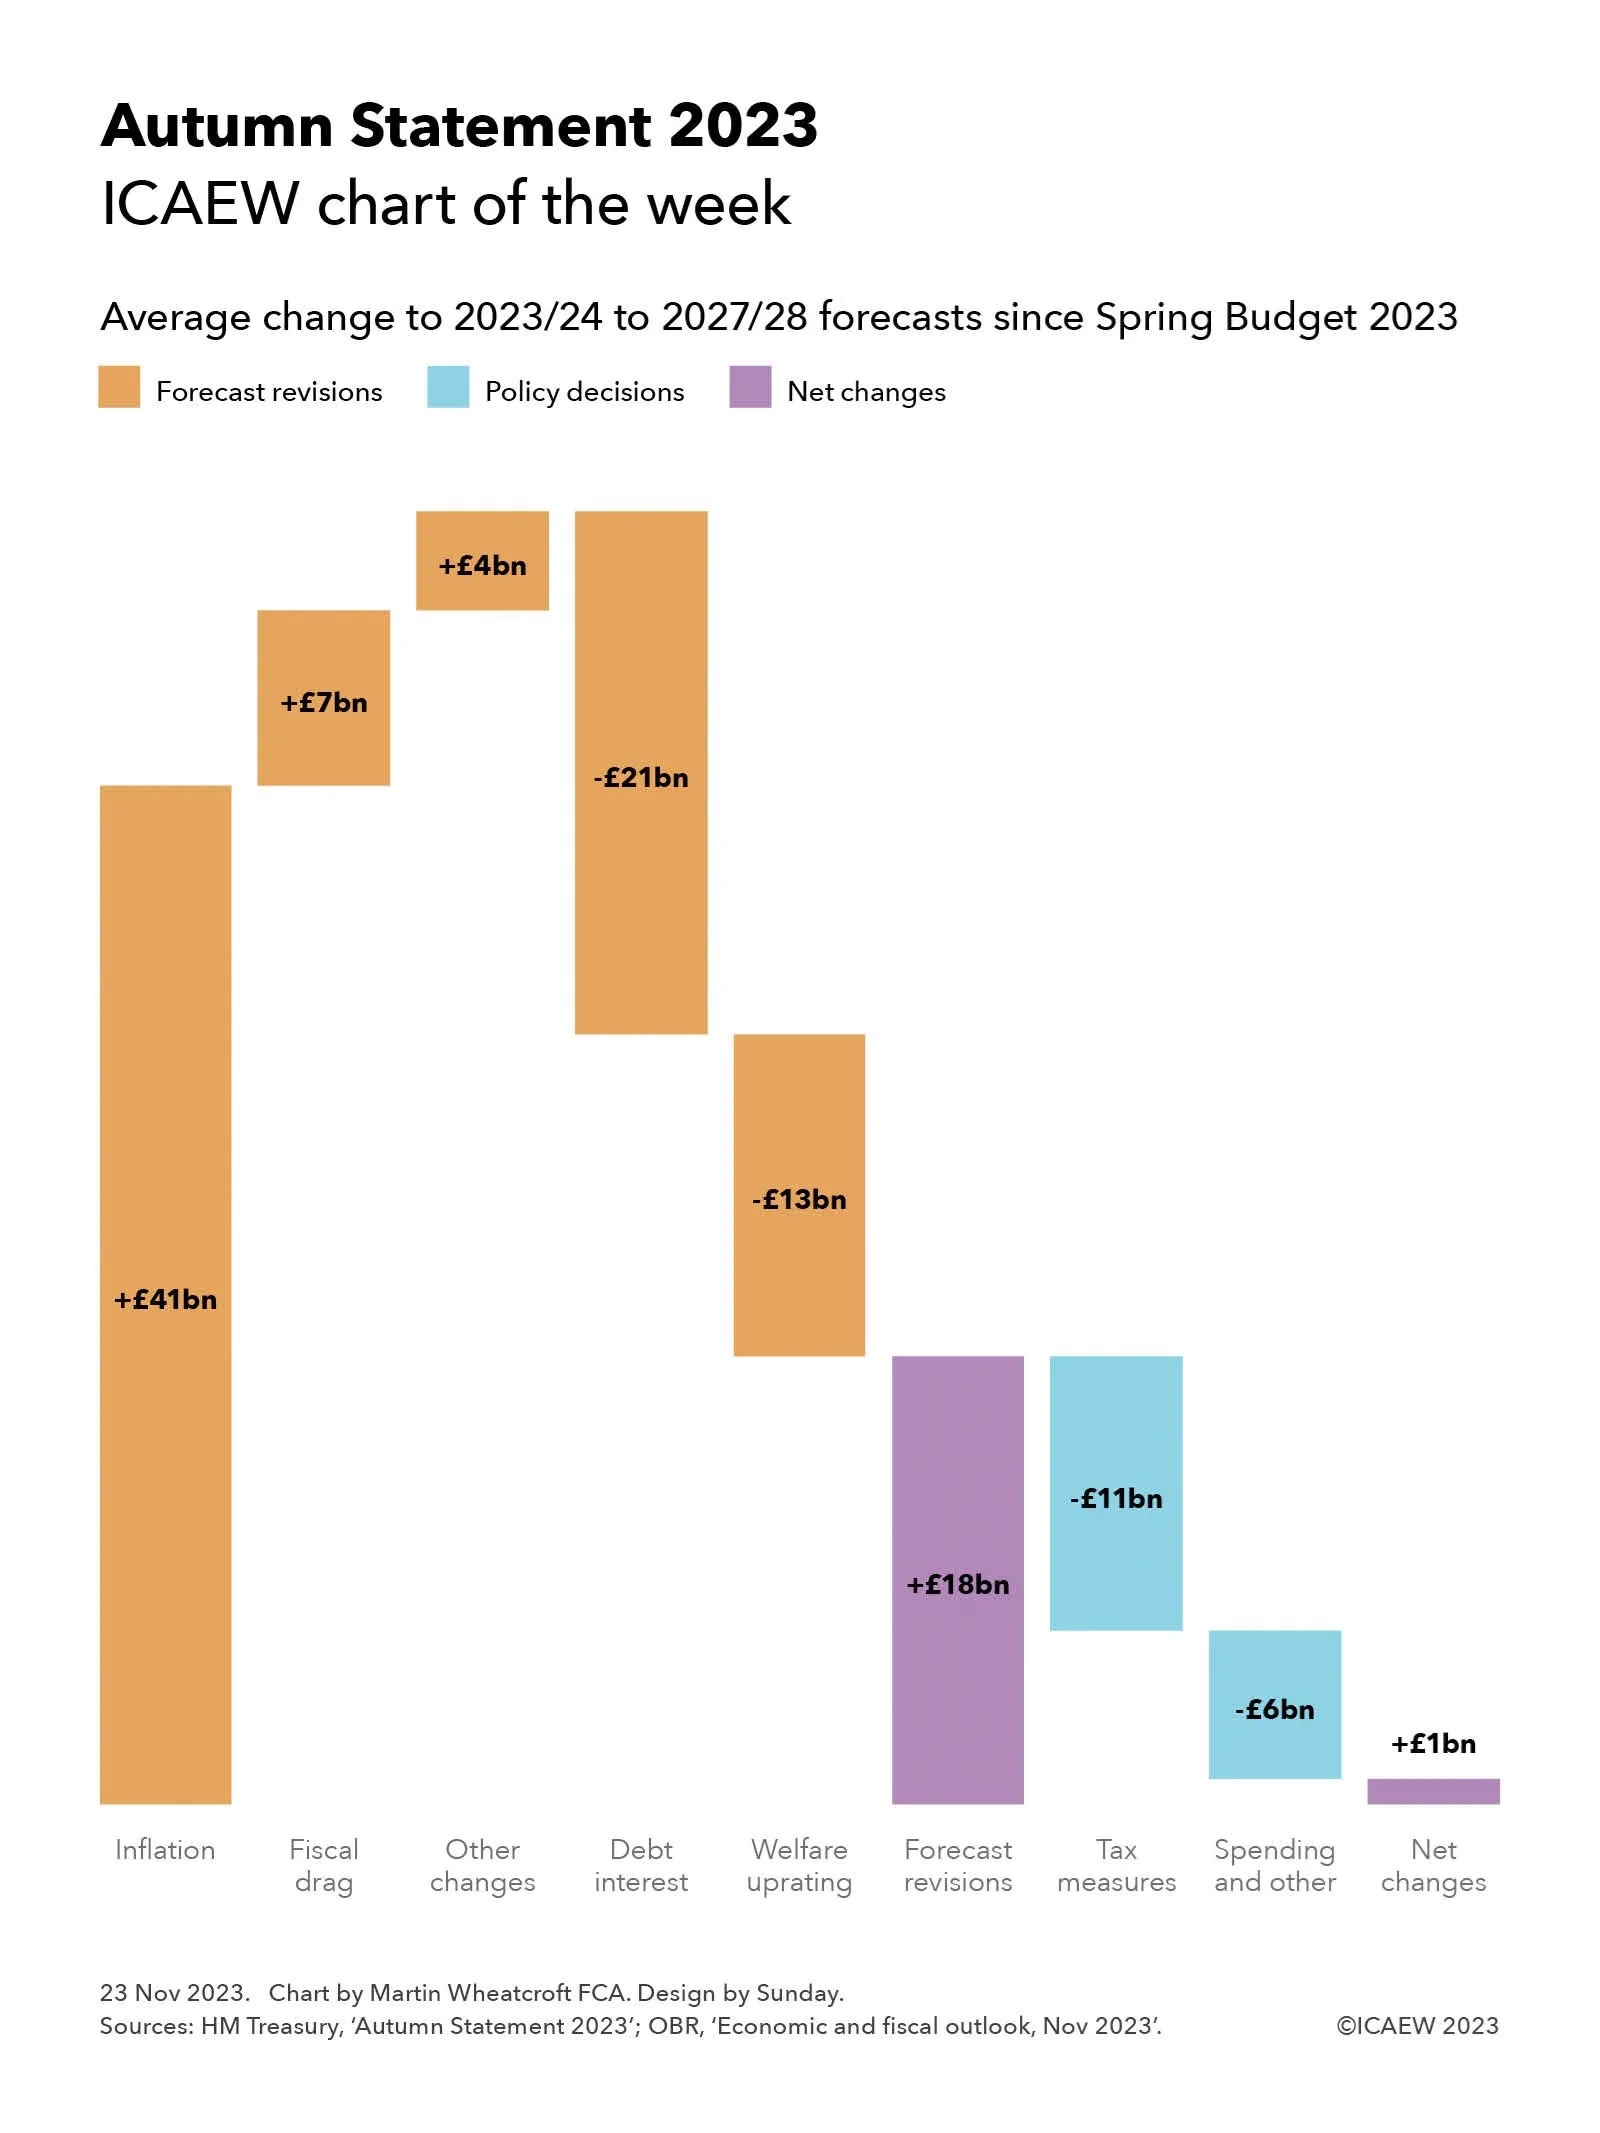
The deficit for the first 11 months of 2023/24 is slightly ahead of the £114bn full-year estimate made by the Office for Budget Responsibility (OBR) in its latest fiscal forecasts that accompanied the Spring Budget 2024 earlier this month.
Alison Ring OBE FCA, ICAEW Director of Public Sector and Taxation, said: “The numbers for February saw the public finances return to deficit following January’s self-assessment-driven surplus, bringing the cumulative deficit to £107bn for the first 11 months of the financial year. This is a £5bn improvement on the same period last year, with lower cost of living support payments and lower interest on index-linked debt as inflation has fallen, but it is still higher than is comfortable.
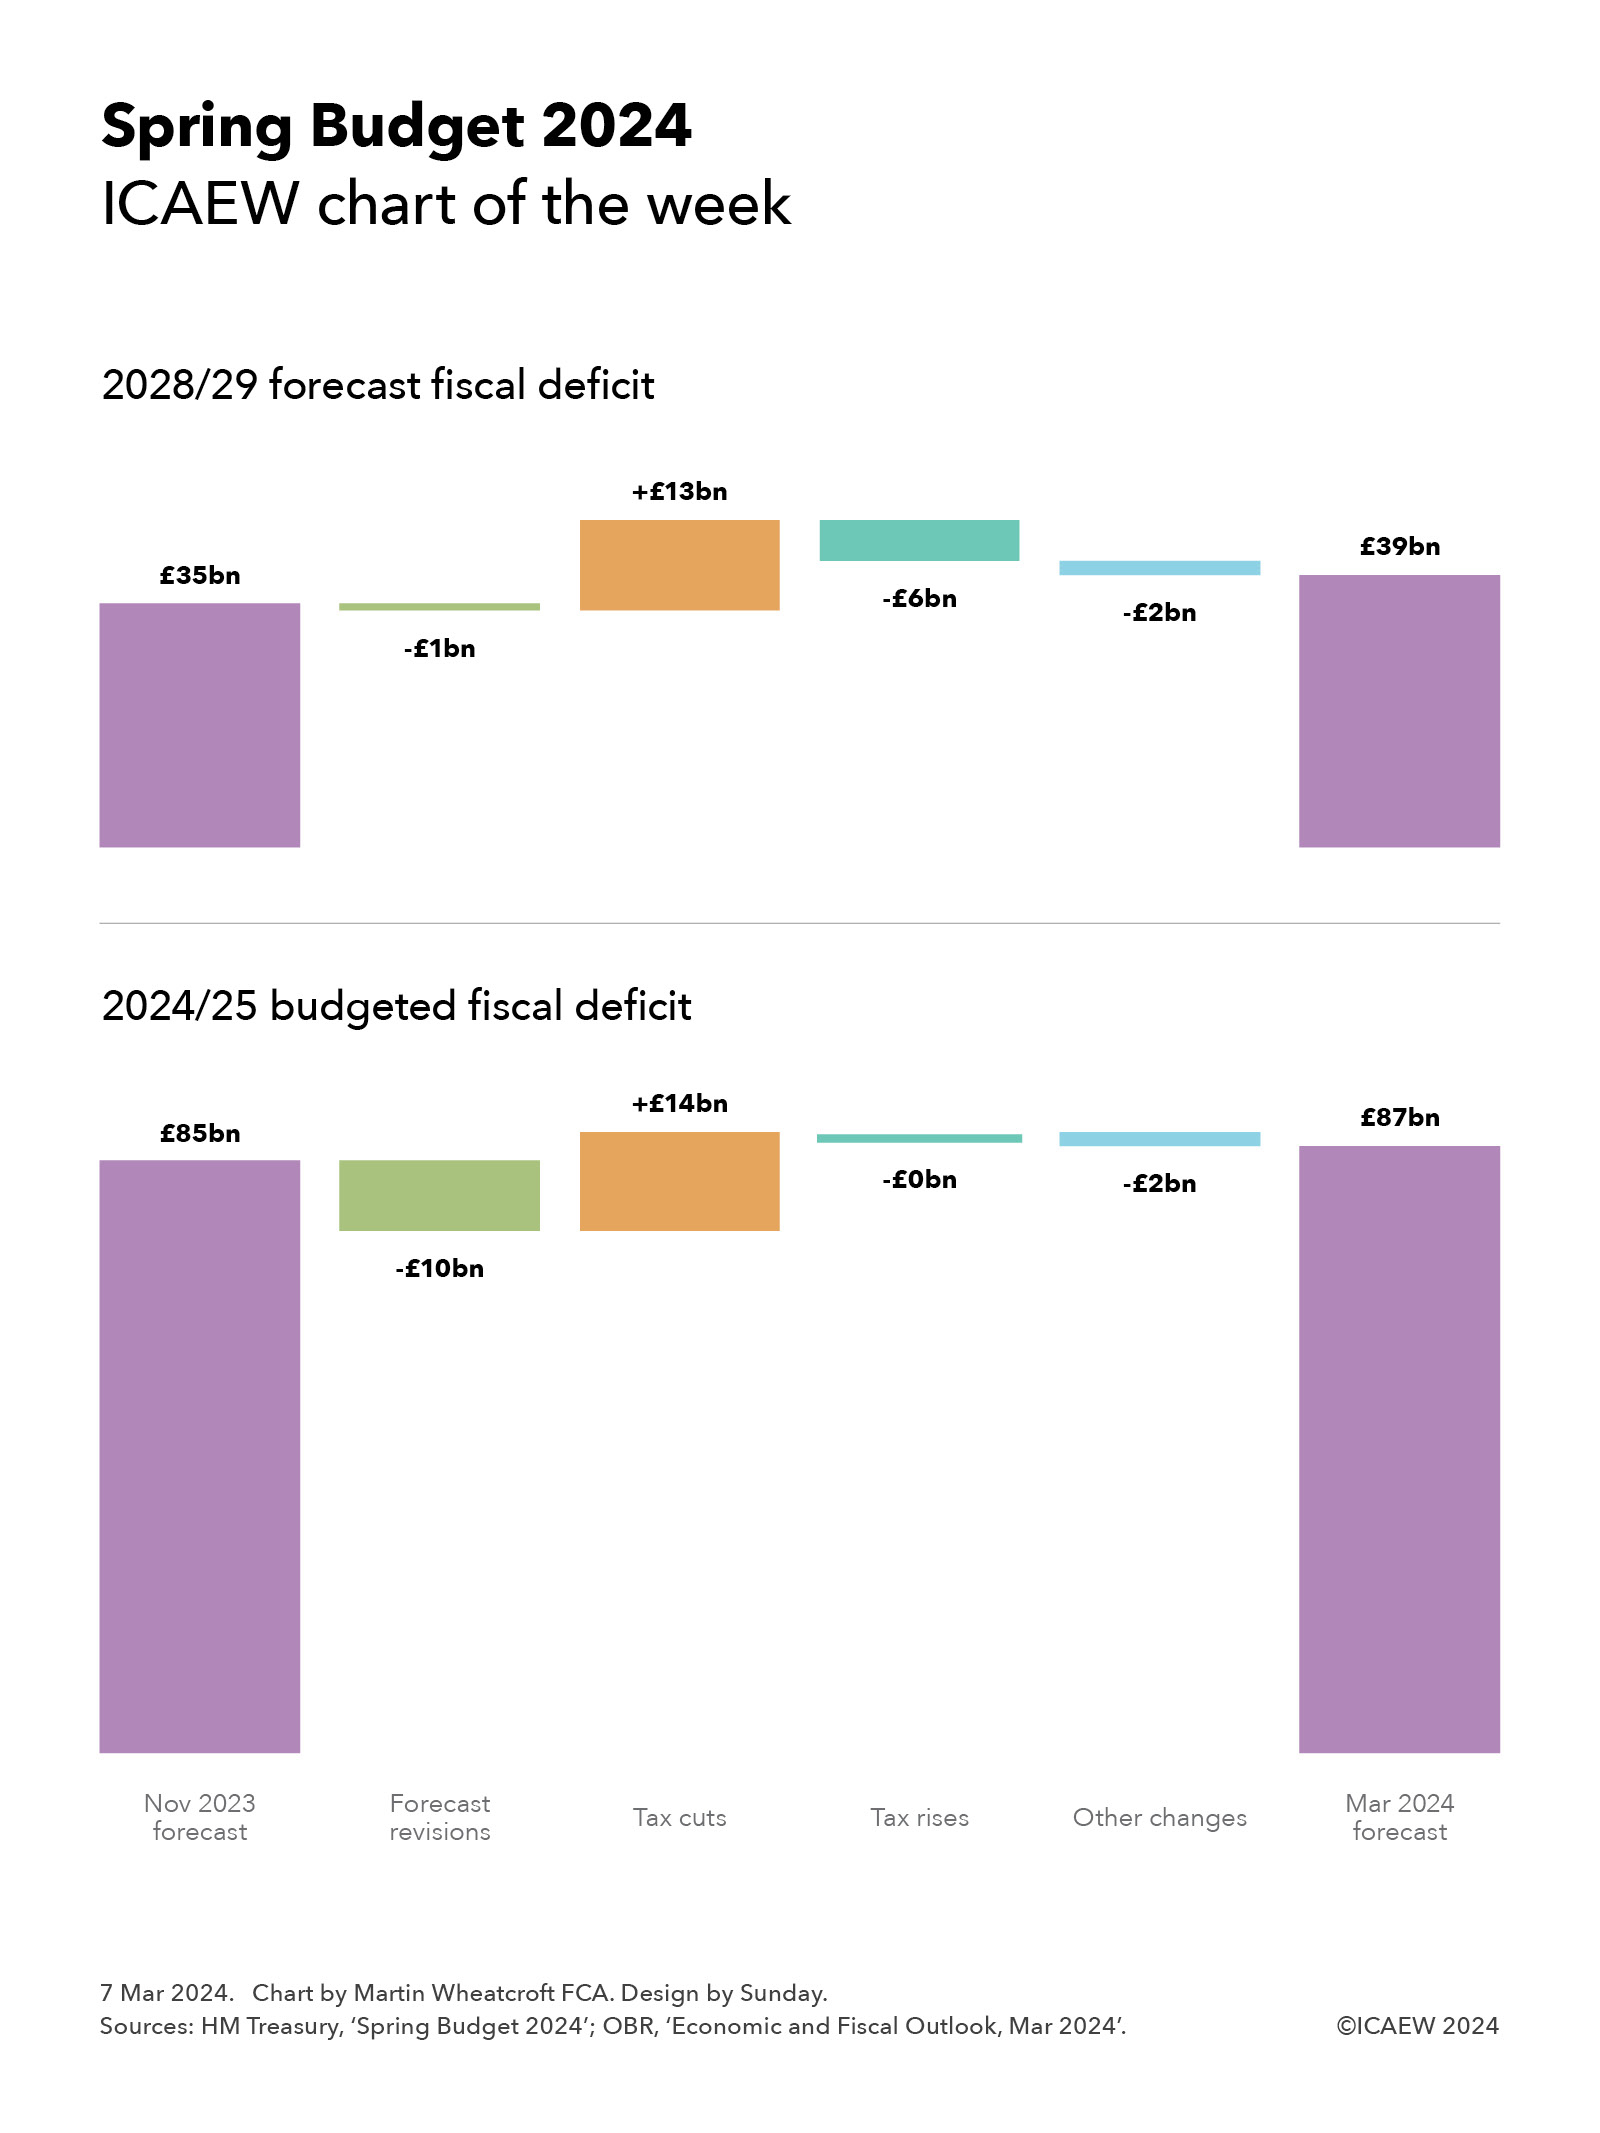
“Chancellor Jeremy Hunt’s aim to cut the deficit by a quarter to £87bn in the coming financial year will be challenging to achieve given much-higher-than-inflation rises to the state pension, benefits and the minimum wage, while pressure to find extra money for defence, local government and public services is only likely to grow as the general election approaches.”
Month of February 2024
The fiscal deficit of £8bn for the month was £3bn lower than in February 2023, but slightly higher than some predictions.
Taxes and other receipts amounted to £95bn, up 8% compared with the same month last year, while total managed expenditure was 4% higher at £103bn.
Public sector net debt as of 31 January 2024 was £2,659bn or 97.1% of GDP, £12bn higher than at the start of the month and £120bn higher than at the start of the financial year.
Eleven months to February 2024
The provisional shortfall in taxes and other receipts compared with total managed expenditure for the first 11 months of the 2023/24 financial year to February 2024 was £107bn, £5bn less than the amount reported for the first 11 months of 2022/23.
This reflected a year-to-date shortfall between tax and other receipts of £995bn and total managed expenditure of £1,102bn, each up 6% compared with the corresponding numbers for April 2022 to February 2023.
Inflation benefited tax receipts for the first 11 months compared with the same period in the previous year, with income tax up 11% to £249bn and VAT up 6% to £181bn. Corporation tax receipts were up 18% to £93bn, partly reflecting the increase in the corporation tax rate from 19% to 25% from 1 April 2023, while national insurance receipts were up by just 1% to £163bn as the abolition of the short-lived health and social care levy in 2022/23 offset the effect of wage increases in the current financial year, in addition to the cut in employee national insurance implemented in January. Council tax receipts were up 6% to £39bn, but stamp duty on properties was down by 24% to £12bn, while the total for all other taxes was up by just 1% at £153bn as economic activity slowed. Non-tax receipts were up 10% to £105bn, primarily driven by higher investment income and higher interest charged on student loans.
Total managed expenditure of £1,102bn in the 11 months to February 2024 can be analysed between current expenditure excluding interest of £935bn, interest of £114bn and net investment of £53bn, compared with £1,049bn in the same period in the previous year, comprising £893bn, £125bn and £31bn respectively.
The increase of £42bn or 5% in current expenditure excluding interest was driven by a £33bn increase in pension and other welfare benefits (including cost-of-living payments), £19bn in higher central government pay, and £11bn in additional central government procurement spending, less £18bn in lower subsidy payments (principally relating to energy support schemes) and £3bn in net other changes.
The fall in interest costs for the 11 months of £11bn or 9% to £114bn comprises a £23bn or 46% reduction to £27bn for interest accrued on index-linked debt as the rate of inflation fell, partially offset by a £12bn or 16% increase to £87bn from higher interest rates on variable-rate debt and new and refinanced fixed-rate debt.
The £22bn increase in net investment spending to £53bn in the first 11 months of the current financial year is distorted by a one-off credit of £10bn arising from changes in interest rates and repayment terms of student loans recorded in December 2022. Adjusting for that credit, the increase of £12bn reflects high construction cost inflation amongst other factors that saw a £16bn or 17% increase in gross investment to £112bn, less a £4bn or 7% increase in depreciation to £59bn.
The cumulative deficit of £107bn for the first 11 months of the financial year is £5bn below the OBR’s November 2023 forecast of £112bn for the same period but slightly higher than it should be to be consistent with the updated £114bn full year estimate for 2023/24 in its March 2024 forecast.
The OBR’s March 2024 forecast predicts an £87bn deficit in the next financial year commencing in April (2024/25) a reduction of approximately a quarter compared with the current financial year.
Balance sheet metrics
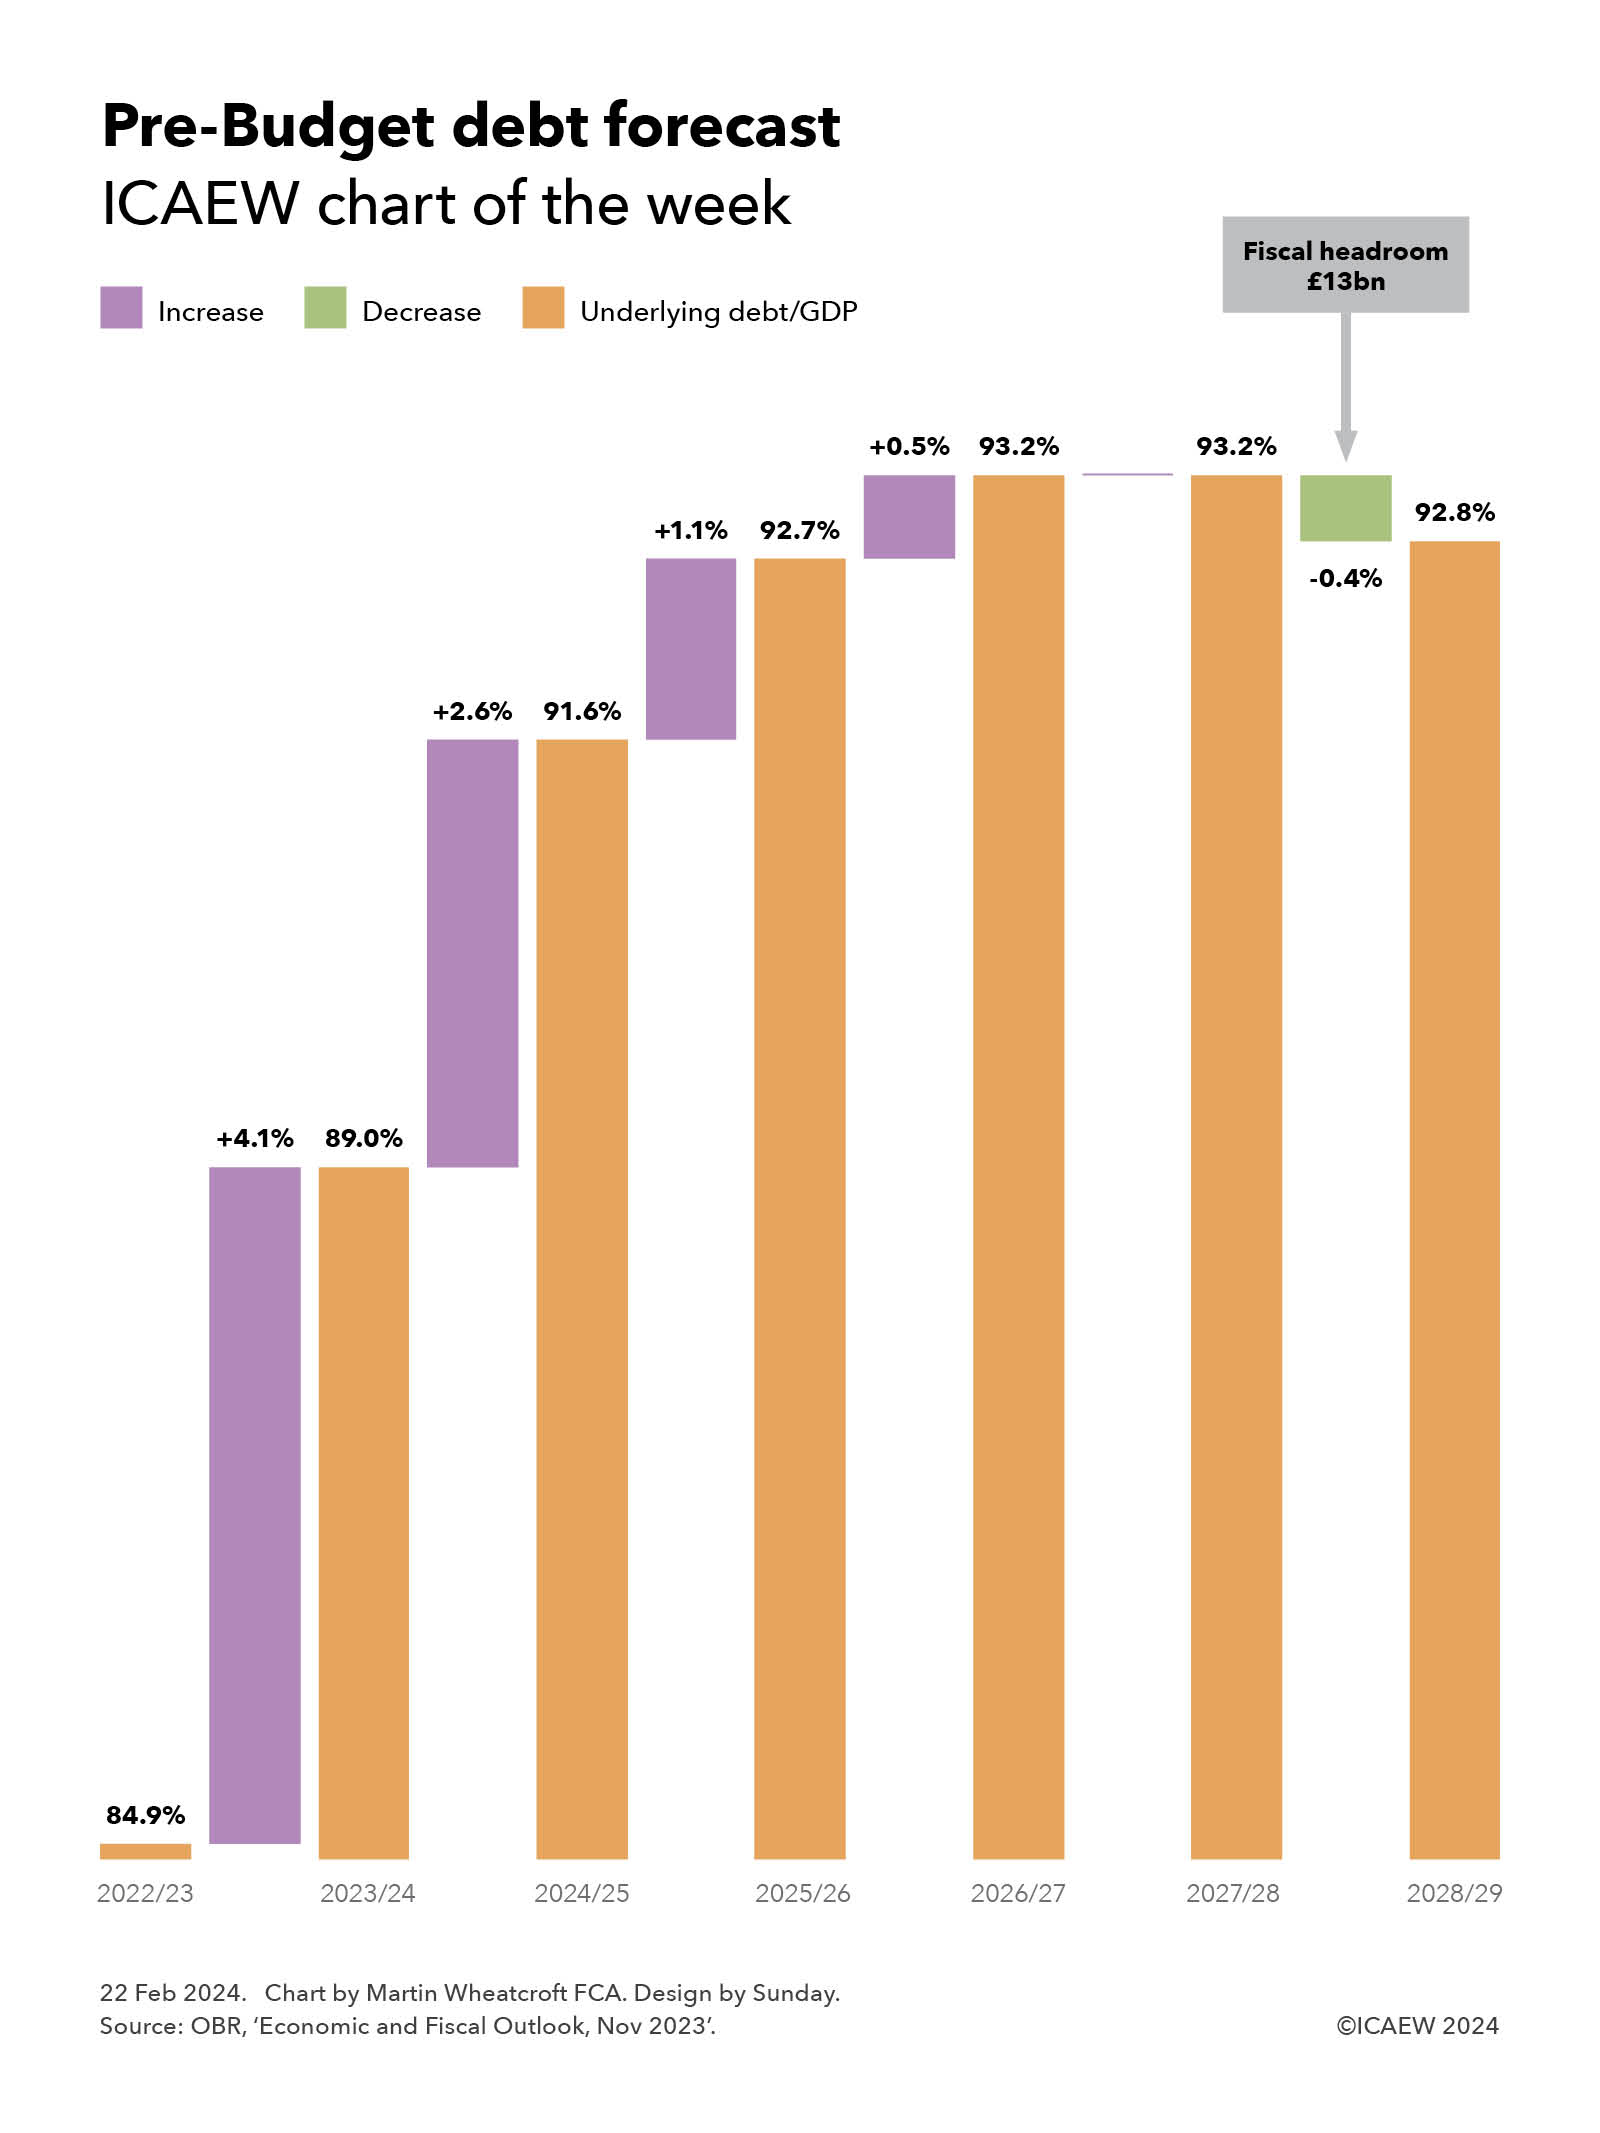
Public sector net debt was £2,659bn at the end of February 2024, equivalent to 97.1% of GDP.
This is an increase since the start of the financial year of £120bn, comprising borrowing to fund the deficit for the 11 months of £107bn plus an additional £13bn of borrowing to fund lending to students, businesses and others, net of loan repayments and working capital movements.
Public sector net debt is £844bn more than the £1,815bn reported for 31 March 2020 at the start of the pandemic and £2,124bn more than the £535bn number as of 31 March 2007 before the financial crisis, reflecting the huge sums borrowed over the last couple of decades.
Public sector net worth, the new balance sheet metric launched by the ONS this year, was -£668bn on 29 February 2024, comprising £1,596bn in non-financial assets and £1,062bn in non-liquid financial assets minus £2,659bn of net debt (£319bn liquid financial assets – £2,977bn public sector gross debt) and other liabilities of £667bn. This is a £65bn deterioration from the -£613bn reported for 31 March 2023.
Revisions
Caution is needed with respect to the numbers published by the ONS, which are expected to be repeatedly revised as estimates are refined and gaps in the underlying data are filled.
The latest release saw the ONS revise the reported deficit for the 10 months to January 2024 up by £2bn as estimates of tax receipts and expenditure were updated for better data, as well as revise the calculation of the public sector net debt to GDP ratio at 31 January 2024 from 96.5% to 96.8% as GDP estimates were updated in line with the latest OBR forecasts.
The ONS also revised its estimate for the deficit for the financial year to March 2023 (2022/23), down by £1bn to £128bn.

![Table with fiscal numbers for the ten months to Jan 2020, Jan 2021, Jan 2022, Jan 2023 and Jan 2024, all in £bn.
Receipts: 685 | 647 | 754 | 849 | 901
Expenditure: (588) | (746) | (686) | (722) | (761)
Interest: (44) | (33) | (55) | (103) | (97)
Net investment: (26) | (51) | (35) | (16) | (37)
[subtotal] Deficit: (61) | (270) | (123) | (108) | (119)
Other borrowing: 3 | (67) | (85) | (8) | (27)
[total] Debt movement: (58) | (337) | (208) | (116) | (146)
Net debt: 1,835 | 2,152 | 2,360 | 2,497 | 2,686
Net debt / GDP: 84.8% | 98.7% | 97.9% | 95.8% | 97.7%](https://martinwheatcroft.com/wp-content/uploads/2024/02/Public-sector-finance-trends-2024-01.jpg)
![Table showing fiscal numbers for the nine months to Dec 2019, 2020, 2021, 2022 and 2023.
Receipts: 597 | 560 | 653 | 733 | 776
Expenditure: (588) | (746) | (686) | (722) | (761)
Interest: (44) | (33) | (55) | (103) | (97)
Net investment: (26) | (51) | (35) | (16) | (37)
[subtotal] Deficit: (61) | (270) | (123) | (108) | (119)
Other borrowing: 3 | (67) | (85) | (8) | (27)
[total] Debt movement: (58) | (337) | (208) | (116) | (146)
Net debt: 1,835 | 2,152 | 2,360 | 2,497 | 2,686
Net debt / GDP: 84.8% | 98.7% | 97.9% | 95.8% | 97.7%](https://martinwheatcroft.com/wp-content/uploads/2024/02/Public-sector-finance-trends-2023-12.jpg)