Monthly public sector finances for October saw spending continue to exceed receipts by a large margin, even if by less than was predicted earlier in the year.
The Office for National Statistics (ONS) released the month public sector finances for October on Tuesday 21 November 2023. It reported a provisional deficit for the month of October of £15bn, bringing the cumulative deficit for the first seven months of the year to £98bn, £22bn more than in the same period last year.
Alison Ring OBE FCA, Public Sector and Taxation Director for ICAEW, said: “Although it is positive that the cumulative deficit to October of £98bn is less than the £115bn predicted by the OBR, cash going out continues to exceed cash coming in by a very large margin. Public sector net debt has now exceeded £2.6 trillion for the first time, which is a staggering new record.
“Tomorrow’s Autumn Statement will see the OBR revise and roll forward its forecast, giving the Chancellor so-called headroom to cut taxes or increase spending. But in reality there is no headroom when the public finances continue to be on an unsustainable path without a long-term fiscal strategy to fix them.”
Month of October 2023
The provisional shortfall in taxes and other receipts compared with total managed expenditure for the month of October 2023 was £15bn, made up of tax and other receipts of £85bn less total managed expenditure of £100bn, up 3% and 6% respectively compared with October 2022.
This was the second highest October deficit on record since monthly records began in 1993, following a monthly deficit of £18bn in October 2020 at the height of the pandemic.
Public sector net debt as of 31 October 2023 was £2,644bn or 97.8% of GDP, the first time it has exceeded £2.6trn – only eight months after it first reached £2.5trn.
Seven months to October 2023
The provisional shortfall in taxes and other receipts compared with total managed expenditure for the seven months to October 2023 was £98bn, £22bn more than the £76bn deficit reported for the first seven months of 2022/23. This reflected a widening gap between tax and other receipts for the seven months of £595bn and total managed expenditure of £693bn, up 5% and 8% respectively compared with April to October 2022.
Inflation benefited tax receipts for the first seven months compared with the first half of the previous year, with income tax up 10% to £137bn and VAT up 9% to £117bn. Corporation tax receipts were up 12% to £55bn, partly reflecting the increase in the corporation tax rate from 19% to 25% from 1 April 2023, while national insurance receipts were down by 4% to £99bn because of the abolition of the short-lived health and social care levy last year. Stamp duty on properties was down by 27% to £8bn and the total for all other taxes was up just 3% to £115bn, much less than inflation as economic activity slowed. Non-tax receipts were up 10% to £63bn, primarily driven by higher investment income.
Total managed expenditure of £693bn in the seven months to October 2023 can be analysed between current expenditure excluding interest of £587bn, up £39bn or 7% over the same period in the previous year, interest of £76bn, up £4bn or 5%, and net investment of £30bn, up £9bn or 44%.
The increase of £39bn in current expenditure excluding interest was driven by a £20bn increase in pension and other welfare (including cost-of-living payments), £12bn in higher central government pay, £6bn in additional central government procurement spending, plus £1bn in net other changes.
The rise in interest costs for the seven months of £4bn to £76bn comprises a £18bn or 53% increase to £52bn for interest not linked to inflation as the Bank of England base rate rose, mostly offset by an £14bn or 37% fall to £24bn for interest accrued on index-linked debt from lower inflation than last year.The £9bn increase in net investment spending to £30bn in the first seven months of the current year reflects high construction cost inflation amongst other factors that saw a £11bn or 17% increase in gross investment to £65bn, less a £2bn or 6% increase in depreciation to £35bn.
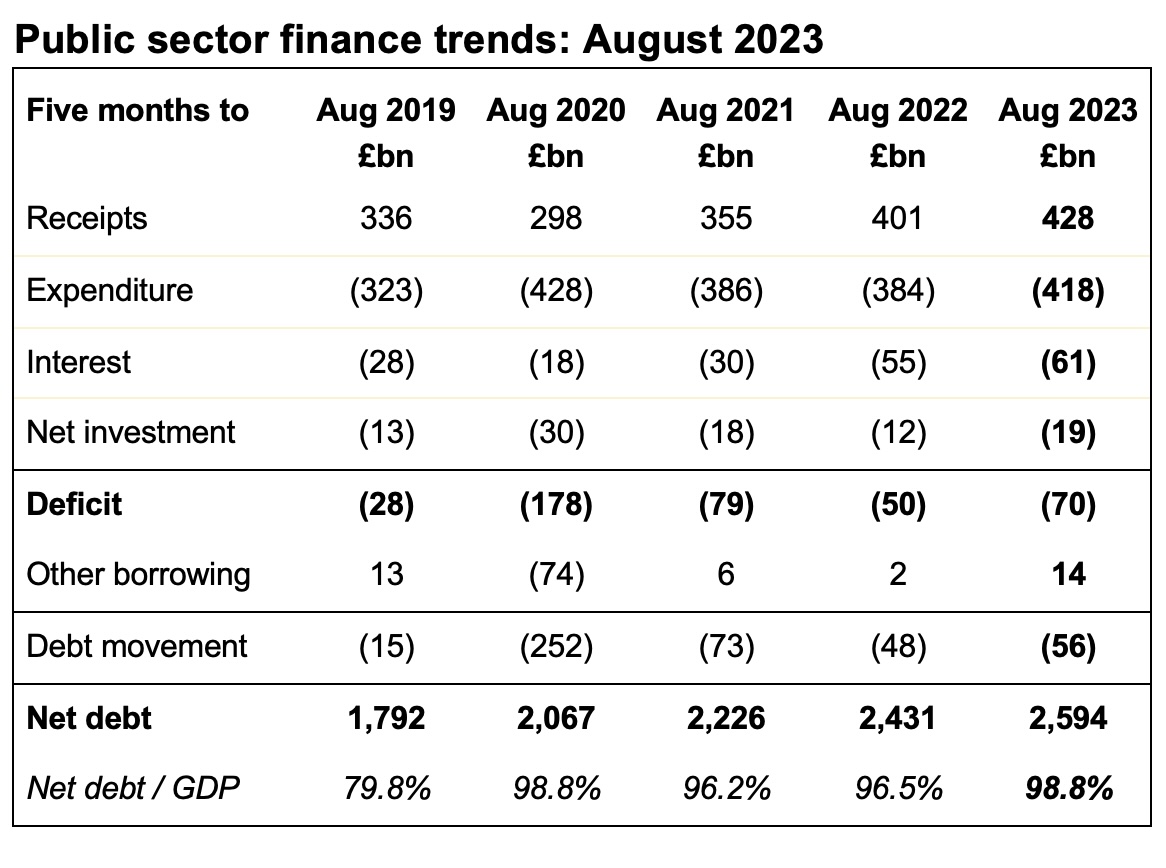
![Public sector finance trends: October 2023
Table showing receipts, expenditure, interest, net investment, deficit, other borrowing and debt movement for the seven months to October 2023 plus net debt and net debt / GDP at 31 October 2023.
Receipts: £466bn (Oct 2019), £425bn (Oct 2020), £500bn (Oct 2021), £565bn (Oct 2022), £595bn (Oct 2023)
Expenditure: (£457bn), (£582bn), (£536bn), (£548bn), (£587bn)
Interest: (£38bn), (£26bn), (£41bn), (£72bn), (£76bn)
Net investment: (£20bn), (£42bn), (£28bn), (£21bn), (£30bn)
[line above subtotal]
Deficit: (£49bn), (£225bn), (£105bn), (£76bn), (£98bn)
Other borrowing: £5bn, (£61bn), (£61bn), £5bn, (£7bn)
[line above total]
Debt movement: (£44bn), (£286bn), (£166bn), (£71bn), (£105bn)
[line below total]
Net debt: £1,821bn, £2,101bn, £2,319bn, £2,454bn, £2,644bn.
Net debt / GDP: 82.1%, 99.3%, 97.5%, 95.5%, 97.8%](https://martinwheatcroft.com/wp-content/uploads/2023/11/2023-10-Trends.jpg)
The cumulative deficit of £98bn is £17bn lower than the Office for Budget Responsibility (OBR)’s official forecast of £115bn for the first seven months of 2023/24 as compiled in March 2023. The OBR is expected to revise its forecast for the full year deficit down from £132bn in tomorrow’s Autumn Statement, but it is still on track to be more than double the £50bn projection for 2023/24 set out in the official forecast from a year earlier (March 2022).
Balance sheet metrics
Public sector net debt was £2,644bn at the end of October 2023, equivalent to 97.8% of GDP.
The debt movement since the start of the financial year was £105bn, comprising borrowing to fund the deficit for the seven months of £98bn plus £7bn in net cash outflows to fund lending to students, businesses and others net of loan repayments together with working capital movements.
Public sector net debt is £829bn more than the £1,815bn reported for 31 March 2020 at the start of the pandemic and £2,106bn more than the £538bn number as of 31 March 2007 before the financial crisis, reflecting the huge sums borrowed over the last couple of decades.
Public sector net worth, the new balance sheet metric launched by the ONS this year, was -£716bn on 31 October 2023, comprising £1,565bn in non-financial assets, £1,029bn in non-liquid financial assets, £2,644bn of net debt (£305bn in liquid financial assets less public sector gross debt of £2,949bn) and other liabilities of £666bn. This is a £102bn deterioration from the -£614bn reported for 31 March 2023.
Revisions
Caution is needed with respect to the numbers published by the ONS, which are expected to be repeatedly revised as estimates are refined and gaps in the underlying data are filled.
The latest release saw the ONS revise the reported deficit for the six months to September 2023 up by £1.7bn as estimates of tax receipts and expenditure were updated for better data, while the debt to GDP ratio at the end of September 2023 was revised down by 1.4 percentage points from 97.8% to 96.4% as a consequence of updated estimates of GDP.