Despite borrowing to fund the deficit in the first three months of the financial year of £58bn being in line with expectations, it was still the third-highest first quarter result on record.
The monthly public sector finances release for June 2025 published by the Office for National Statistics (ONS) on 22 July reported a provisional deficit of £21bn for the month of June and £58bn for the three months then ended. This is £4bn more and in line with budget respectively, and £7bn and £8bn more in each case than the first fiscal quarter a year ago.
Alison Ring OBE FCA CPFA, ICAEW Director of Public Sector and Taxation, says: “Even if borrowing to fund the deficit in the month of June was only a little higher than expected and was in line with expectations in the first three months of the financial year, the first quarter was still the third highest since monthly records began. This trajectory will not have lightened the Chancellor’s mood as she decides which taxes to put up in the Autumn Budget later this year.
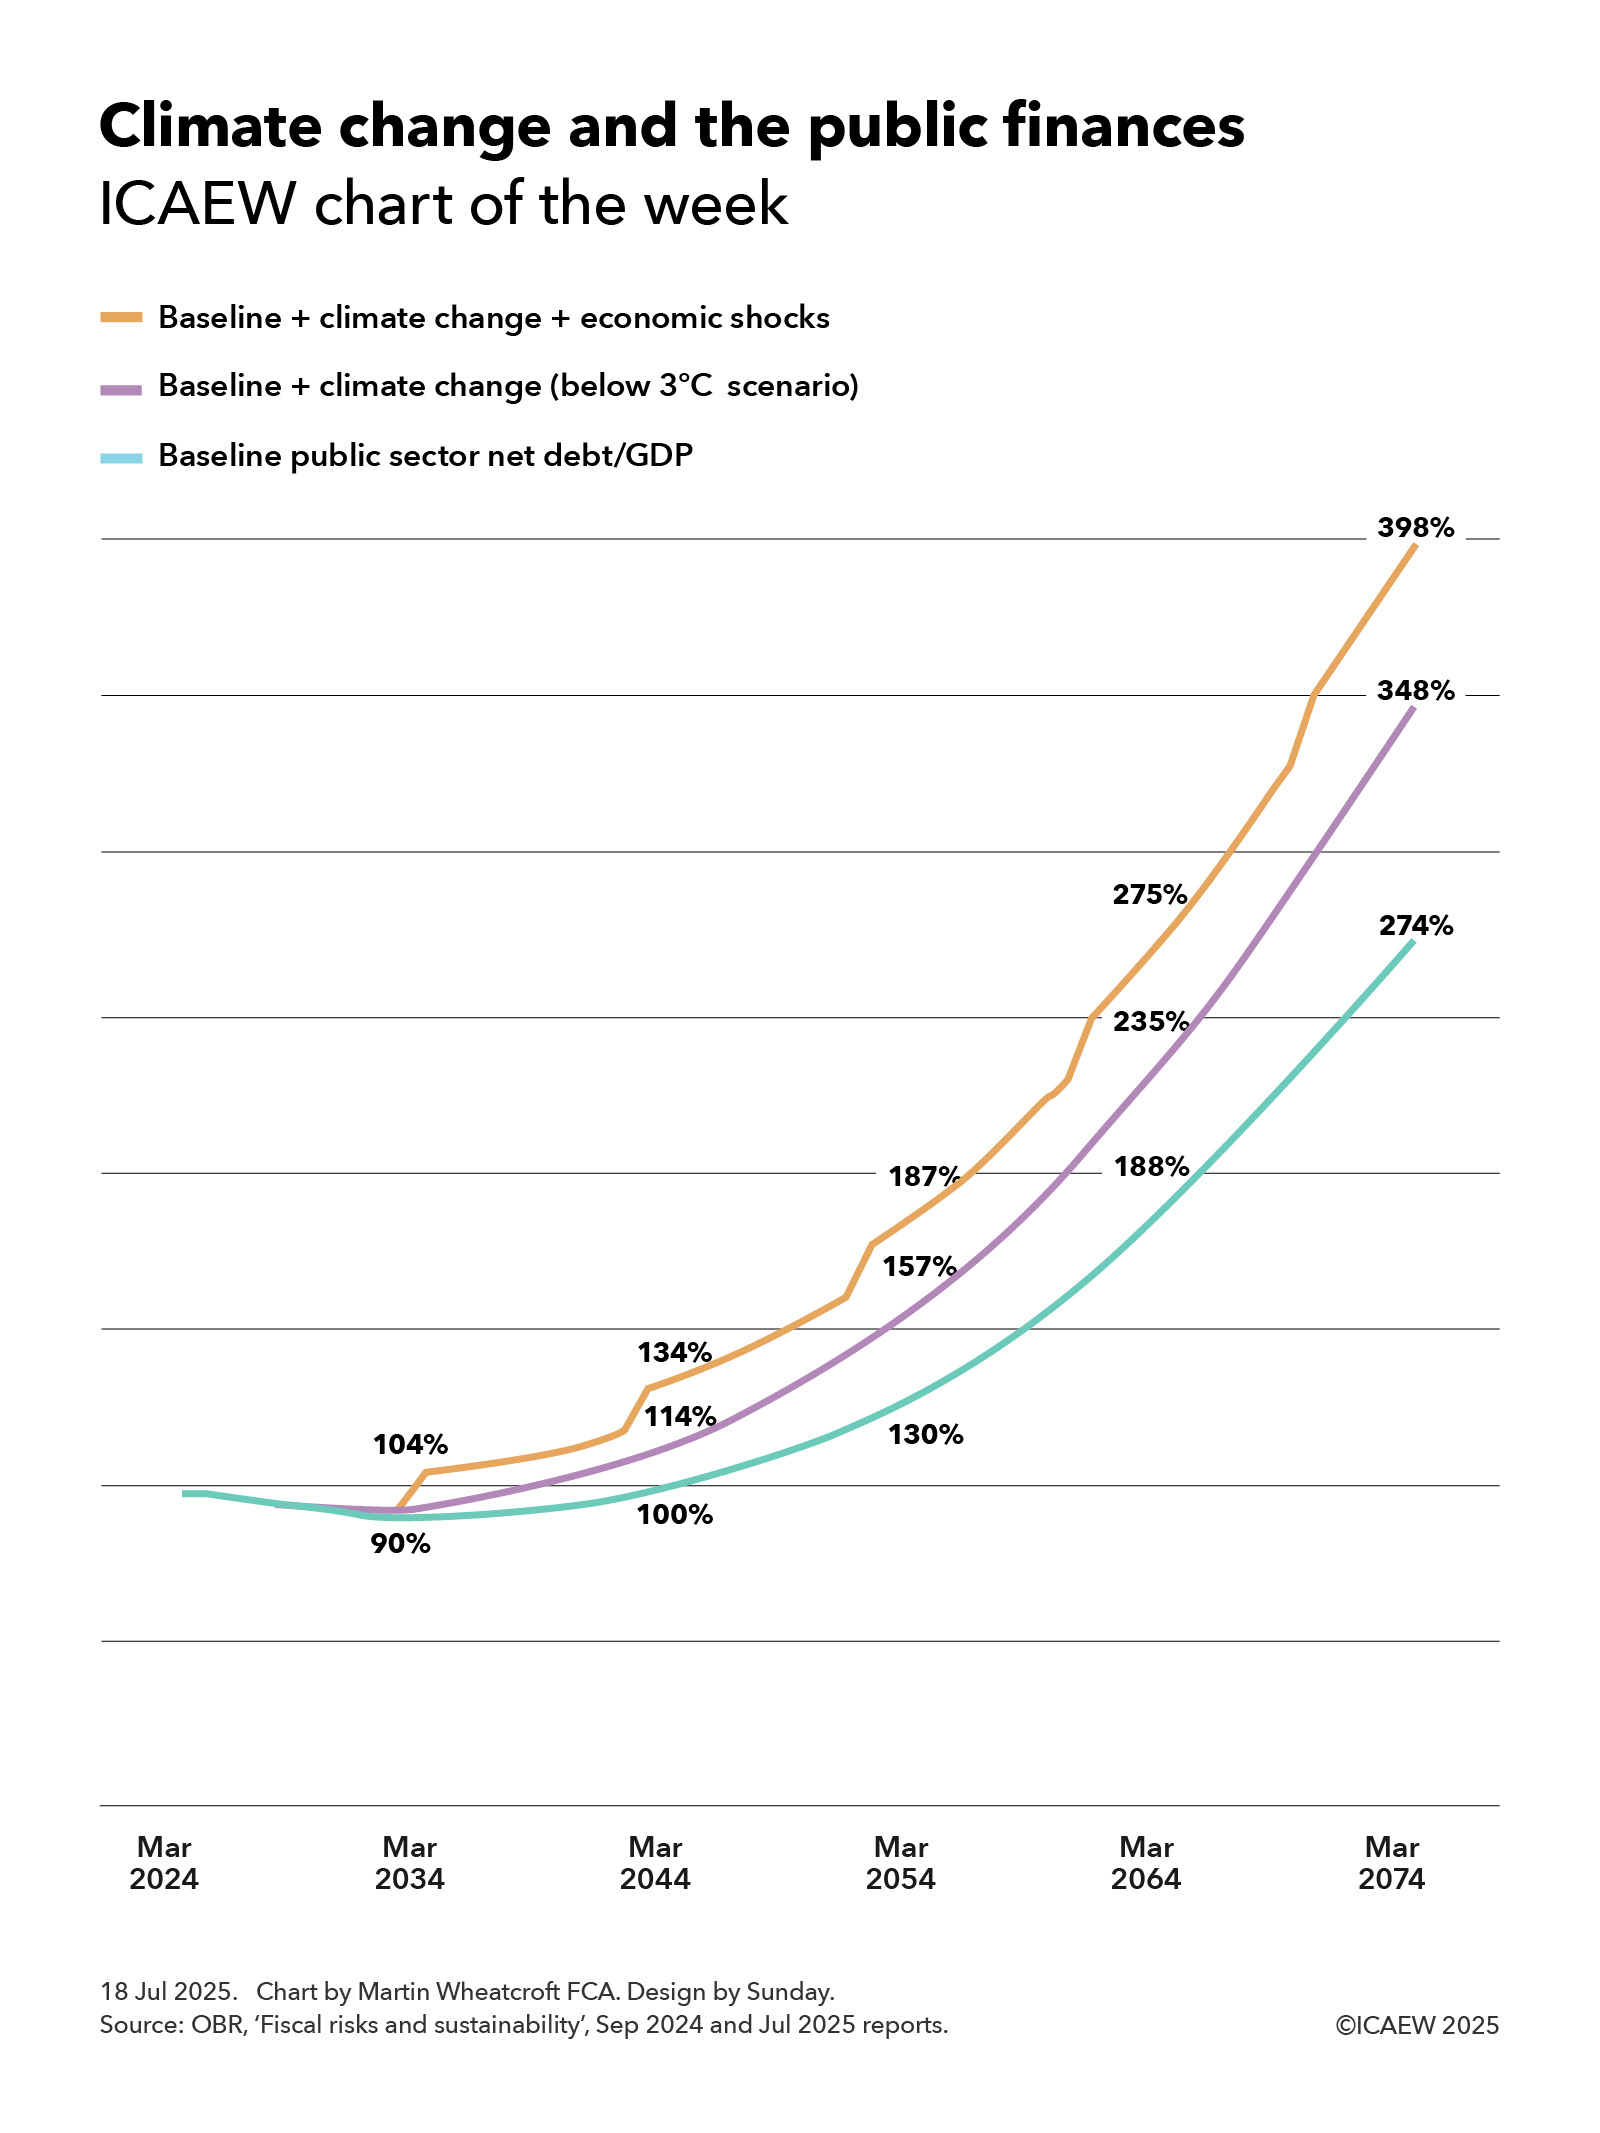
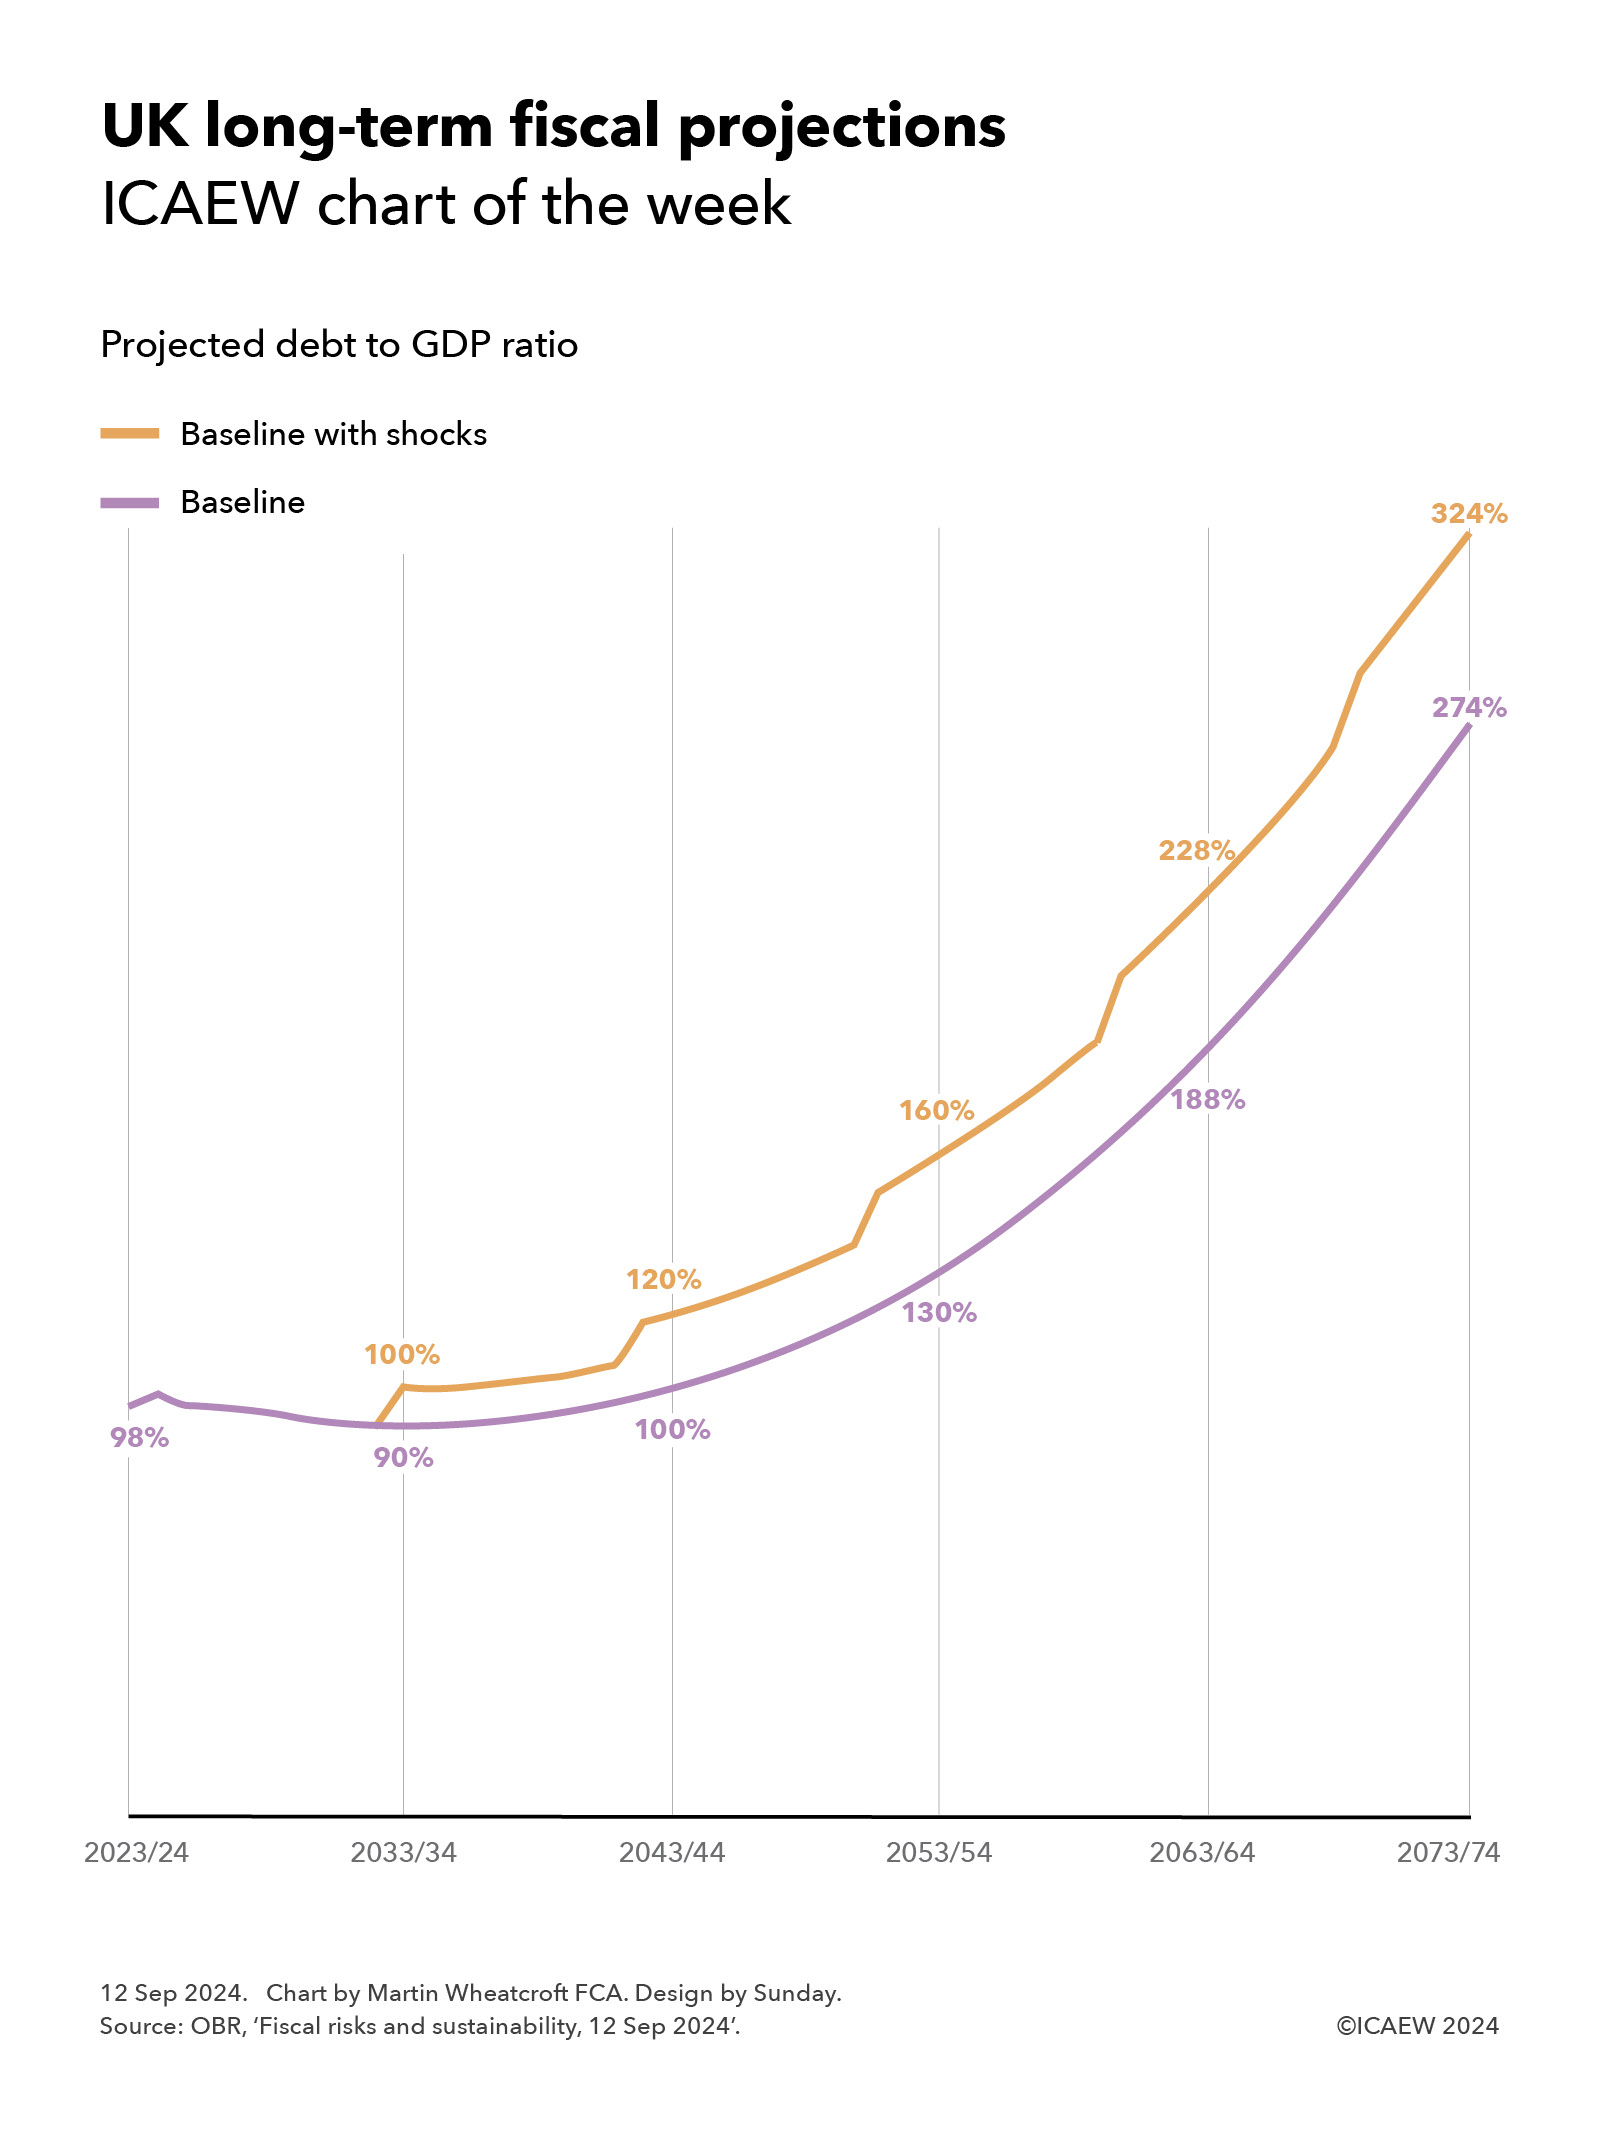
“The government has two big problems with the public finances: the short-term outlook – which is bad – and their long-term prospects – which are worse. Public spending continues to outpace tax receipts by a significant margin, while the OBR has reiterated its conclusion that the public finances are unsustainable over the next 25 to 50 years if this and future governments continue on the current path.
“Unfortunately, the major challenges facing the public finances over the next quarter of a century and beyond means that this will not be the last time a chancellor of the exchequer needs to come back asking for more. Now is the time to stop kicking the can down the road and develop a comprehensive long-term fiscal strategy to put the public finances onto a sustainable path.”
Month of June 2025
The fiscal deficit for June 2025 was £21bn, £4bn more than budgeted and £7bn more than a year previously. According to the ONS, this was the second-highest June deficit since monthly records began in 1993, with only June 2020 during the pandemic being higher.
First quarter to June 2025
The deficit for the first three months of the 2025/26 financial year was £58bn, £8bn more than a year previously. Despite being in line with budget, this is the third-highest first quarter deficit since monthly records began (after the first quarter deficits in 2020/21 and 2021/22).
Table 1 highlights how total receipts and total current spending in the three months to June 2025 of £278bn and £323bn were up 7% and 8% respectively, compared with the same period last year.
Receipts were boosted by the employer national insurance increase from April 2025 onwards in addition to the effect of fiscal drag on income tax caused by the continued freeze in personal tax allowances. Meanwhile, the increase in current spending over the past year was primarily as a consequence of public sector pay rises, higher supplier costs and rises in welfare benefits.
The increase in debt interest of £5bn to £42bn consisted of a £6bn increase in indexation on inflation-linked debt as inflation returned less a £1bn reduction in interest on variable and fixed-interest debt. The latter was primarily the effect of a lower Bank of England base rate offsetting a higher level of debt compared with a year ago.
Net investment of £13bn in the first quarter of 2025/26 was £1bn or 8% higher than the same period last year. Capital expenditure of £22bn was up by £1bn and capital transfers (capital grants, research and development funding, and student loan write-offs) of £9bn were up by £1bn, less depreciation of £18bn up by £1bn.
Table 1: Summary receipts and spending
| 3 months to June | 2025/26 £bn | 2024/25 £bn | Change % |
| Income tax | 64 | 60 | +7% |
| VAT | 52 | 50 | +4% |
| National insurance | 48 | 41 | +17% |
| Corporation tax | 26 | 24 | +8% |
| Other taxes | 57 | 56 | +2% |
| Other receipts | 31 | 30 | +3% |
| Current receipts | 278 | 261 | +7% |
| Public services | (178) | (165) | +8% |
| Welfare | (77) | (72) | +7% |
| Subsidies | (8) | (8) | – |
| Debt interest | (42) | (37) | +14% |
| Depreciation | (18) | (17) | +6% |
| Current spending | (323) | (299) | +8% |
| Current deficit | (45) | (38) | +18% |
| Net investment | (13) | (12) | +8% |
| Deficit | (58) | (50) | +16% |
Borrowing and debt
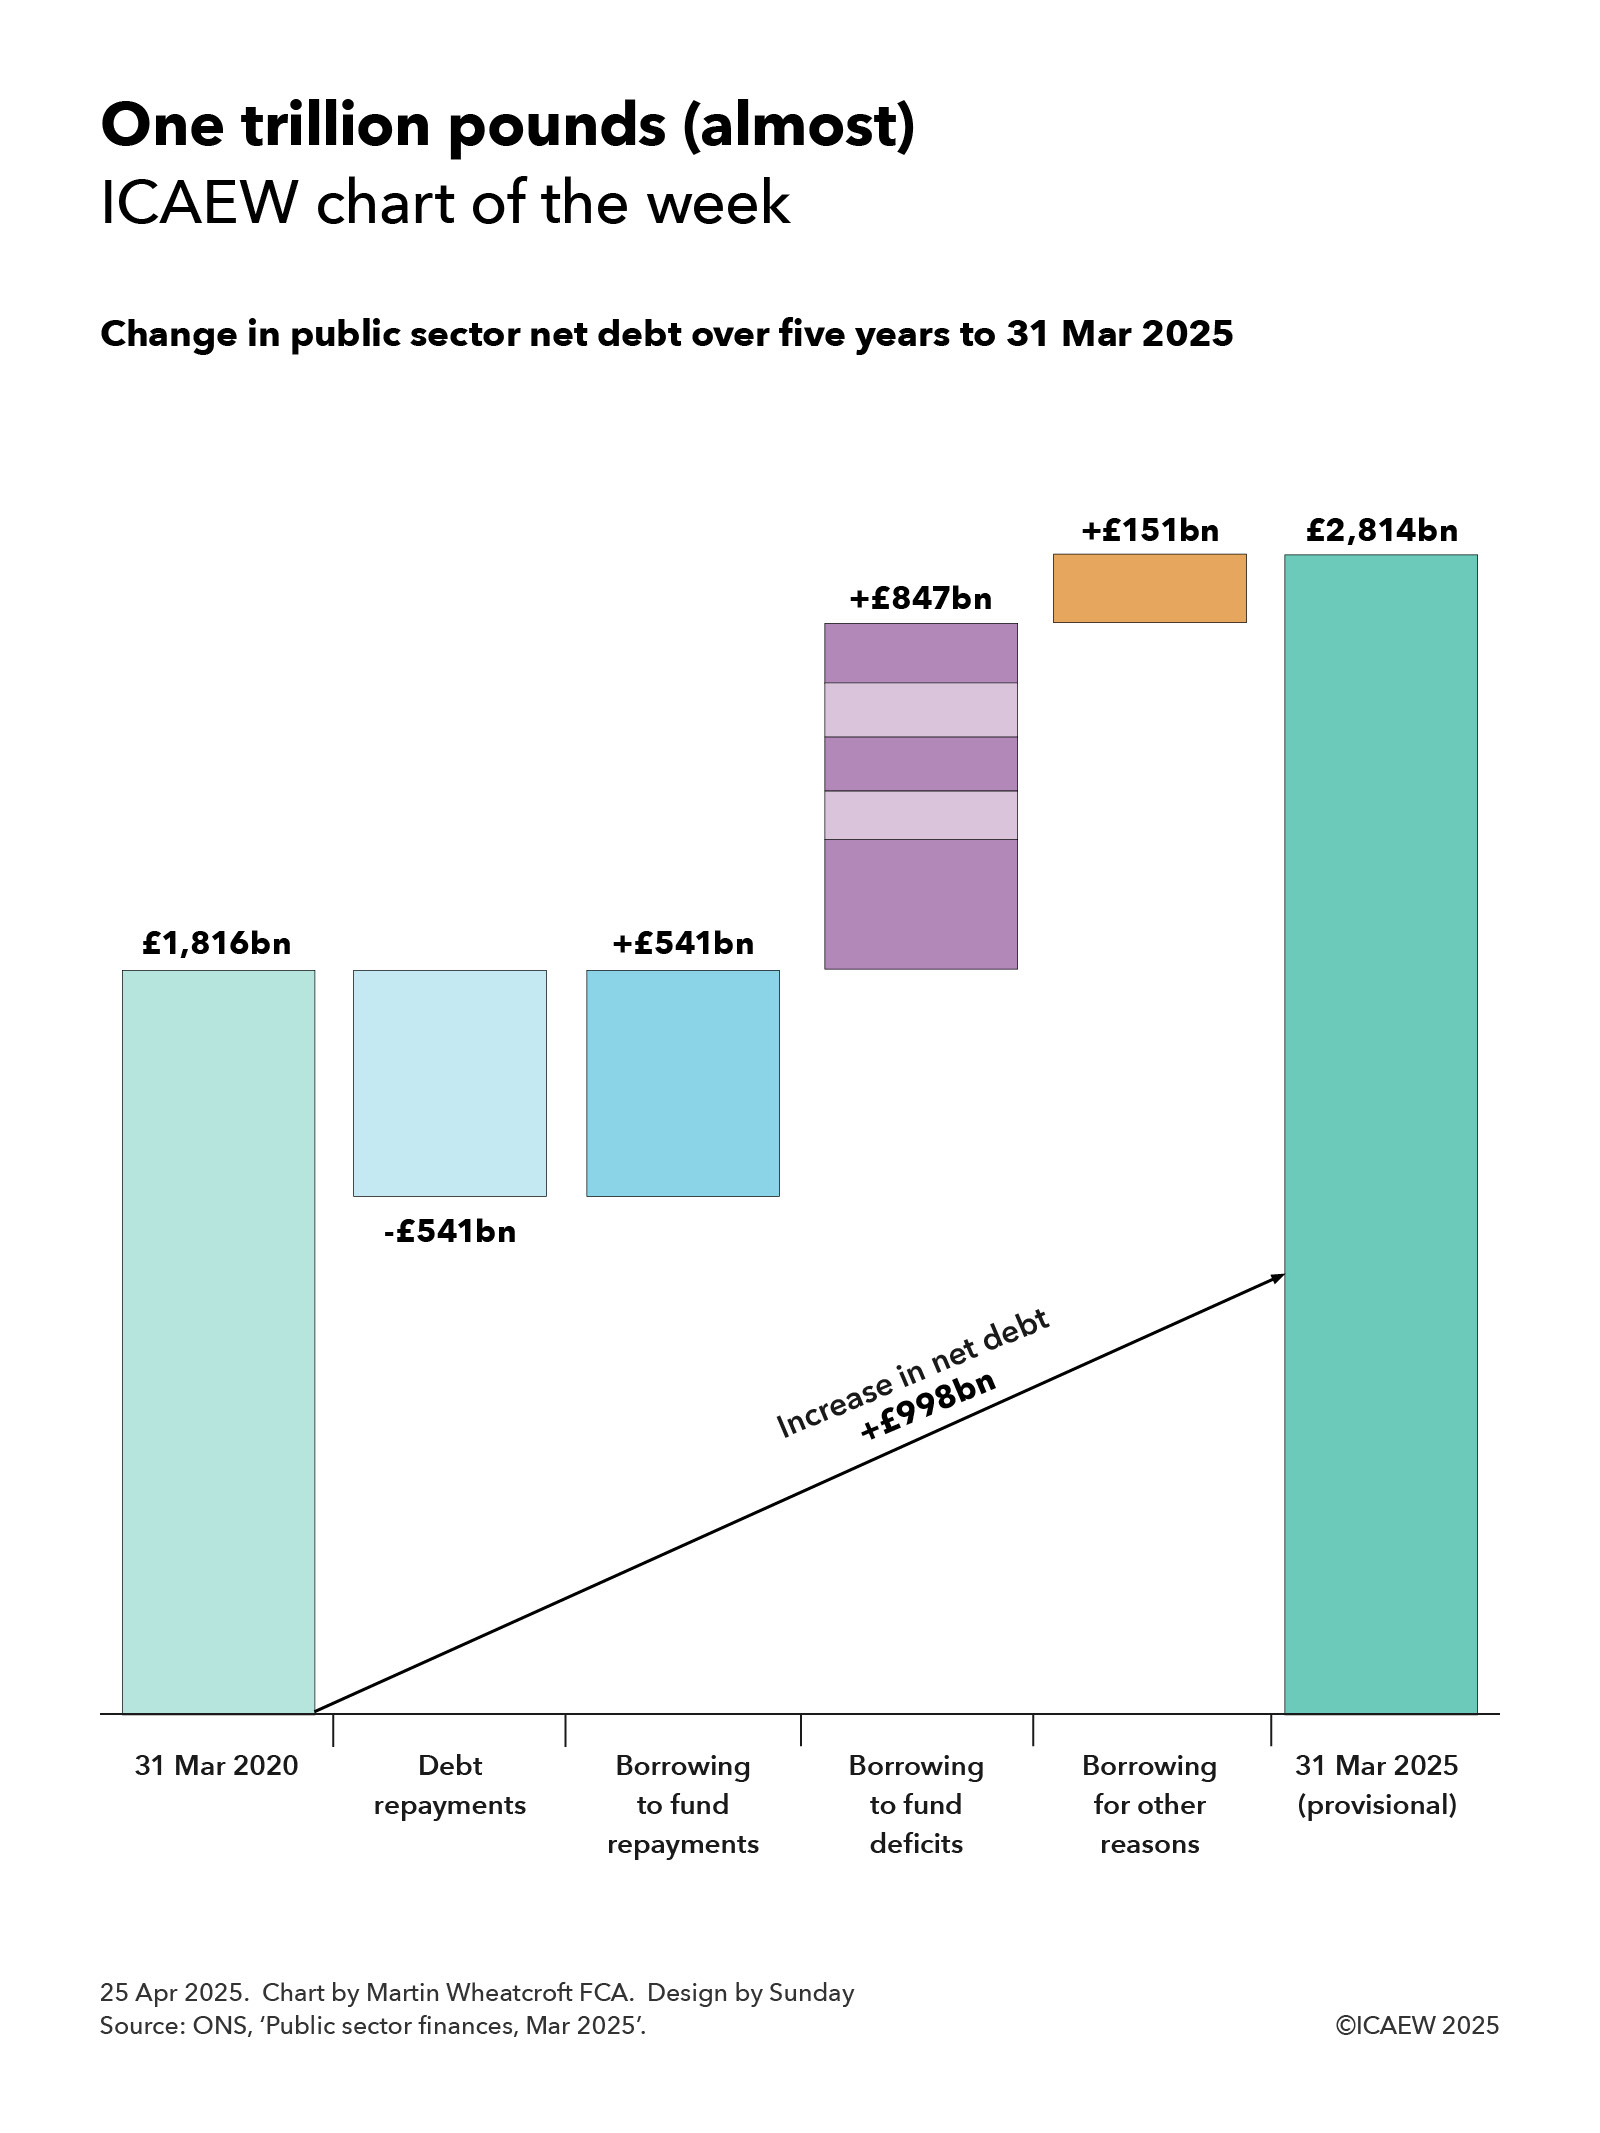
Table 2 summarises how the government borrowed £64bn in the first quarter to take public sector net debt to £2,874bn on 30 June 2025. The movements comprised £58bn in public sector net borrowing (PSNB) to fund the deficit and £6bn to fund government lending activities and working capital movements.
The table also illustrates how the debt to GDP ratio increased from 95.2% of GDP at the start of the financial year to 96.3% on 30 June 2025, with the incremental borrowing partly offset by the ‘inflating away’ effect of inflation and economic growth adding to GDP, the denominator in the net debt to GDP ratio.
Table 2: Public sector net debt and net debt/GDP
| 3 months to June | 2025/26 £bn | 2024/25 £bn |
| PSNB | 58 | 50 |
| Other borrowing | 6 | (3) |
| Net change | 64 | 47 |
| Opening net debt | 2,810 | 2,686 |
| Closing net debt | 2,874 | 2,733 |
| PSNB/GDP | 2.0% | 1.8% |
| Other/GDP | 0.2% | (0.1%) |
| Inflating away | (1.1%) | (1.5%) |
| Net change | 1.1% | 0.2% |
| Opening net debt/GDP | 95.2% | 95.6% |
| Closing net debt/GDP | 96.3% | 95.8% |
Public sector net debt on 30 June 2025 of £2,874bn comprised gross debt of £3,286bn less cash and other liquid financial assets of £412bn.
Public sector net financial liabilities were £2,504bn, comprising net debt of £2,874bn plus other financial liabilities of £706bn less illiquid financial assets of £1,076bn. Public sector negative net worth was £878bn, being net financial liabilities of £2,504bn less non-financial assets of £1,626bn.
Revisions
Caution is needed with respect to the numbers published by the ONS, which are repeatedly revised as estimates are refined and gaps in the underlying data are filled. This includes local government where the numbers are only updated in arrears and are based on budget or high-level estimates in the absence of monthly data collection.
The latest release saw the ONS revise the previously reported deficit for the two months to May 2025 down by £1bn and revise public sector net debt on 31 May 2025 up by £7bn.
For further information, read the public sector finances release for June 2025.