The OBR’s latest fiscal risks and sustainability report projects that public debt could reach 274% of GDP in 50 years’ time, or 324% if likely economic shocks are included.
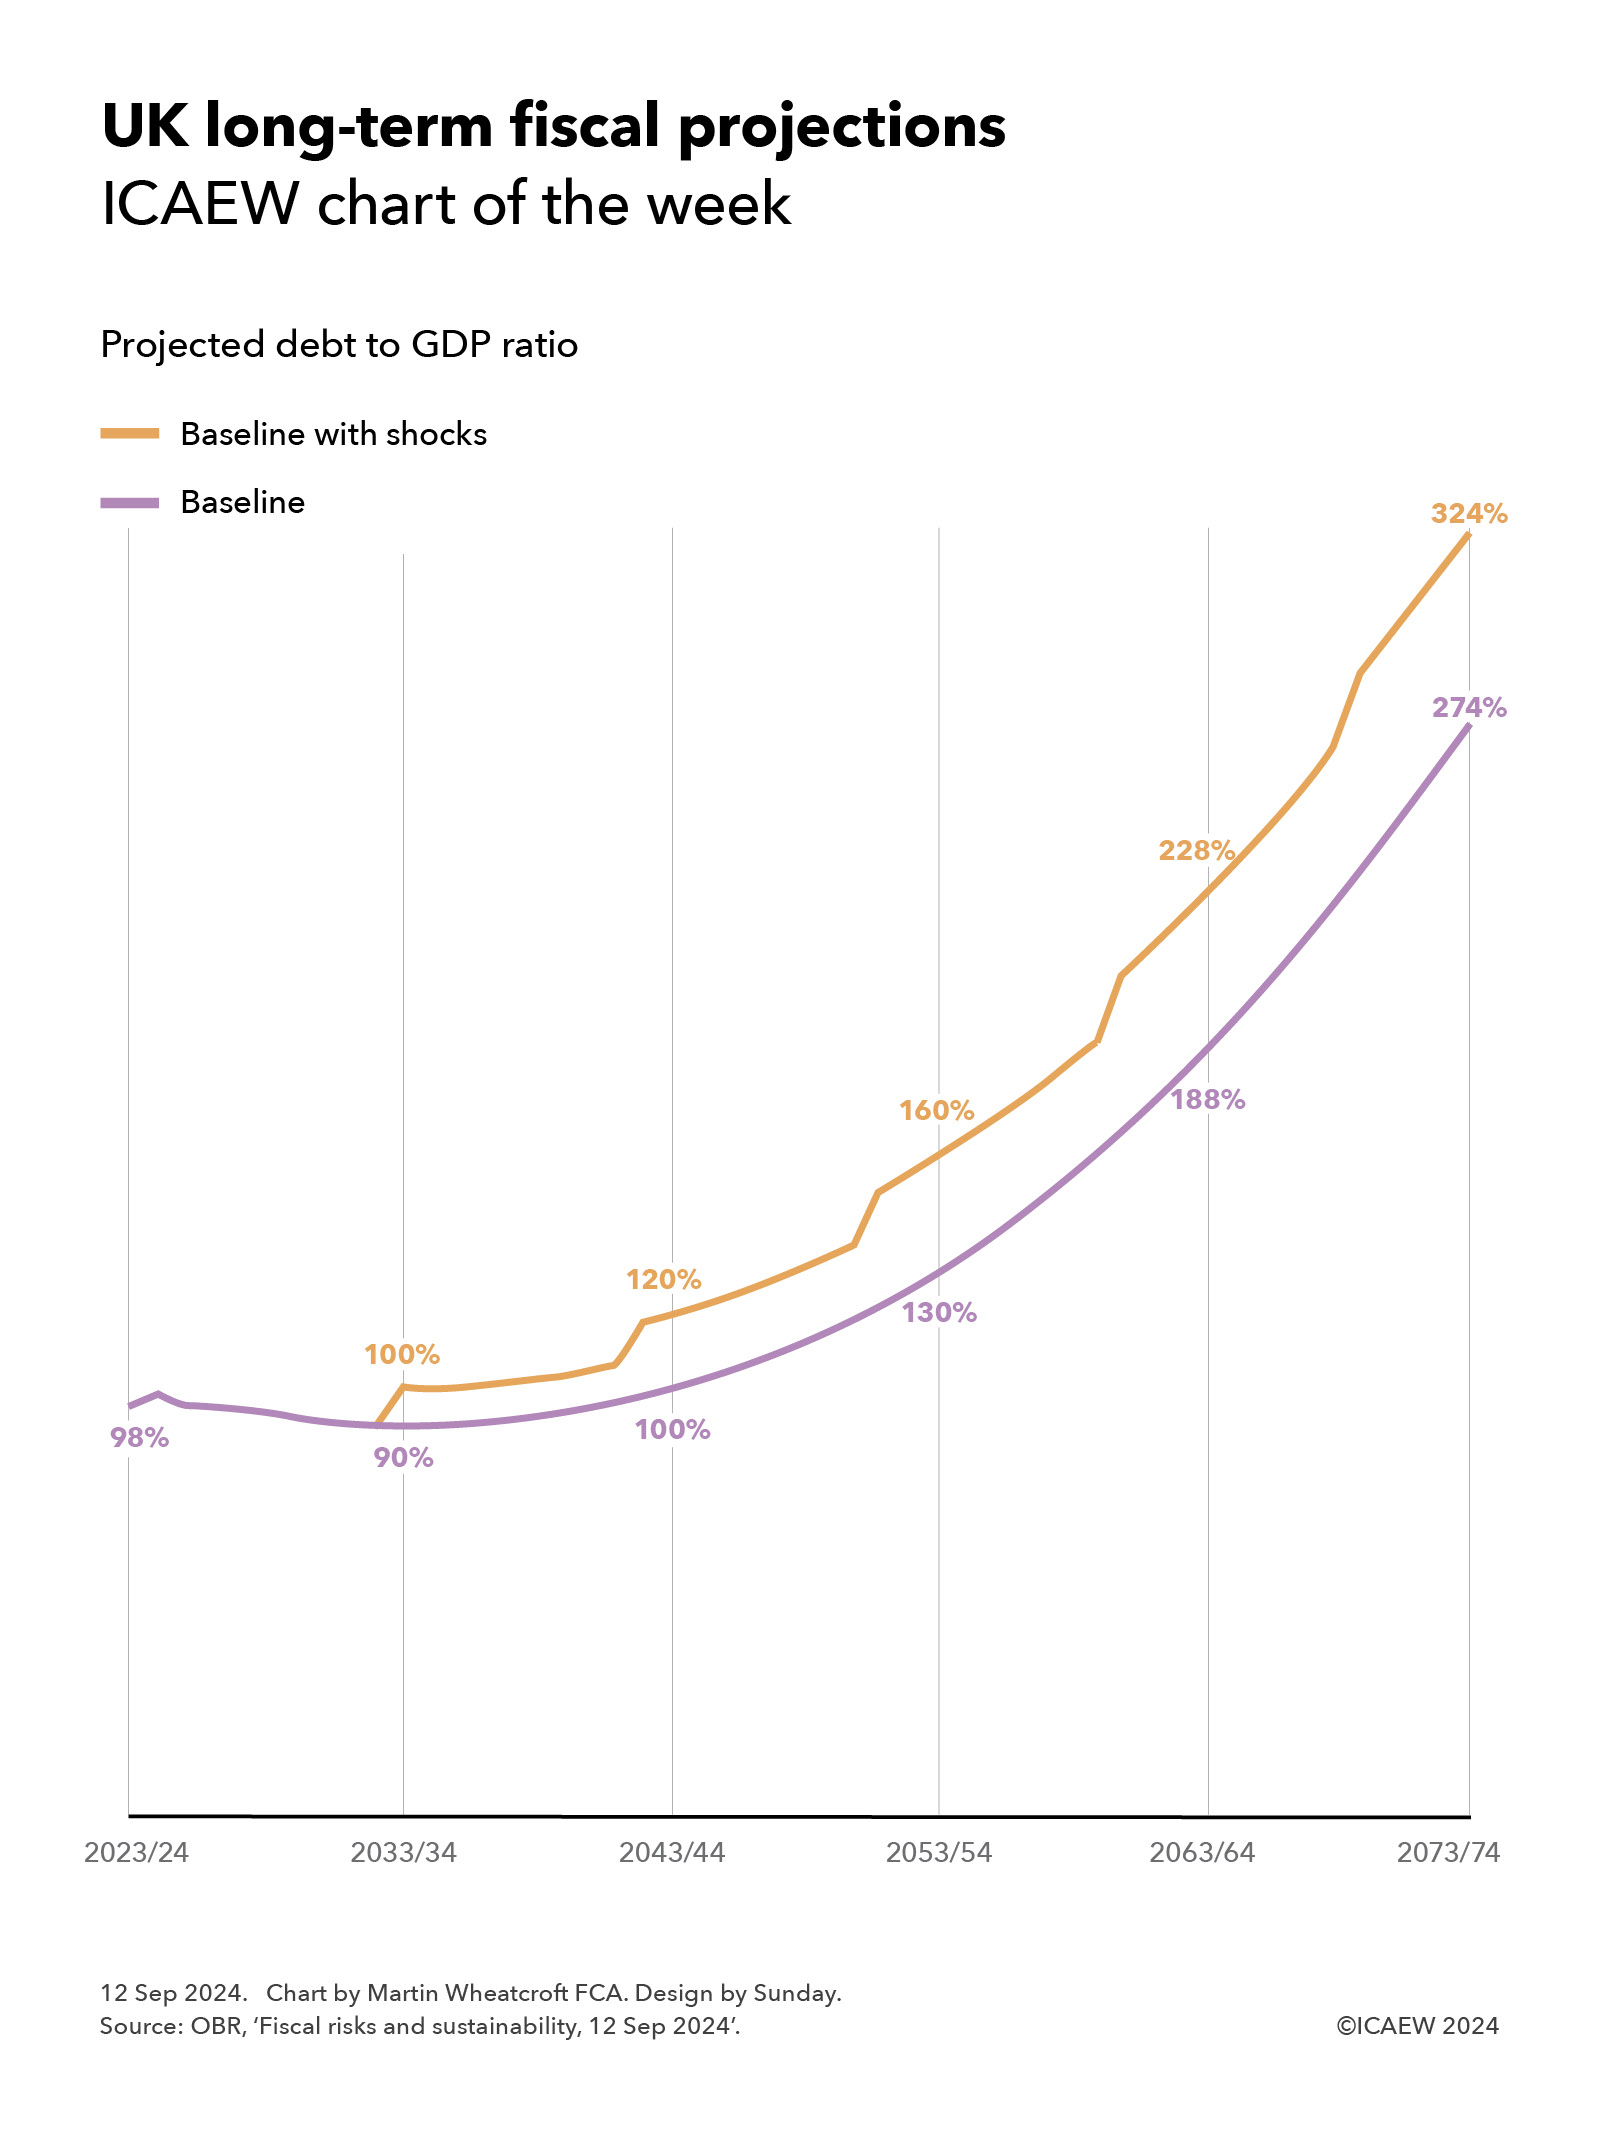
Our chart this week is on the long-term fiscal projections included in the Office for Budget Responsibility’s (OBR) latest fiscal risk and sustainability report published on 12 September 2024.
The OBR suggests that – without action to improve productivity, increase taxes, cut spending, bring in more people or do more to tackle climate change – public sector net debt is projected to rise to 274%, or potentially 324% if likely economic shocks are included.
As the chart illustrates, debt to GDP was 98% at the end of 2023/24 and the baseline projection shows this falling over the coming decade to 90% by 2033/34, and then gradually increasing to 100% of GDP in 2043/44, 130% in 2053/54, 188% in 2063/64, and then 274% in 2073/74.
Experience tells us to expect an economic shock such as a recession every decade or so, and so the OBR also reports a ‘baseline with shocks’ scenario that sees the debt to GDP ratio reaching 100% of GDP in 2033/34, 120% in 2043/44, 160% in 2053/54, 228% in 2063/64, and then 324% in 2073/74.
The projections reflect long-term pressures on the public finances from the post-economic crisis slowdown in economic growth, an ageing population, the effects of climate change, and higher defence spending.
They are, of course, dependent on the assumptions used in their calculation, especially reproductivity growth, net inward migration, the health of the population, and the degree of rise in global temperatures. They also assume that the previous government’s plans to cut public spending significantly over the next five years are adopted by the incoming government, which is considered to be unlikely given that most economic commentators thought these plans were unrealistic even if there had not been a change in government.
Alternative scenarios prepared by the OBR include a better health scenario that results in a 44% lower debt to GDP ratio in 2073/74, a worse health scenario that increases debt by 49% of GDP, a higher rise in global temperatures to 2℃ that increases debt by 23% and to 3℃ that increases debt by 33%.
The good news is that all of these projections are completely unrealistic.
They are based on extrapolating from current tax and spending policies, without taking account of any actions that governments might take in the future to raise taxes, cut spending or develop the economy. It is extremely unlikely that future governments would be willing, or even able, to finance such large fiscal deficits over the next 50 years.
The bad news is that in consequence taxes are likely to go up.
While there are options to mitigate pressures on the public finances by cutting spending on public services or cutting the level of benefits such as the state pension, these are likely to be politically and practically difficult to achieve. Similarly, immigration remains a politically charged issue and encouraging higher levels of net inward migration significantly more than the 315,000 a year assumed from 2028/29 onwards might be challenging.
The OBR suggests a ‘fiscal tightening’ of 1.5% each decade would be necessary to return debt to its pre-pandemic level of approximately 80% of GDP. If accomplished through tax rises alone, this would see tax levels increase from a projected 37% of GDP in 2027/28 to around 43% of GDP in 2073/24.
Avoiding either of these outcomes – unsustainable debt or ever-increasing levels of taxation – will require productivity growth to increase significantly. So, if you have any good ideas on how to achieve higher productivity that no one else has thought of (preferably without increasing public spending too much), please write to the Chancellor at 11 Downing Street as she would probably be interested to hear them.