ICAEW chart of the week: capital investment before the Spending Review

Given that capital budgets are often the first to be cut when money is tight, will the planned growth in capital investment survive the Spending Review later this month?

Capital investment before the spending review

Departmental capital budgets from 
2019-20 through 2025-26: £70bn, £92bn, £100bn, £107bn, £109bn, £113bn, £117bn

Local and other capital budgets: £14bn, £10bn, £7bn, £7bn, £11bn, £10bn, £10bn.

Sources: HM Treasury and Office for Budget Responsibility, Spring Budget 2021. Excludes covid and student loans.

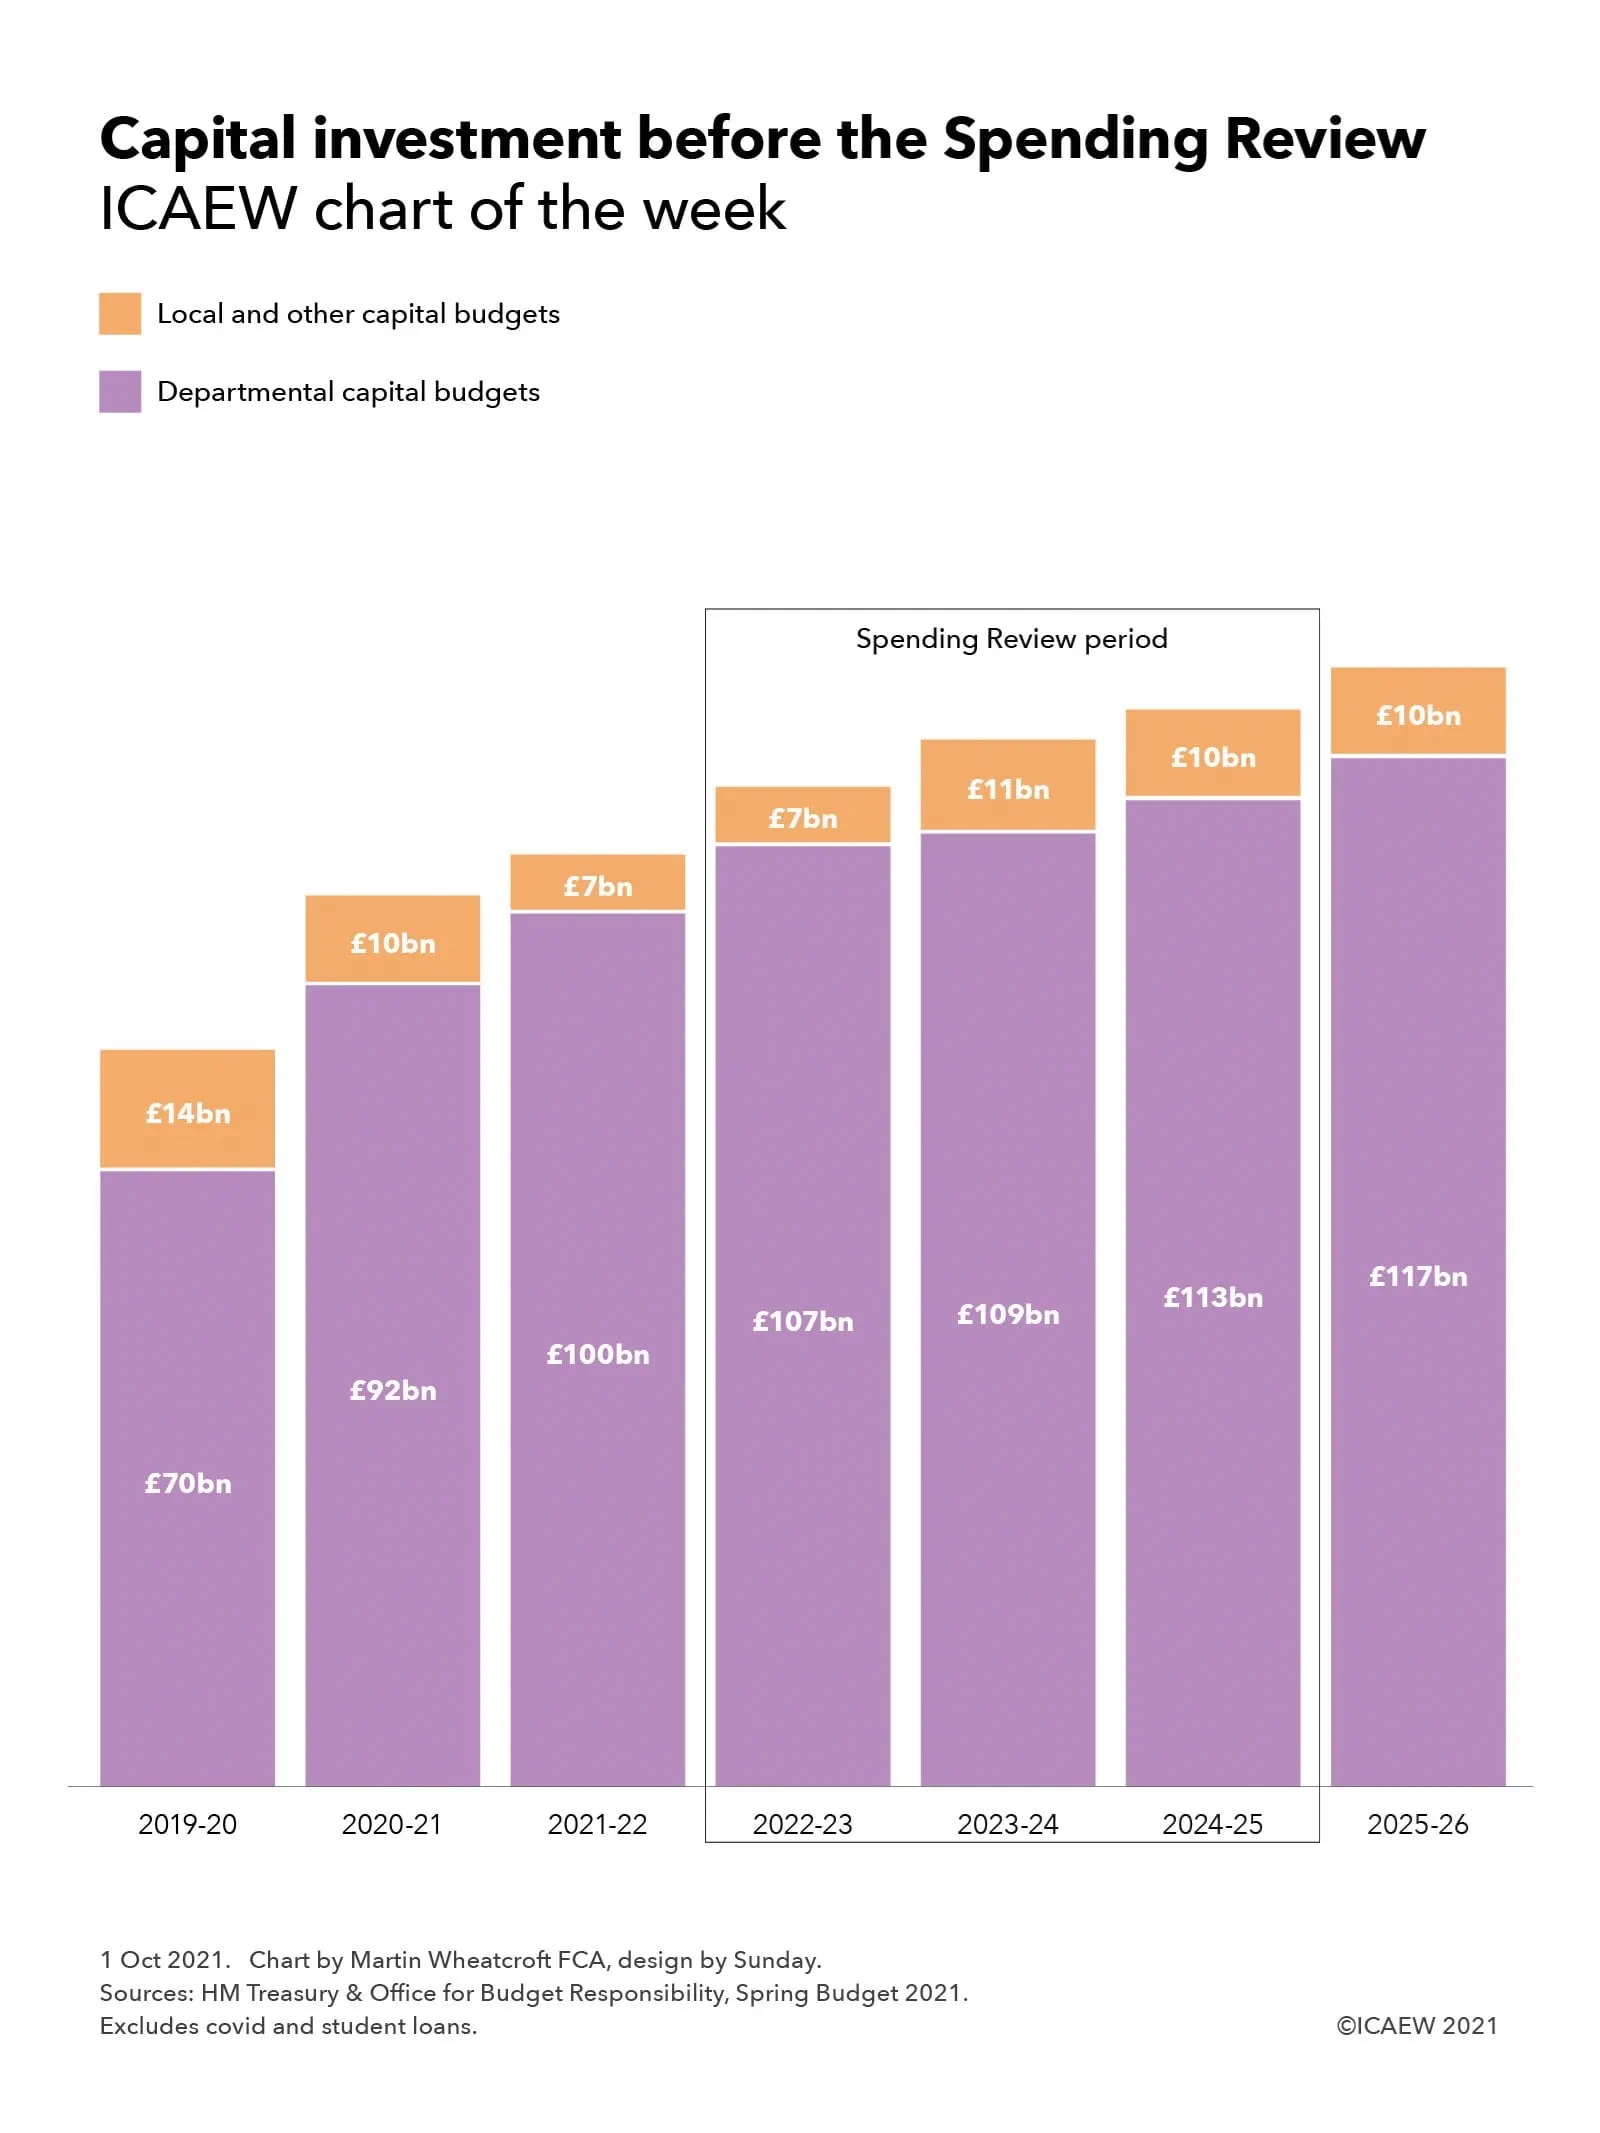
Our chart this week is on public sector capital investment, illustrating how central department capital budgets increased from £70bn two years ago to £92bn last year and £100bn this year, with further increases planned up to £117bn in 2025-26. This path was originally set by former Chancellor Philip Hammond who believed boosting capital investment, particularly on infrastructure, would help address the productivity gap that has constrained economic growth over the last decade. Chancellor Rishi Sunak has broadly adopted the same approach of increasing capital budgets in the first half of the 2020s, but with the rather snappier objective of ‘levelling up’ opportunity across the country.

Local and other capital budgets in the public sector are actually significantly higher than those shown in the chart (£14bn, £10bn, £7bn, £7bn, £11bn, £10bn and £10bn in 2019-20 through 2025-26), but that is primarily because a substantial proportion of both local government and public corporation capital investment is funded through central government capital grants, which are already included within departmental capital budgets. The balance, funded by local taxation and non-tax revenues, has actually fallen in the last few years, especially as many local authorities have tightened their belts as social care and other costs have outstripped council tax receipts.

The Treasury announced last month that the envelope for the Spending Review would adopt the capital spending profile already set out in the Spring Budget in March as shown in our chart, with core capital department expenditure limits (Core CDEL) of £107bn in 2022-23, £109bn in 2023-24 and £113bn in 2024-25. It seems likely that the government will stick ahead with these capital plans, unlike the profile for departmental current spending (Core resource department expenditure limits or Core RDEL, not shown in the chart) which increased by £15bn, 12bn and £14bn respectively to £408bn in 2022-23, £422bn in 2023-24 and £441bn in 2024-25 to address the increasing demands being placed on health care as more people live longer and to address the social care crisis. 

While this extra current spending is to be funded by the new health and social care levy, there remain huge pressures on many other public services as well as concerns about the risks to tax receipts from an uncertain economic recovery. The temptation to raid capital budgets to top up current spending, as occurred in the years following the financial crisis, will be there. After all, the benefits of capital investment can often take many years to arrive, while the stresses experienced by public services are much more immediate. In addition, under government fiscal rules, capital expenditure counts towards reported expenditure (total managed expenditure or TME) and the public sector deficit, which perhaps makes it more difficult to treat investment for the long-term differently from day-to-day operating expenditure. 

Assuming the Chancellor sticks to the plan, then the big story of the Spending Review from a capital expenditure perspective will be in the allocation between departments. Transport (£18bn in 2021-22), Business, Energy & Industrial Strategy (£16bn) and Defence & Intelligence (£15bn) are the largest spenders, and each will be fighting hard for more money, especially Defence where governmental ambitions to be a ‘tier 1’ military power have always outstripped the amount of money supplied. Other departments likely to be seeking additional capital funding include the Department for Levelling Up, Housing and Communities on behalf of local authorities in England (£9bn in 2021-22) and the devolved administrations (together £9bn).

Will the Chancellor be able to steer a course through what appear to be some turbulent economic waters to deliver on the government’s infrastructure ambitions?

This chart was originally published by ICAEW.

ICAEW chart of the week: German federal budget 2022

As Germany heads to the polls this weekend to elect a new federal parliament, the topic of the public finances has moved to centre stage. Our chart this week looks at the federal budget for 2022 and the current plan to sharply reduce the deficit from 2023 onwards.

German federal budget 2022

2021: revenue €307bn + borrowing €240bn = expenditure €488bn + investment €59bn

2022: revenue €343bn + borrowing €100bn = expenditure €391bn + investment €52bn

2023: revenue €398bn + borrowing €5bn = expenditure €352bn + investment €51bn

2024: revenue €396bn + borrowing €12bn = expenditure €357bn + investment €51bn

2025: revenue €396bn + borrowing €12bn = expenditure €357bn + investment €51bn

Source: Bundesministerium der Finanzen: 'Draft 2022 federal budget and fiscal plan to 2025'

The coronavirus pandemic has been accompanied by relaxations in both European and German constitutional limitations on the size of the federal deficit for 2020, 2021 and 2022, with Chancellor Angela Merkel of the Union parties (the Christian Democratic Union (CDU) together with Bavaria’s Christian Social Union (CSU)) and Finance Minister and chancellor-candidate Olaf Scholtz of the Social Democratic Party (SPD) setting out a plan earlier this year to reduce federal borrowing significantly by 2023.

As the #icaewchartoftheweek illustrates, the plan is to continue to run a sizeable deficit of €100bn in 2022 with tax and other revenue of €343bn being offset by €391bn in expenditure and €52bn in investment spending. This is a smaller deficit than the €240bn forecast for the current year (revenue €307bn – expenditure €488bn – investment €59bn) and the €131bn recorded in 2020 (not shown in the chart: revenue €311bn – expenditure €392bn – investment €50bn), both of which contained significant amounts of emergency spending in response to the pandemic. 

The hope is that revenues will recover in 2023 to €398bn at the same time as expenditures and investment return to pre-pandemic levels of €352bn and €51bn respectively to leave only a €5bn shortfall to be covered by borrowing. The forecast deficit for both 2024 and 2025 is €12bn, comprising revenue of €396bn in both years, less expenditure of just under €396bn in 2024 and just over €396bn in 2025 and investment in both years of €51bn. It is important to note that this is the budget for the federal government only and excludes the share of joint taxes going to Germany’s states (Länder) as well as expenditures funded from state and local taxation.

The challenge for the three principal candidates for the chancellorship: Olaf Scholtz of the SPD, Armin Laschet of the Union parties and Annalena Baerbock of the Green party, is in how to make promises to spend more on their respective priorities while maintaining the low levels of borrowing required by the constitution outside of fiscal emergencies. 

Major flooding earlier this year has put climate change at the top of the electoral agenda, with the need to increase investment to achieve net zero a key theme of party platforms. Together with promises to invest more in infrastructure and the need to cover the cost of more people living longer, higher defence spending and other financial commitments, there are significant questions about whether the path to near-budget balance can be achieved. Given the economic uncertainty, the prospect of returning to the pre-pandemic policy of paying down government debt seems unlikely, although that policy helped reduce general government debt from a peak of 82% of GDP in 2010 following the financial crisis. Despite the additional borrowing because of the pandemic, general government debt is still below that level at somewhere in the region of 75% of GDP – putting Germany in a much better fiscal position than many of its European neighbours, including the UK.

One candidate to be the next finance minister is Christian Lindner of the liberal Free Democratic Party (FDP), a possible partner in either a ‘traffic-light coalition’ of SPD (red), Greens (green) and FDP (yellow) or a ‘Jamaica coalition’ of the Union parties (black), Greens (green) and FDP (yellow) although this will of course depend on how the parties perform in the election on Sunday 26 September. Alice Weidel and Tino Chrupalla, joint leaders of the hard-right Alternative for Germany (AfD), and Janine Wissler & Dietmar Bartch, joint leaders of the Left Party (Die Linke), are considered unlikely to find their way into the federal cabinet in most scenarios.

Unlike in the UK, where a new prime minister customarily takes up residence in 10 Downing Street the next day, there is unlikely to be an instant change in national leadership. Chancellor Angela Merkel and most of her existing Union/SPD ‘Grand coalition’ cabinet are likely to stay in caretaker positions for several weeks or potentially months as fresh coalition negotiations between the parties elected to the Bundestag are concluded.

This chart was originally published by ICAEW.

ICAEW chart of the week: School-age demographic change

This week’s chart illustrates how the number of 10 year-olds in the UK is expected to fall sharply over the rest of the decade, just as the number of 18 year-olds is expected to peak in 2030.

School-age children

10 year-olds

2022: 855,000
2023: 831,000
2024: 813,000 
2025: 807,000
2026: 808,000
2027: 783,000
2028: 759,000
2029: 730,000
2030: 702,000

18 year-olds

2022: 741,000 
2023: 752,000
2024: 781,000
2025: 797,000
2026: 824,000
2027: 817,000
2028: 826,000
2029: 841,000
2030: 855,000

The Office for National Statistics UK Population Estimate for July 2020 reports that there were 855,000 children in the cohort who will be 10 years old next year when most of them will be entering their final year of primary school. A falling birth rate since 2012 means that the numbers of 10-year-olds will fall by 18% over the following eight years to 702,000 in 2030, with a consequent drop in the number of primary school places that will be needed in the coming decade: 

  • 2022: 855,000 10 year-olds
  • 2023: 831,000
  • 2024: 813,000 
  • 2025: 807,000
  • 2026: 808,000
  • 2027: 783,000
  • 2028: 759,000
  • 2029: 730,000
  • 2030: 702,000

At the same time, the number of 18 year-olds will grow significantly reaching a peak in 2030 when that cohort of 855,000 will be 18, 15% more than the 741,000 of 18 year-olds in 2022. 

  • 2022: 741,000 18 year-olds 
  • 2023: 752,000
  • 2024: 781,000
  • 2025: 797,000
  • 2026: 824,000
  • 2027: 817,000
  • 2028: 826,000
  • 2029: 841,000
  • 2030: 855,000

The chart was prepared using the numbers of children estimated to be in the UK in 2020 adjusted for time growing up, but without adjustment for migration or the (fortunately) relatively small number of deaths that would be expected to occur over the course of the decade. 

Prior to Brexit and the pandemic, there was a net inflow of around 5,000 a year adding to each age group which, if repeated, would have the effect of reducing the rate of decline in 10 year-olds and increasing the size of the peak in 18 year-olds in 2030. However, with migration potentially having gone into reverse during the pandemic, it is unclear whether net immigration will be as high as it was before.

Either way, one of the first orders of business for new Education Secretary Nadhim Zahawi will be to review the plans to reduce primary school and expand secondary school provision over the next few years, as well as addressing the pressure there will be on universities, colleges and apprenticeships as the bulge of births in the mid-noughties flows through the education system over the coming decade.

This chart was originally published by ICAEW.

ICAEW chart of the week: UK government borrowing

While government borrowing requirements have almost halved from its peak in the last financial year, it is still higher than the financial crisis a decade ago.

UK government borrowing chart

2007-08: Refinancing £29bn + New gilts issued £29bn
2008-09: £18bn + £126bn
2009-10: £16bn + £211bn
2010-11: £39bn + £127bn
2011-12: £49bn + £130bn
2012-13: £53bn + £112bn
2013-14: £51bn + £102bn
2014-15: £64bn + £62bn
2015-16: £70bn + £58nm
2016-17: £70bn + £78bn
2017-18: £79bn + £36bn
2018-19: £67bn + £31bn
2019-20: £99bn + £39bn
2020-21: £98bn + £388bn
2021-22: £79bn + £174bn (current year forecast)

Our chart this week is on the topic of government borrowing, which continues at an astonishing pace compared with pre-pandemic times. The UK Debt Management Office has been tasked with raising £253bn from the sale of government securities, comprising £174bn in new finance and £79bn to cover the repayment of existing debts as they fall due. That’s an average of £21bn a month, more than twice the £9.4bn raised in IPOs on the London Stock Exchange in the whole of 2020. 

Admittedly, this is a slower pace than the even more astonishing fundraising in 2020-21 that saw £486bn in gilts issued (almost half a trillion pounds), with £98bn raised to repay existing debts and £388bn used to cover the costs of the pandemic and the shortfall in tax receipts it caused. 

Despite that, the £253bn needed from the sale of gilts this year is still more than was raised in the 2009-10 financial year during the depths of the financial crisis, the previous peacetime peak. This partly reflects a higher refinancing requirement than a decade ago, one of the legacies of the financial crisis. The legacy of the pandemic will be even higher refinancing requirements into the future, keeping the debt markets busy for decades to come. 

The chart does not provide the full story of the UK’s public debt raising, as the Bank of England purchased £450bn of fixed-interest gilts in the market over the last couple of years as part of its quantitative easing operations, in effect swapping the fixed rates of interest payable on the government bonds concerned for the variable rate that is payable on central bank deposits. This has arguably helped the gilt market finance the purchase of such large amounts of government debt and helped keep the cost of government borrowing at extremely low levels but at the cost of significantly increasing the exposure of the public finances to changes in interest rates.

While the government’s financing requirements should be lower in the next few years as the economy recovers, substantial sums will still need to be raised, potentially in much less favourable market conditions. Rising inflation, higher interest rates, and potentially the unwinding of QE, would all combine to increase the cost of borrowing substantially. The days of issuing 30-year gilts at yields of less than 1% may not be with us for much longer.

For more information about the UK’s public debt portfolio, visit the Debt Management Office.

Government gilt sales in 2007-08: £29bn in new gilts + £29 for refinancing; 2008-09: £126bn + £18bn; 2009-10: £211bn + £16bn; 2010-11: £127bn + £39bn; 2011-12: £130bn + £49bn; 2012-13: £112bn + £53bn; 2013-14: £102bn + £51bn; 2014-15: £62bn + £64bn; 2015-16: £58bn + £70bn; 2016-17: £78bn + £70bn; 2017-18: £36bn + £79bn; 2018-19: £31bn + £67bn; 2019-20: £39bn + £99bn; 2020-21: £388bn + £98bn; 2021-22: £174bn (forecast) + £79bn.

This chart was originally published by ICAEW.

ICAEW chart of the week: Pensions triple lock

The triple lock has helped the state pension grow faster than inflation or earnings over the last decade, but will the Chancellor break it for next year’s pension increase?

Pensions triple lock

Basic state pension in 2011-12: £5,512 + Triple lock £1,843 = £7,155 in 2021-22. Compares with increase based on earnings of £1,108, on CPI of £1,144 or 2.5% a year of £1,487.

New state pension (extrapolated back) in 2011-12: £6,932 + triple lock £2,408 = £9,339. Compares with increase based on earnings of £1,443, CPI of £1,492 and 2.5% a year of £1,940.

Based on a projected 8.3% annual increase in average earnings in 2021, the basic state pension would by £593 to £7,748 and the new state pension would increase by £775 to £10,114.

ICAEW’s chart of the week illustrates just how much of a boost the triple lock has been to the state pension since its introduction a decade ago compared with what would have happened if it had risen in line with one of the components of the triple lock formula alone.

It also illustrates how much pensioners might get in April next year if the government continues with the current formula and doesn’t adjust for the distortions in the official statistics caused by the pandemic. With average earnings for the three months to July 2021 projected to be in the order of 8.3% higher than a year previously, the incremental cost would be significant given that the state pension is the second biggest line item in the government’s spending bill at over £105bn a year.

With the statistic distorted by effects of the pandemic, the Chancellor may decide to adopt an ‘adjusted’ percentage to eliminate the effects of the furlough scheme and lockdowns, likely to be somewhere in region of 3.5% to 5%, or potentially he could opt to use the annualised average rise over two years that is expected to be closer to 3.5%. Or he could abandon the triple lock completely and choose another basis for determining how much pensioners will have to live on next year.

EarningsCPI2.5%
2012-132.8%5.2%2.5%
2013-141.6%2.2%2.5%
2014-151.2%2.7%2.5%
2015-160.6%1.2%2.5%
2016-172.9%-0.1%2.5%
2017-182.4%1.0%2.5%
2018-192.2%3.0%2.5%
2019-202.6%2.4%2.5%
2020-213.9%1.7%2.5%
2021-22-1.0%0.5%2.5%

The basic state pension, payable in full to those with 30 years of national insurance credits, increased from £5,312 (£102.15 per week) in 2011-12 to £7,155 (£137.60 per week) in 2021-22, an increase of £1,843 (£35.45 a week). This contrasts with the increases that would have been seen if pensions had been uprated over that period in line with average earnings (£1,108 or £21.30 per week), CPI (£1,144 or £22.00 per week) or 2.5% (£1,487 or £28.60 per week). By selecting the highest of the average earnings or inflation and with a floor of 2.5%, the result has been to uplift the basic state pension above the legally required increase in line with earnings.

This does not mean that pensioners have received this level of increase for the whole of their pension, as many of those who retired before 2016 are entitled to an additional state pension linked to their national insurance contributions (also known as the state earnings related pension or SERPs) that has been uprated each year over the last decade in line with CPI.

Since 6 April 2016, the basic and additional pensions have been replaced for those retiring after that date by the new state pension, which requires 35 years of national insurance credits to receive the full amount. This provides a higher income for most pensioners than the basic plus additional state pension system but less for those with higher career earnings who – the theory goes – should also have company or private pensions to support them in retirement. 

The chart illustrates the effect of the triple lock on the new state pension as if it had been in place since 2011-12, with the triple lock increase of £2,408 (£46.35 per week) to reach the current level of £9,339 (£179.60 per week) contrasting with average earnings (£1,443 or £27.75 per week), CPI (£1,492 or £28.70 per week) or 2.5% (£1,940 or £37.30 per week).

The ratchet effect of the triple lock will be put to the test for the coming state pension rise, as the statistic used to measure the rise in average earningsstood at 8.8% as at June 2021 and is expected to be somewhere in the region of 8.3% (plus or minus) when July 2021 statistic is announced later this month. As the chart indicates this would result in a £593 (£11.40 per week) increase in the basic state pension to £7,748 (£149.00 per week) and a £775 (£14.90 per week) increase in the new state pension to £10,114 (£194.50 per week).

The distortion in the average earnings statistic is because of the combination of fewer lower paid employees in the workforce a year ago altering the make-up of the working population used to measure pay rises and the furlough scheme where many employees received a temporary pay cut of 20% if their employers didn’t make up the difference. However, there is some genuine wage inflation going on, with the ONS estimating that the ‘underlying’ annual rise in average earnings for the three months to June 2021 was somewhere between 3.5% and 4.9%.

The Chancellor is expected to announce his decision on the triple lock at the fiscal event on 27 October, although there is a chance that he might make an announcement later this month in order to avoid getting pensioners’ hopes up when the average earnings rise is released on 14 September – only to then dash them a few weeks later.

This chart was originally published by ICAEW.

ICAEW chart of the week: Olympinflation

Our chart this week shows how the Summer Olympics has grown from 43 medal events and 241 competitors in Athens in 1896 to 339 medal events attracting 11,326 competitors in the Tokyo Summer Olympics this year.

Olympinflation chart comprising columnsfor number of medal events and a line for competitors:

Medal events: 43 in 1896 to 95 in 1904 to 102 in 1912 to 156 in 1920 to 109 in 1928 to 129 in 1936 to 149 in 1852 to 150 in 1960 to 172 in 1968 to 198 in 1976 to 231 in 1984 to 257 in 1992 to 271 in 1996 to 300 in 200 to 302 in 2008 to 306 in 2016 to 339 in 2021.

Competitors from 241 in 1896 up to 3,089 in 1924 down to 1,332 in 1932 up to 3,936 in 1936 up to 4,955 in 1952 down to 3,314 in 1956 up to 7,134 in 1972 down to 5,179 in 1980 up to 10,651 in 2000 down to 10,625 in 2004 up to 10,942 in 2008 down to 10,768 in 2012 up to 11,326 in 2021.

Our chart this week shows how the Summer Olympics has grown from 43 medal events and 241 competitors in Athens in 1896 to 339 medal events attracting 11,326 competitors in the Tokyo Summer Olympics this year.

The arrival of the Summer Olympics has turned many of us into experts in obscure sports that never normally crossed our minds, as well as thrilling us with seeing the world’s top athletes compete to be the best in the sports we love. The sheer scale of sporting activity is immense as it turns a global audience into athletic couch potatoes over a period of two weeks every four years – or five on this particular occasion with the delay to 2021 because of the pandemic. Despite the absence of spectators, so far the Games have been gripping as tiny margins have determined who gets gold, silver or bronze or who comes home without a medal, but still the privilege of being an Olympian.

Our chart this week illustrates how the Summer Olympics has grown in scale over time. The Tokyo Summer Olympic Games continued the upward path in the number of medal events, with 339 medal events in 50 sporting disciplines from 33 sports and 11,326 competitors from 206 nations. This compares with 43 medal events in 10 disciplines from 9 sports in the first Summer Olympiad in 1896, involving just 241 competitors from 14 nations.

New sports this year include karate, skateboarding, sports climbing, surfing and (the return of) baseball/softball, providing new opportunities for competitors to show their talents to the world, and for the rest of us to add to our fleeting knowledge of what it takes to ride a skateboard in an organised format or the technicalities of riding a wave to score points. These add to the existing sports of aquatics, archery, athletics, badminton, basketball, boxing, canoeing, cycling, equestrian, fencing, field hockey, football, golf, gymnastics, handball, judo, modern pentathlon, rowing, rugby sevens, sailing, shooting, table tennis, taekwondo, tennis, triathlon, volleyball, weightlifting and wrestling.

The Olympics will be over all too soon, leaving us bereft and demanding more. Fortunately, the Paralympics will be starting on 24 August with 540 medal events in 22 sports to keep us glued to our screens this summer.

Chart of the week will be taking its customary break during August and will return in September, while the Summer Olympics will hopefully be taking a shorter than usual three-year break to return to schedule with the Paris 2024 Summer Olympics.

This chart was originally published by ICAEW.

ICAEW chart of the week: Tokyo Olympics cost update

Cost overruns have been a recurring feature of the modern Olympic movement, but the pandemic has blown the doors off the budget for the Tokyo games.

Tokyo Olympics cost update - column chart:

Budget v1 £5.2bn
Budget v2 £9.0bn
Budget v3 £9.0bn
Budget v4 £9.4bn (venues £4.7bn, Games £2.9bn, marketing and general £1.6bn)
Budget v5 £11.0bn (venues £5.4bn, Games £4.0bn, marketing and general £1.6bn) + Outside the Games costs £12.5bn = 
Estimate of £23.5bn (Organising Committee £4.7bn, Tokyo Metropolitan Government £10.2bn, Government of Japan £8.6bn)

Hosting an Olympics is a costly affair, with headlines about budget overruns a regular occurrence in recent decades. The Tokyo Olympics is no exception, with the latest official budget for the rescheduled 2020 Olympic Games rising to ¥1.7tn ($15.4bn or £11.0bn) compared with an original budget of $7.5bn or £5.2bn. 

Of course, nobody expected the original budget from Tokyo’s bid in 2013 to be the final result, but annual budgets since 2017 have shown a gradual rise in both the cost of running the Olympic Games and the cost of the venues. This would be unsurprising to those that remember the 2012 London Olympics, where the costs significantly exceeded the estimated overheads set out in the original bid.

The version two budget established in December 2017 of £9.0bn, comprising £4.7bn for venues, £2.4bn for running the Games and £1.9bn for marketing, communications and general expenditures was substantially maintained in version three with offsetting increases and decreases in different parts of the budget. Additional income allowed the organisers to add in a contingency to increase the budget to £9.2bn by 2019, with the budget for venues still £4.7bn, running the Games up to £2.9bn (including the contingency) and marketing and general expenditures down slightly to £1.6bn.

The pandemic drove a big jump in the version five of the budget, put together six months after the 2020 Games were supposed to have taken place. The budget for venues (permanent, temporary and energy costs) went up to £5.4bn, up from £4.7bn in previous budgets, while the version five budget for running the Games (transport, security, technology and operations) of £4.0bn is a third more than the 2019 estimate of £2.9bn and more than 60% higher than the 2017 estimate of £2.4bn, with marketing and general expenditures still at £1.6bn.

Not shown in the chart is the expected revenue that was anticipated to fund the Tokyo Organising Committee’s share of costs of £4.7bn, comprising £0.6bn from the International Olympic Committee (the IOC, which owns the global broadcasting rights), £2.8bn from sponsorship and licencing, £0.6bn from ticket sales and £0.7bn in other revenues. With tickets being refunded to spectators who can no longer attend, this leaves a hole in the Organising Committee’s finances that will need to be funded either by the IOC or by the Tokyo Metropolitan Government.

The chart also illustrates how the official budget for the Olympics is not the full story, with the Tokyo Metropolitan Government and the Japanese Government incurring a further £12.5bn or so in costs outside the Games, in addition to their already substantial contributions to the cost of venue construction. There are some disputes about these numbers as their spending include ‘legacy’ investments in public infrastructure that could be argued should not be counted, in addition to costs with a direct causal linkage, such as policing and security costs away from Olympic venues. The £12.5bn amount is based on AP reporting of a Japan Board of Audit report from 2019, but recent reports in the Japanese press have suggested the costs to the metropolitan and national governments of hosting the Olympics could end up being even larger.

While the pandemic was not foreseeable back in 2013 when Tokyo was awarded the 2020 Olympics, the budgetary tale highlights the importance of building in headroom for changes as well as considering contingencies when setting budgets. For example, there was insurance cover to deal with the risk of an event like the pandemic leading to a cancellation of the Games, but the insured amounts were insufficient to cover the full losses of a complete cancellation. This is no doubt one (but not the only) reason why the organisers are going ahead despite everything that has happened.

Fortunately for those of us who like watching sport on our screens, the Olympic Games and the Paralympic Games are going ahead after all and it is the performance of the athletes that will be our main focus for the next few weeks. We wish them the best of luck!

This chart was originally published by ICAEW.

ICAEW chart of the week: UK-EU financial settlement update

This week’s chart is on the UK-EU withdrawal agreement financial settlement. Perhaps surprisingly given recent press coverage, ICAEW’s analysis is that it remains roughly unchanged from the Treasury’s 2018 estimate.

Chart on UK-EU financial settlement.

HM Treasury estimate from 2018 of £39bn less £16bn transition = post-transition net payments of £23bn (£19bn approved expenditure not paid + £11bn pension obligations, less £7bn share of EU assets).

Changes since 2018: -£2bn approved expenditure not paid +£2bn pension obligations.

EU 2020 accounts £42bn less forecast UK receipts of £14bn less EIB and other of £bn = Post-transition net payments £23bn (£17bn approved expenditure not paid + £13bn pension obligations - £7bn share of EU assets).

The €47.5bn (£42bn) receivable from the UK included in the recently published EU 2020 accounts caused a kerfuffle last week, as excitement levels grew over what turns out to be a pretty much unchanged estimate for the post-transition element of the UK-EU financial settlement.

ICAEW’s chart of the week attempts to reconcile the £39bn estimate calculated by HM Treasury back in 2018 with the €47.5bn (£42bn) receivable recorded by the EU in its financial statements on 31 December 2020, the last day of the transition period. Perhaps surprisingly, given recent press coverage, ICAEW’s analysis is that the estimate for the post-transition element of the settlement of £23bn remains unchanged overall.

Much of the confusion arises because the £39bn estimate made by HM Treasury in 2018 was a net number, reflecting forecasts of gross payments to the EU by the UK government less anticipated payments by the EU and EU-related institutions back to the UK.

The chart starts by analysing the £39bn estimate into its four main component parts: Net transition payments of £16bn, the UK’s share of approved expenditure not yet paid of £19bn and pension contributions of £11bn less the UK’s share of EU assets of £7bn, with the last three elements amounting to a net £23bn amount to be settled in the post-transition period.

The transition element of £16bn is now in the past, reflecting membership dues for the then anticipated transition period of 1 April 2019 to 31 December 2020 less money coming back from the EU to the UK over the same period. In the end, this turned out to be a couple of extensions in the UK’s period of membership that resulted in a shorter transition period from 1 February to 31 December 2020 – a switch in classification for some of the £16bn from post-EU transition payments to pre-EU exit net membership cost.

The UK’s share of approved expenditure not yet paid of £19bn was also a net number, reflecting a gross amount payable to the EU for ongoing programmes at the end of 2020 less amounts coming back the other way. The OBR has been working to an estimate of €296bn for the balance of approved expenditure not paid (also known as reste á liquider or RAL), which compares with €294bn in the notes to the EU accounts once adjustments were applied to the overall total of €303bn that the EU was committed to spend as at 31 December 2020. 

The calculated receivable of €35bn or £31bn does not reflect an estimated £14bn of payments by the EU to UK participants in these programmes, for example to British universities and research institutions, giving rise to a net amount in the order of £17bn, a couple of billion below the original estimate.

This slightly smaller net outflow is offset by a larger pension liability in the EU accounts, driven by a lower discount rate than originally anticipated. The UK’s €14bn or £13bn share of the €116bn liability is therefore higher than the €12bn or £11bn share of a €96bn liability that was previously forecast. In practice, the value attributable to this balance will change over time given that payments are expected to continue to 2064 or later.

Another area where the EU accounts do not provide the complete story is in the UK’s share of assets it expects to receive back as part of the withdrawal agreement. The €2bn amount in the EU accounts primarily relates to the UK’s share of fines, but it excludes the return of UK shareholdings in EU-related institutions that are owned by member states outside of the scope of the EU consolidated financial statements. Of the £5bn in this category, €3.5bn or £3bn relates to the return of the UK’s share capital in the European Investment Bank.

Despite the numbers being pretty much as expected, there still remains some uncertainty concerning the £23bn post-transition estimate in relation to the calculation of the amounts coming back to the UK, and HM Treasury and the OBR will no doubt continue to refine these estimates over the next few months and years.

The financial settlement is not the end of the UK’s financial engagement with the EU as the government has agreed to participate in a number of EU programmes from 1 January 2021 onwards, for example in Horizon pan-European scientific research, as well as working with the EU on international development programmes funded from the aid budget.

This chart was originally published by ICAEW.

ICAEW chart of the week: OBR climate change scenarios

Our chart this week is on the OBR Fiscal Risks Report, highlighting how delaying action to achieve net zero could double the cost to the public finances compared with acting more quickly.

Chart show public debt change in 2150-51 as % of GDP for different scenarios: Investment switch and motoring tax -12%, early action high productivity +10%, early action scenario +21%, early action low productivity +32%, late action scenario +43%, unmitigated climate change +38%. The final column for unmitigated climate change also has the public debt change in 2100-01% of +161%.

With two ‘once in a century’ events in less than two decades adding more than £1tn to public debt, it is unsurprising that the OBR’s Fiscal Risks Report published earlier this week places much more emphasis than previous reports on the potential for catastrophic risks, whether that be from further pandemics, major wars, climate change or cyberattacks.

The report focuses on three particular risks: the coronavirus pandemic, the cost of debt, and climate change, with the latter being the subject of the #icaewchartoftheweek. 

The OBR distinguishes fiscal risks from climate change between those stemming from global warming itself (physical risks) and those relating to the move to a low-carbon economy, including the policies to achieve that (transition risks). In unmitigated climate change scenarios, the physical risks dominate, whereas the more that is done to mitigate global warming by reducing emissions, the more important transition risks become. 

The chart illustrates two main scenarios explored by the OBR – an early action scenario where the UK and other governments around the world push forward with plans to achieve net zero by 2050 and a late action scenario where the UK government delays taking actions to decarbonise the economy. The chart also shows three variants on the early action scenario depending on whether decarbonisation boosts or damages productivity or where investment is switched from other areas and motoring taxes retained. 

In the early action scenario, the OBR estimate that public sector debt would rise by 21% of GDP by 2050-51 (equivalent to £469bn in current prices) as a consequence of lost fuel duties and other taxes of 19%, additional spending of 6%, indirect economic effects of 6% and interest on borrowing of 4% less 14% from carbon taxes imposed to incentivise the shift to net zero. 

The high productivity variant is similar in terms of costs and carbon tax receipts, but with indirect economic effects contributing additional tax receipts with a consequent reduction in borrowing costs over 30 years, resulting in net additional debt of 10% of GDP. The low productivity variant assumes the reverse with lower tax receipts and a smaller economy combining to increase the net increase in public debt to 32% of GDP. The other variant identified by the OBR has the effect of reducing public debt, where investment in decarbonisation is funded by cutting other public investment plans and existing motoring taxes are shifted onto electric cars to retain that source of income to the exchequer.

A key finding in the report is that delaying action would cost a lot more than moving early with public sector debt rising by 43% in 2050-51, more than double the early action scenario, as it would require a more radical intervention costing more and resulting in more adverse economic effects.

Ironically, the OBR estimates that doing nothing would have a smaller impact on net debt by 2050-51 than the late action scenario as decarbonisation costs would not be incurred. However, the OBR estimates that unmitigated climate change would have a significant impact for the rest of the century, with public debt potentially rising to 289% of GDP by 2100-01 if action is not taken to prevent temperatures rising around the world.

For more information read the OBR Fiscal Risks Report.

This chart was originally published by ICAEW.

ICAEW chart of the week: UK population of 67.1m

This week’s chart covers the pre-census population estimate of 67.1m for June 2020 just released by the Office for National Statistics. Do more deaths, fewer births and returning migrants mean the 2021 number will be smaller?

Map of UK with nations and regions in different shades and labels with populations: Scotland 5.5m, North East 2.7m, Yorkshire and the Humber 5.5m, East Midlands 4.8m, East of England 6.3m, London 9.0m, South East 9.2m, South West 5.7m, West Midlands Region 5.9m, Wales 3.2m, North West 7.4m, Northern Ireland 1.9m.

ICAEW’s chart of the week is based on the UK population estimate for June 2020 released by the Office for National Statistics (ONS) on 25 June 2021, which estimates that there were 67.1m people living in the UK last summer. This is the last estimate before the March 2021 census that should provide a more accurate count of the population – potentially leading to revisions to this and previous estimates over the last few years.

The population estimate comprises 56.5m people in England, 5.5m in Scotland, 3.2m in Wales and 1.9m in Northern Ireland. Within England there were 9.0m in London, 9.2m in the South East, 6.3m in the East of England, 4.8m in East Midlands, 5.5m in Yorkshire & the Humber, 2.7m in the North East, 7.4m in North West (including 2.8m in Greater Manchester), 5.9m in the West Midlands (including 2.9m in the West Midlands city-region), and 5.7m in the South West.

The median age for the population was 40.4 years old, with 19.8m aged between 0 and 24, 21.8m from 25 to 49, 19.7m from 50 to 74 and 5.8m aged 75 or more.

The ONS reports that the population increased by 284,000 or 0.43% from 2019 comprising a ‘natural’ increase of 32,000 (701,000 births less 669,000 deaths), net migration of 247,000 (immigration of 622,000 less emigration 375,000) and other movements of 5,000. This is a fall from the 361,000 increase seen in the previous year, primarily because of the coronavirus pandemic from mid-March 2020 to June 2020, when deaths increased and migration went into reverse.

The big question is whether the population may actually shrink when the 2021 census is reported, with deaths from the second and third waves of the pandemic, a further decline in the birth rate and a potential outflow of migrants combining to reduce the population for the first time since 1982.

This chart was originally published by ICAEW.