ICAEW chart of the week: Commonwealth Games

Our chart this week marks the start of the XXII Commonwealth Games in Birmingham, illustrating how the numbers of events and competitors have grown since the first games in 1930 to reach 280 events featuring 5,054 competitors in 2022.

Combined line and column chart showing medal events for each games (columns) and number of competitors (line).

Games: I-III every four years from 1930 to 1938, IV-XII every four years from 1950 to 2022.

Medal events I-X: 50, 68, 71, 88, 91, 94, 104, 110, 121, 121; XI-XX: 128, 142, 163, 204, 217, 213, 281, 245, 272, 261; XXI-XXII: 275, 280.

Competitors: 400 in 1930 through to 5,054 in 2022.

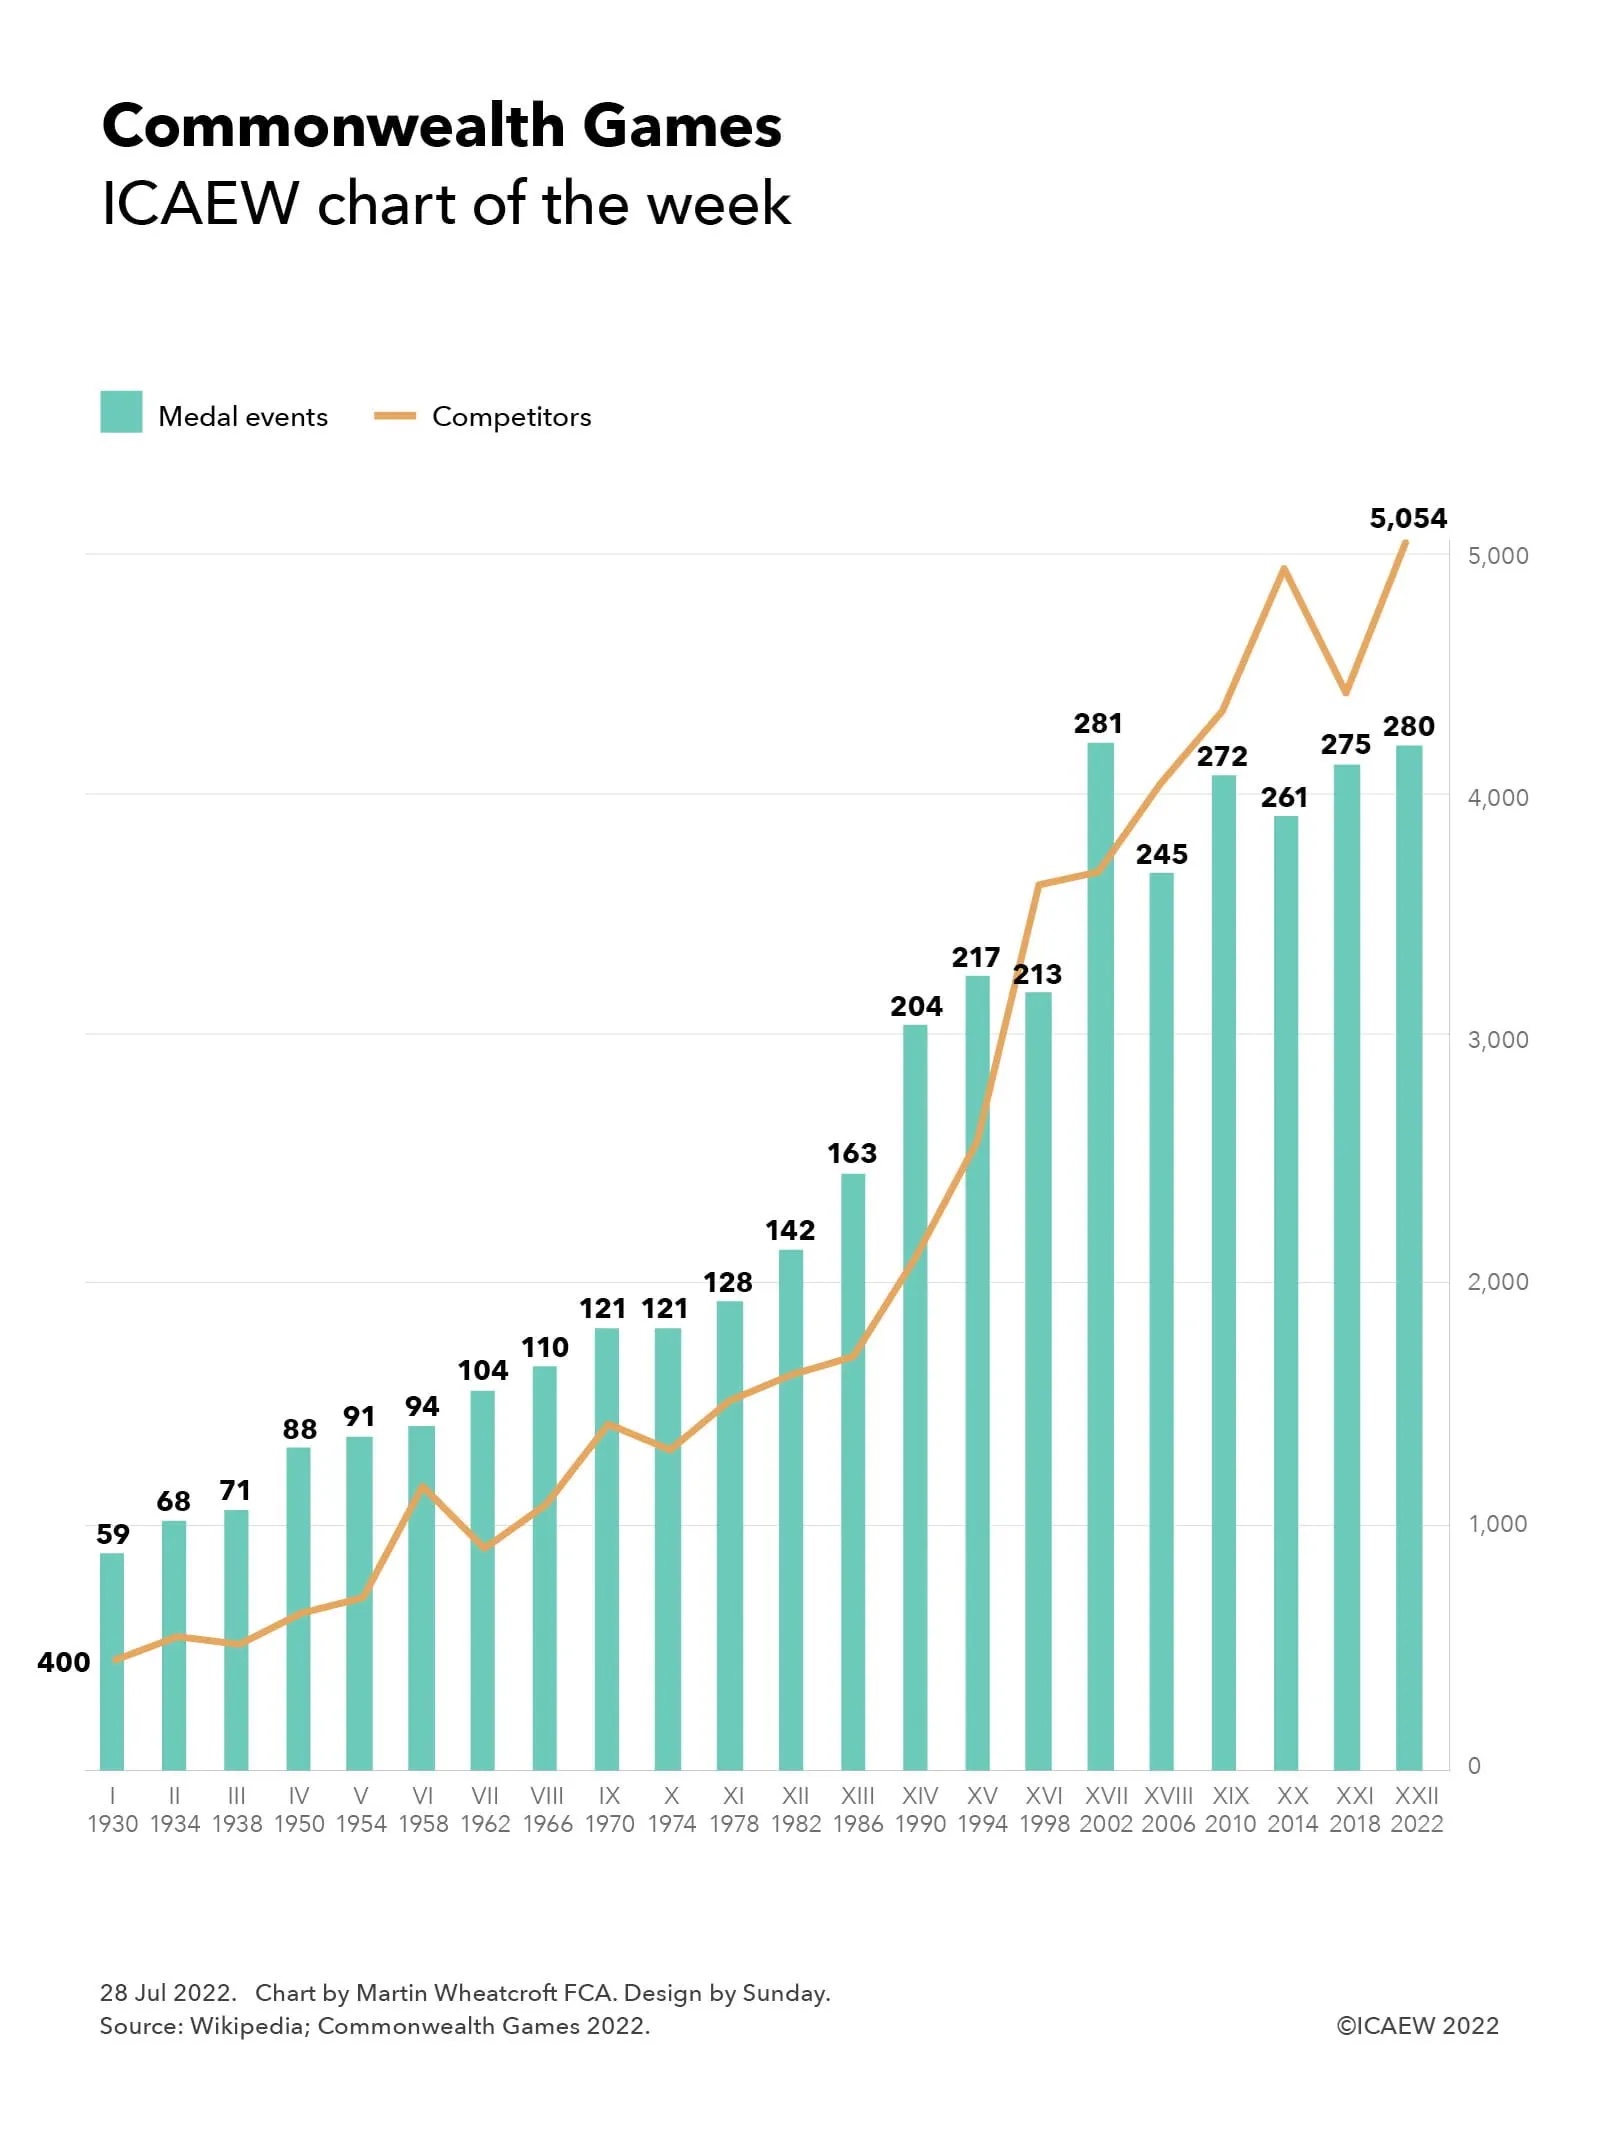
The XXII Commonwealth Games in Birmingham, from 28 July to 8 August, involves a record 5,054 competitors from 72 teams participating in 280 events in 20 sports. This is many times the 400 or so competitors from 11 teams that competed in 59 events in six sports at the inaugural British Empire Games in Hamilton, Canada, in 1930.

Although much smaller than the Olympic Games, the Commonwealth Games is still a major undertaking with a budget for Birmingham 2022 approaching a billion pounds, including £778m of public funding, of which £594m is from central government and £184m is from Birmingham City Council, West Midlands city region and other local sources.

The main focus will be on sporting performance, with events in aquatics (12 diving, 52 swimming), athletics (58), badminton (6), 3×3 basketball (4), beach volleyball (2), boxing (16), cricket T20 (1), cycling (20 track, 4 road, 2 mountain biking), gymnastics (14 artistic, 6 rhythmic), hockey (2), judo (14), lawn bowls (11), netball (1), para powerlifting (4), rugby sevens (2), squash (5), table tennis (11), triathlon (5), weightlifting (16) and wrestling (12).

Birmingham 2022 is the first games to have more than 5,000 competitors, although with 280 medal events there is one less than the 281 that featured in Manchester 2002.

England, as the host nation, will be hoping to improve on its performance at the Gold Coast 2018 games, when it came second in the medal table with 136 medals (45 gold, 45 silver, 46 bronze) to Australia, who won 198 medals (80, 59, 59) on their home turf. India with 66 medals in 2018 (26, 20, 20), Canada with 82 (15, 40, 27), New Zealand with 46 (15, 16, 15), South Africa with 37 (13, 11, 13), Wales with 36 (10, 12, 14) and Scotland with 44 (9, 13, 22) will also be looking to do well.

For the participants, the efforts will be intense, while for spectators in the stadium and the audience at home, the nail-biting tension of the lawn bowls competition will be just one of many gripping sporting events to be enjoyed this summer.

This chart was originally published by ICAEW.

ICAEW chart of the week: Olympinflation

Our chart this week shows how the Summer Olympics has grown from 43 medal events and 241 competitors in Athens in 1896 to 339 medal events attracting 11,326 competitors in the Tokyo Summer Olympics this year.

Olympinflation chart comprising columnsfor number of medal events and a line for competitors:

Medal events: 43 in 1896 to 95 in 1904 to 102 in 1912 to 156 in 1920 to 109 in 1928 to 129 in 1936 to 149 in 1852 to 150 in 1960 to 172 in 1968 to 198 in 1976 to 231 in 1984 to 257 in 1992 to 271 in 1996 to 300 in 200 to 302 in 2008 to 306 in 2016 to 339 in 2021.

Competitors from 241 in 1896 up to 3,089 in 1924 down to 1,332 in 1932 up to 3,936 in 1936 up to 4,955 in 1952 down to 3,314 in 1956 up to 7,134 in 1972 down to 5,179 in 1980 up to 10,651 in 2000 down to 10,625 in 2004 up to 10,942 in 2008 down to 10,768 in 2012 up to 11,326 in 2021.

Our chart this week shows how the Summer Olympics has grown from 43 medal events and 241 competitors in Athens in 1896 to 339 medal events attracting 11,326 competitors in the Tokyo Summer Olympics this year.

The arrival of the Summer Olympics has turned many of us into experts in obscure sports that never normally crossed our minds, as well as thrilling us with seeing the world’s top athletes compete to be the best in the sports we love. The sheer scale of sporting activity is immense as it turns a global audience into athletic couch potatoes over a period of two weeks every four years – or five on this particular occasion with the delay to 2021 because of the pandemic. Despite the absence of spectators, so far the Games have been gripping as tiny margins have determined who gets gold, silver or bronze or who comes home without a medal, but still the privilege of being an Olympian.

Our chart this week illustrates how the Summer Olympics has grown in scale over time. The Tokyo Summer Olympic Games continued the upward path in the number of medal events, with 339 medal events in 50 sporting disciplines from 33 sports and 11,326 competitors from 206 nations. This compares with 43 medal events in 10 disciplines from 9 sports in the first Summer Olympiad in 1896, involving just 241 competitors from 14 nations.

New sports this year include karate, skateboarding, sports climbing, surfing and (the return of) baseball/softball, providing new opportunities for competitors to show their talents to the world, and for the rest of us to add to our fleeting knowledge of what it takes to ride a skateboard in an organised format or the technicalities of riding a wave to score points. These add to the existing sports of aquatics, archery, athletics, badminton, basketball, boxing, canoeing, cycling, equestrian, fencing, field hockey, football, golf, gymnastics, handball, judo, modern pentathlon, rowing, rugby sevens, sailing, shooting, table tennis, taekwondo, tennis, triathlon, volleyball, weightlifting and wrestling.

The Olympics will be over all too soon, leaving us bereft and demanding more. Fortunately, the Paralympics will be starting on 24 August with 540 medal events in 22 sports to keep us glued to our screens this summer.

Chart of the week will be taking its customary break during August and will return in September, while the Summer Olympics will hopefully be taking a shorter than usual three-year break to return to schedule with the Paris 2024 Summer Olympics.

This chart was originally published by ICAEW.

ICAEW chart of the week: Tokyo Olympics cost update

Cost overruns have been a recurring feature of the modern Olympic movement, but the pandemic has blown the doors off the budget for the Tokyo games.

Tokyo Olympics cost update - column chart:

Budget v1 £5.2bn
Budget v2 £9.0bn
Budget v3 £9.0bn
Budget v4 £9.4bn (venues £4.7bn, Games £2.9bn, marketing and general £1.6bn)
Budget v5 £11.0bn (venues £5.4bn, Games £4.0bn, marketing and general £1.6bn) + Outside the Games costs £12.5bn = 
Estimate of £23.5bn (Organising Committee £4.7bn, Tokyo Metropolitan Government £10.2bn, Government of Japan £8.6bn)

Hosting an Olympics is a costly affair, with headlines about budget overruns a regular occurrence in recent decades. The Tokyo Olympics is no exception, with the latest official budget for the rescheduled 2020 Olympic Games rising to ¥1.7tn ($15.4bn or £11.0bn) compared with an original budget of $7.5bn or £5.2bn. 

Of course, nobody expected the original budget from Tokyo’s bid in 2013 to be the final result, but annual budgets since 2017 have shown a gradual rise in both the cost of running the Olympic Games and the cost of the venues. This would be unsurprising to those that remember the 2012 London Olympics, where the costs significantly exceeded the estimated overheads set out in the original bid.

The version two budget established in December 2017 of £9.0bn, comprising £4.7bn for venues, £2.4bn for running the Games and £1.9bn for marketing, communications and general expenditures was substantially maintained in version three with offsetting increases and decreases in different parts of the budget. Additional income allowed the organisers to add in a contingency to increase the budget to £9.2bn by 2019, with the budget for venues still £4.7bn, running the Games up to £2.9bn (including the contingency) and marketing and general expenditures down slightly to £1.6bn.

The pandemic drove a big jump in the version five of the budget, put together six months after the 2020 Games were supposed to have taken place. The budget for venues (permanent, temporary and energy costs) went up to £5.4bn, up from £4.7bn in previous budgets, while the version five budget for running the Games (transport, security, technology and operations) of £4.0bn is a third more than the 2019 estimate of £2.9bn and more than 60% higher than the 2017 estimate of £2.4bn, with marketing and general expenditures still at £1.6bn.

Not shown in the chart is the expected revenue that was anticipated to fund the Tokyo Organising Committee’s share of costs of £4.7bn, comprising £0.6bn from the International Olympic Committee (the IOC, which owns the global broadcasting rights), £2.8bn from sponsorship and licencing, £0.6bn from ticket sales and £0.7bn in other revenues. With tickets being refunded to spectators who can no longer attend, this leaves a hole in the Organising Committee’s finances that will need to be funded either by the IOC or by the Tokyo Metropolitan Government.

The chart also illustrates how the official budget for the Olympics is not the full story, with the Tokyo Metropolitan Government and the Japanese Government incurring a further £12.5bn or so in costs outside the Games, in addition to their already substantial contributions to the cost of venue construction. There are some disputes about these numbers as their spending include ‘legacy’ investments in public infrastructure that could be argued should not be counted, in addition to costs with a direct causal linkage, such as policing and security costs away from Olympic venues. The £12.5bn amount is based on AP reporting of a Japan Board of Audit report from 2019, but recent reports in the Japanese press have suggested the costs to the metropolitan and national governments of hosting the Olympics could end up being even larger.

While the pandemic was not foreseeable back in 2013 when Tokyo was awarded the 2020 Olympics, the budgetary tale highlights the importance of building in headroom for changes as well as considering contingencies when setting budgets. For example, there was insurance cover to deal with the risk of an event like the pandemic leading to a cancellation of the Games, but the insured amounts were insufficient to cover the full losses of a complete cancellation. This is no doubt one (but not the only) reason why the organisers are going ahead despite everything that has happened.

Fortunately for those of us who like watching sport on our screens, the Olympic Games and the Paralympic Games are going ahead after all and it is the performance of the athletes that will be our main focus for the next few weeks. We wish them the best of luck!

This chart was originally published by ICAEW.