This week’s chart highlights how the VAT deferral scheme is almost entirely behind higher VAT receipts in recent quarters, providing a note of caution to recent media headlines welcoming bumper tax revenues.
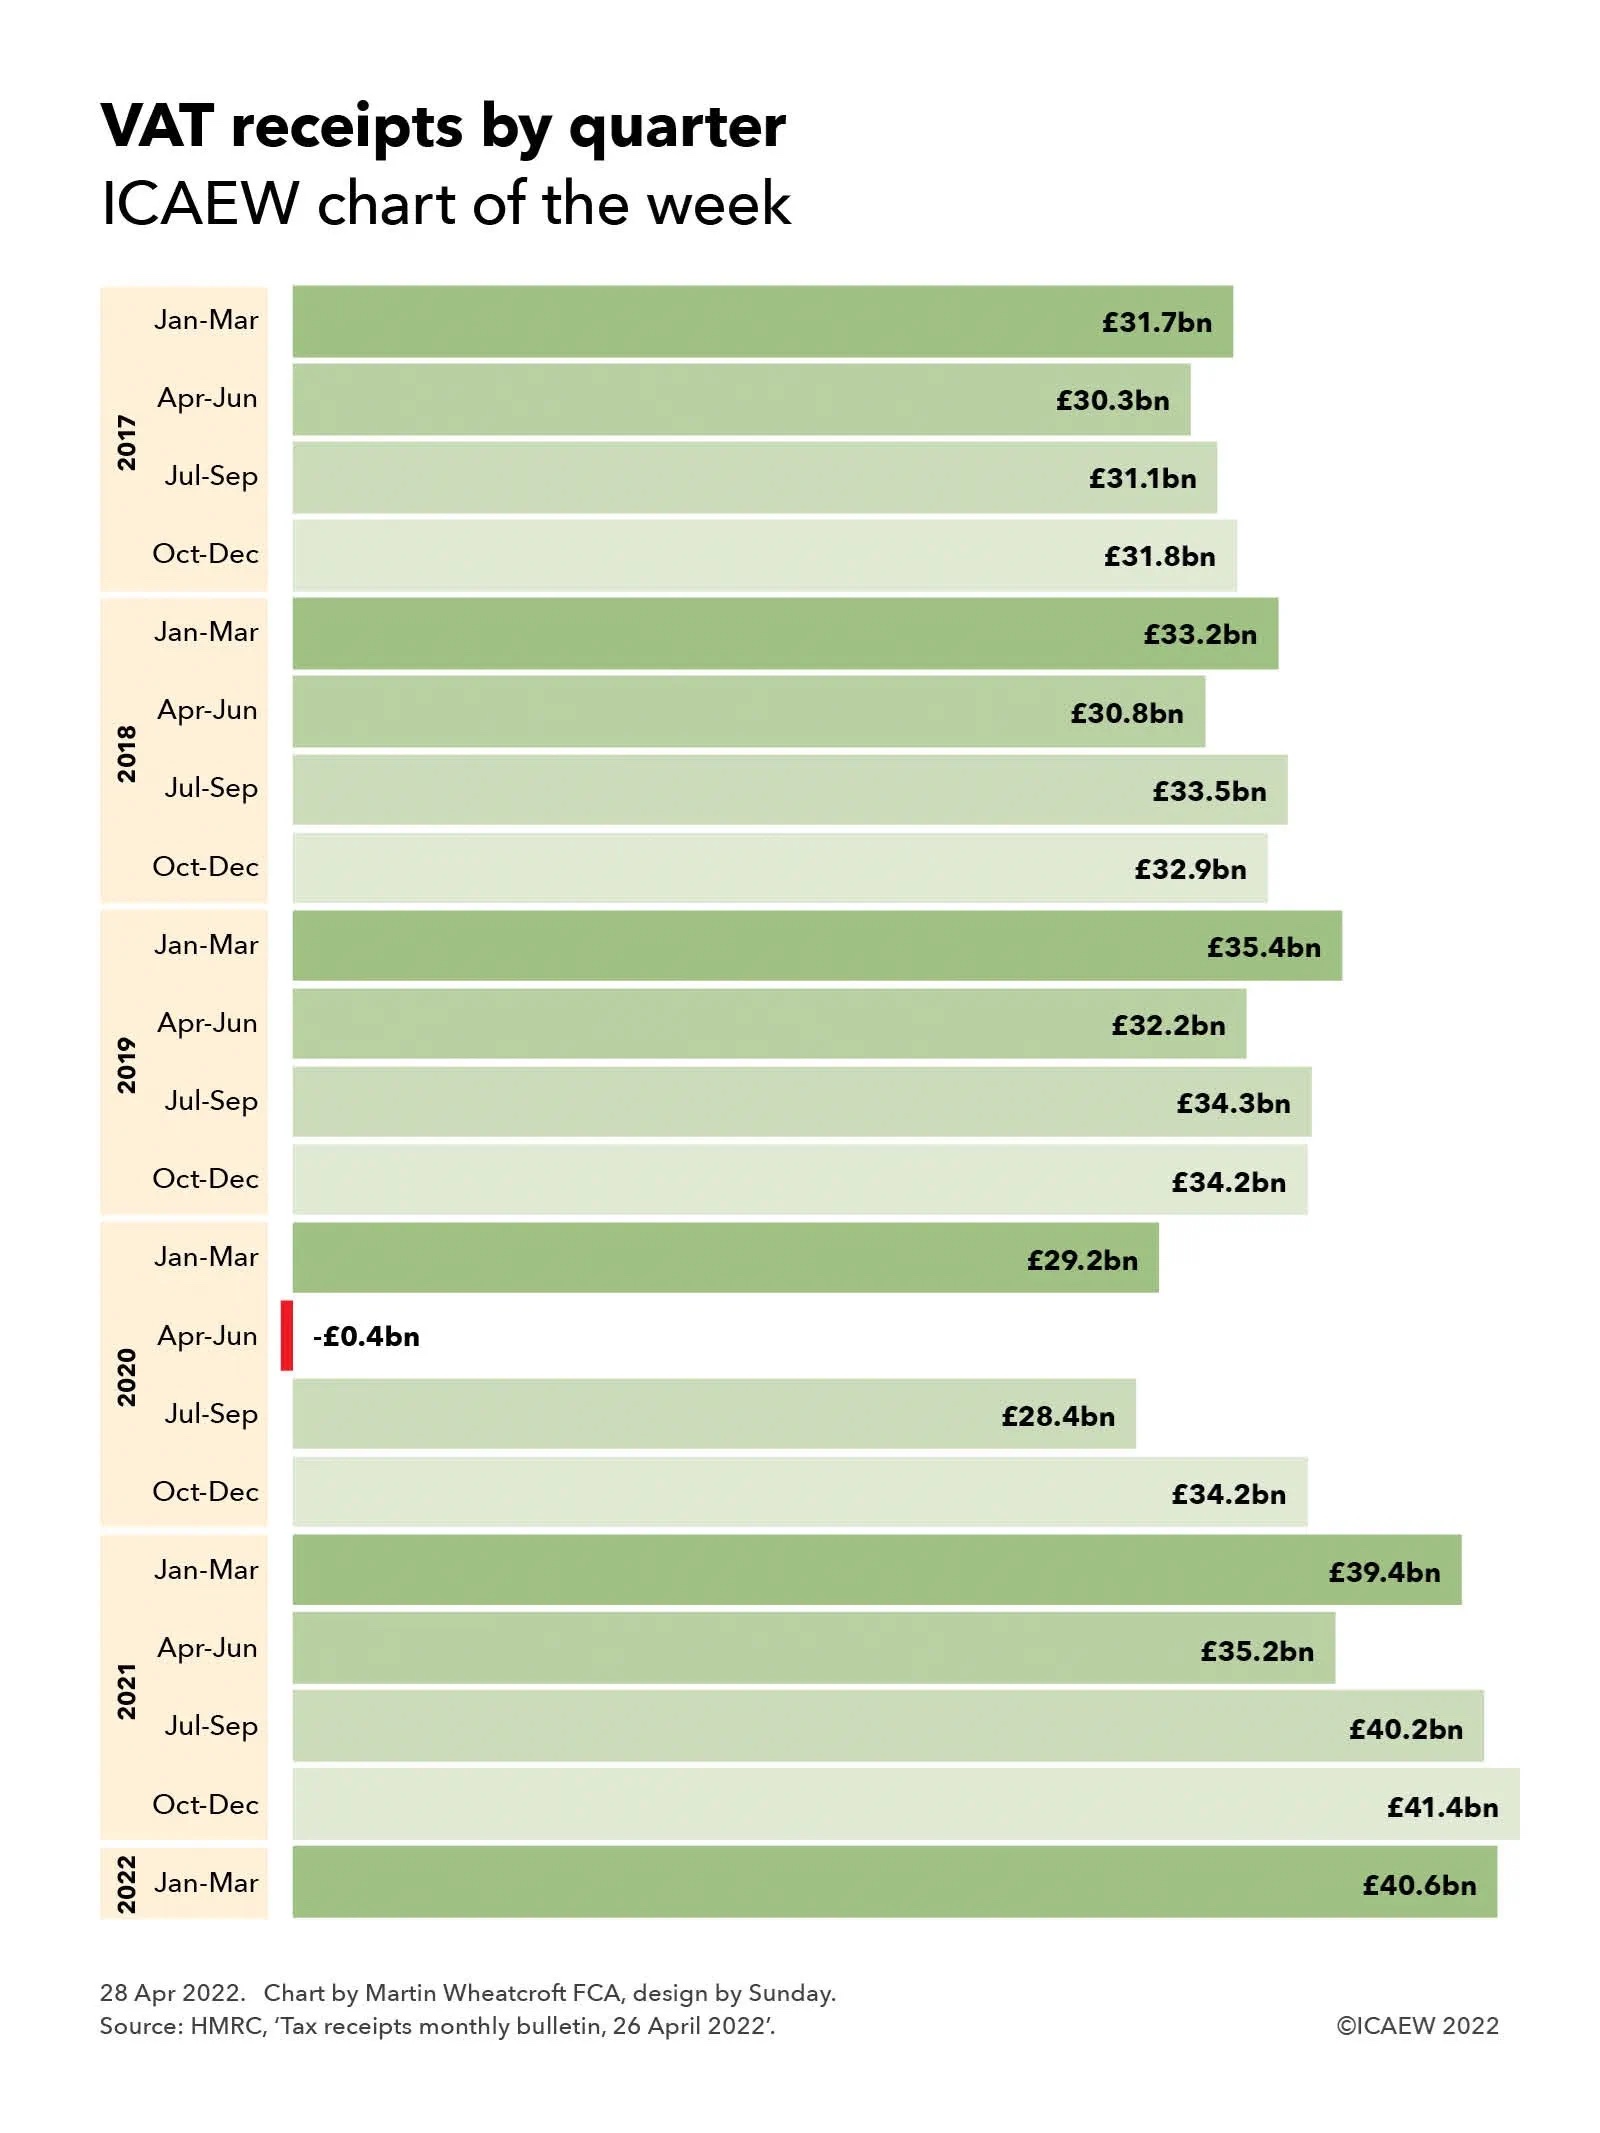
The ICAEW chart of the week is on the topic of VAT, illustrating the quarterly pattern of VAT receipts since 2017 according to the HMRC tax receipts and national insurance contributions monthly bulletin published on 26 April.
The chart highlights how VAT receipts have grown steadily since 2017 up until the start of the pandemic, with receipts in calendar quarters of £31.7bn (Jan-Mar), £30.3bn (Apr-Jun), £31.1bn (Jul-Sep) and £31.8bn (Oct-Dec) in 2017; £33.2bn, £30.8bn, £33.5bn and £32.9bn in 2018; and £35.4bn, £32.2bn, £34.3bn and £34.2bn in 2019. This was followed by a big dip in 2020, with £29.2bn in Jan-Mar 2020, a net negative outflow of -£0.4bn in Apr-Jun, £28.4bn in Jul-Sep and £34.2bn in Oct-Dec 2020. In 2021, VAT receipts strengthened, with £39.4bn, £35.2bn, £40.2bn and £41.4bn by quarter, followed by £40.6bn in Jan-Mar 2022, the last quarter of the 2021/22 fiscal year.
The significant drop in VAT receipts in 2020 was driven by a combination of the economic contraction caused by the pandemic, cuts in VAT rates for hospitality, and – most significantly – £33.5bn in deferrals under the VAT payments deferral scheme implemented at the time of the first lockdown in 2020. This is the primary driver of the negative VAT receipts in the Apr-Jun quarter 2020 highlighted in the chart.
The original intention was that VAT deferred from 2020 would be due by no later than 30 June 2021, however, further relief in the form of a monthly instalment plan allowed VAT-registered businesses to spread the payment of the deferred VAT over the rest of the 2021/22 fiscal year. This has boosted the last three quarters of VAT receipts shown in the chart.
HMRC reports that £31.3bn of the VAT deferred was carried forward in 2021/22, which would imply a swing between financial years in the order of £60bn. This is greater than the £56bn increase in VAT receipts seen between the £101bn recorded for the four quarters to March 2021 and the £157bn in the following four quarters constituting the 2021/22 fiscal year.
VAT receipts excluding the effect of the deferral scheme may therefore have decreased in the last four quarters, which is surprising in the context of rising prices and the end of the discounted VAT rate for hospitality.
Recent media headlines reporting a bumper tax windfall for the Chancellor should therefore be treated with some caution. While tax receipts in 2021/22 have been much stronger than expected, a significant element of the increase relates to the collection of VAT held over from the previous year and not to any genuine increase in underlying tax revenues.