My chart this week illustrates how five or seven different personal tax bands are expected in the coming financial year, despite the top rate of income tax being abolished.
Amid market chaos it might be forgotten that the ‘mini’ Budget was primarily about reforming the personal tax system. In abolishing the 45% top rate of income tax from 6 April 2023 onwards, the Chancellor simplified the tax system by removing the personal tax band that currently applies to earnings above £150,000.
Despite that simplification, our chart this week highlights how the personal tax system remains quite complicated, much more than might be assumed based on just two rates of income tax (19% and 40%), two rates of national insurance (12% and 2%) and recent alignment in income tax and national insurance thresholds.
In practice, our chart is an oversimplification, as it does not attempt to incorporate welfare benefits and hence the full complexity of how people are ‘taxed’ as their incomes rise – for example the 55% taper rate at which universal credit is withdrawn from those on the lowest incomes. It also does not attempt to reflect the tax treatment on non-earned income such as dividends, interest and capital gains, nor the intricacies of how pension contributions or other tax reliefs are dealt with.
Nor does it show the different rates of income tax applicable in Scotland, which currently has three more tax bands than elsewhere in the UK and is likely to continue to do so once the Scottish Budget establishes tax rates for next financial year.
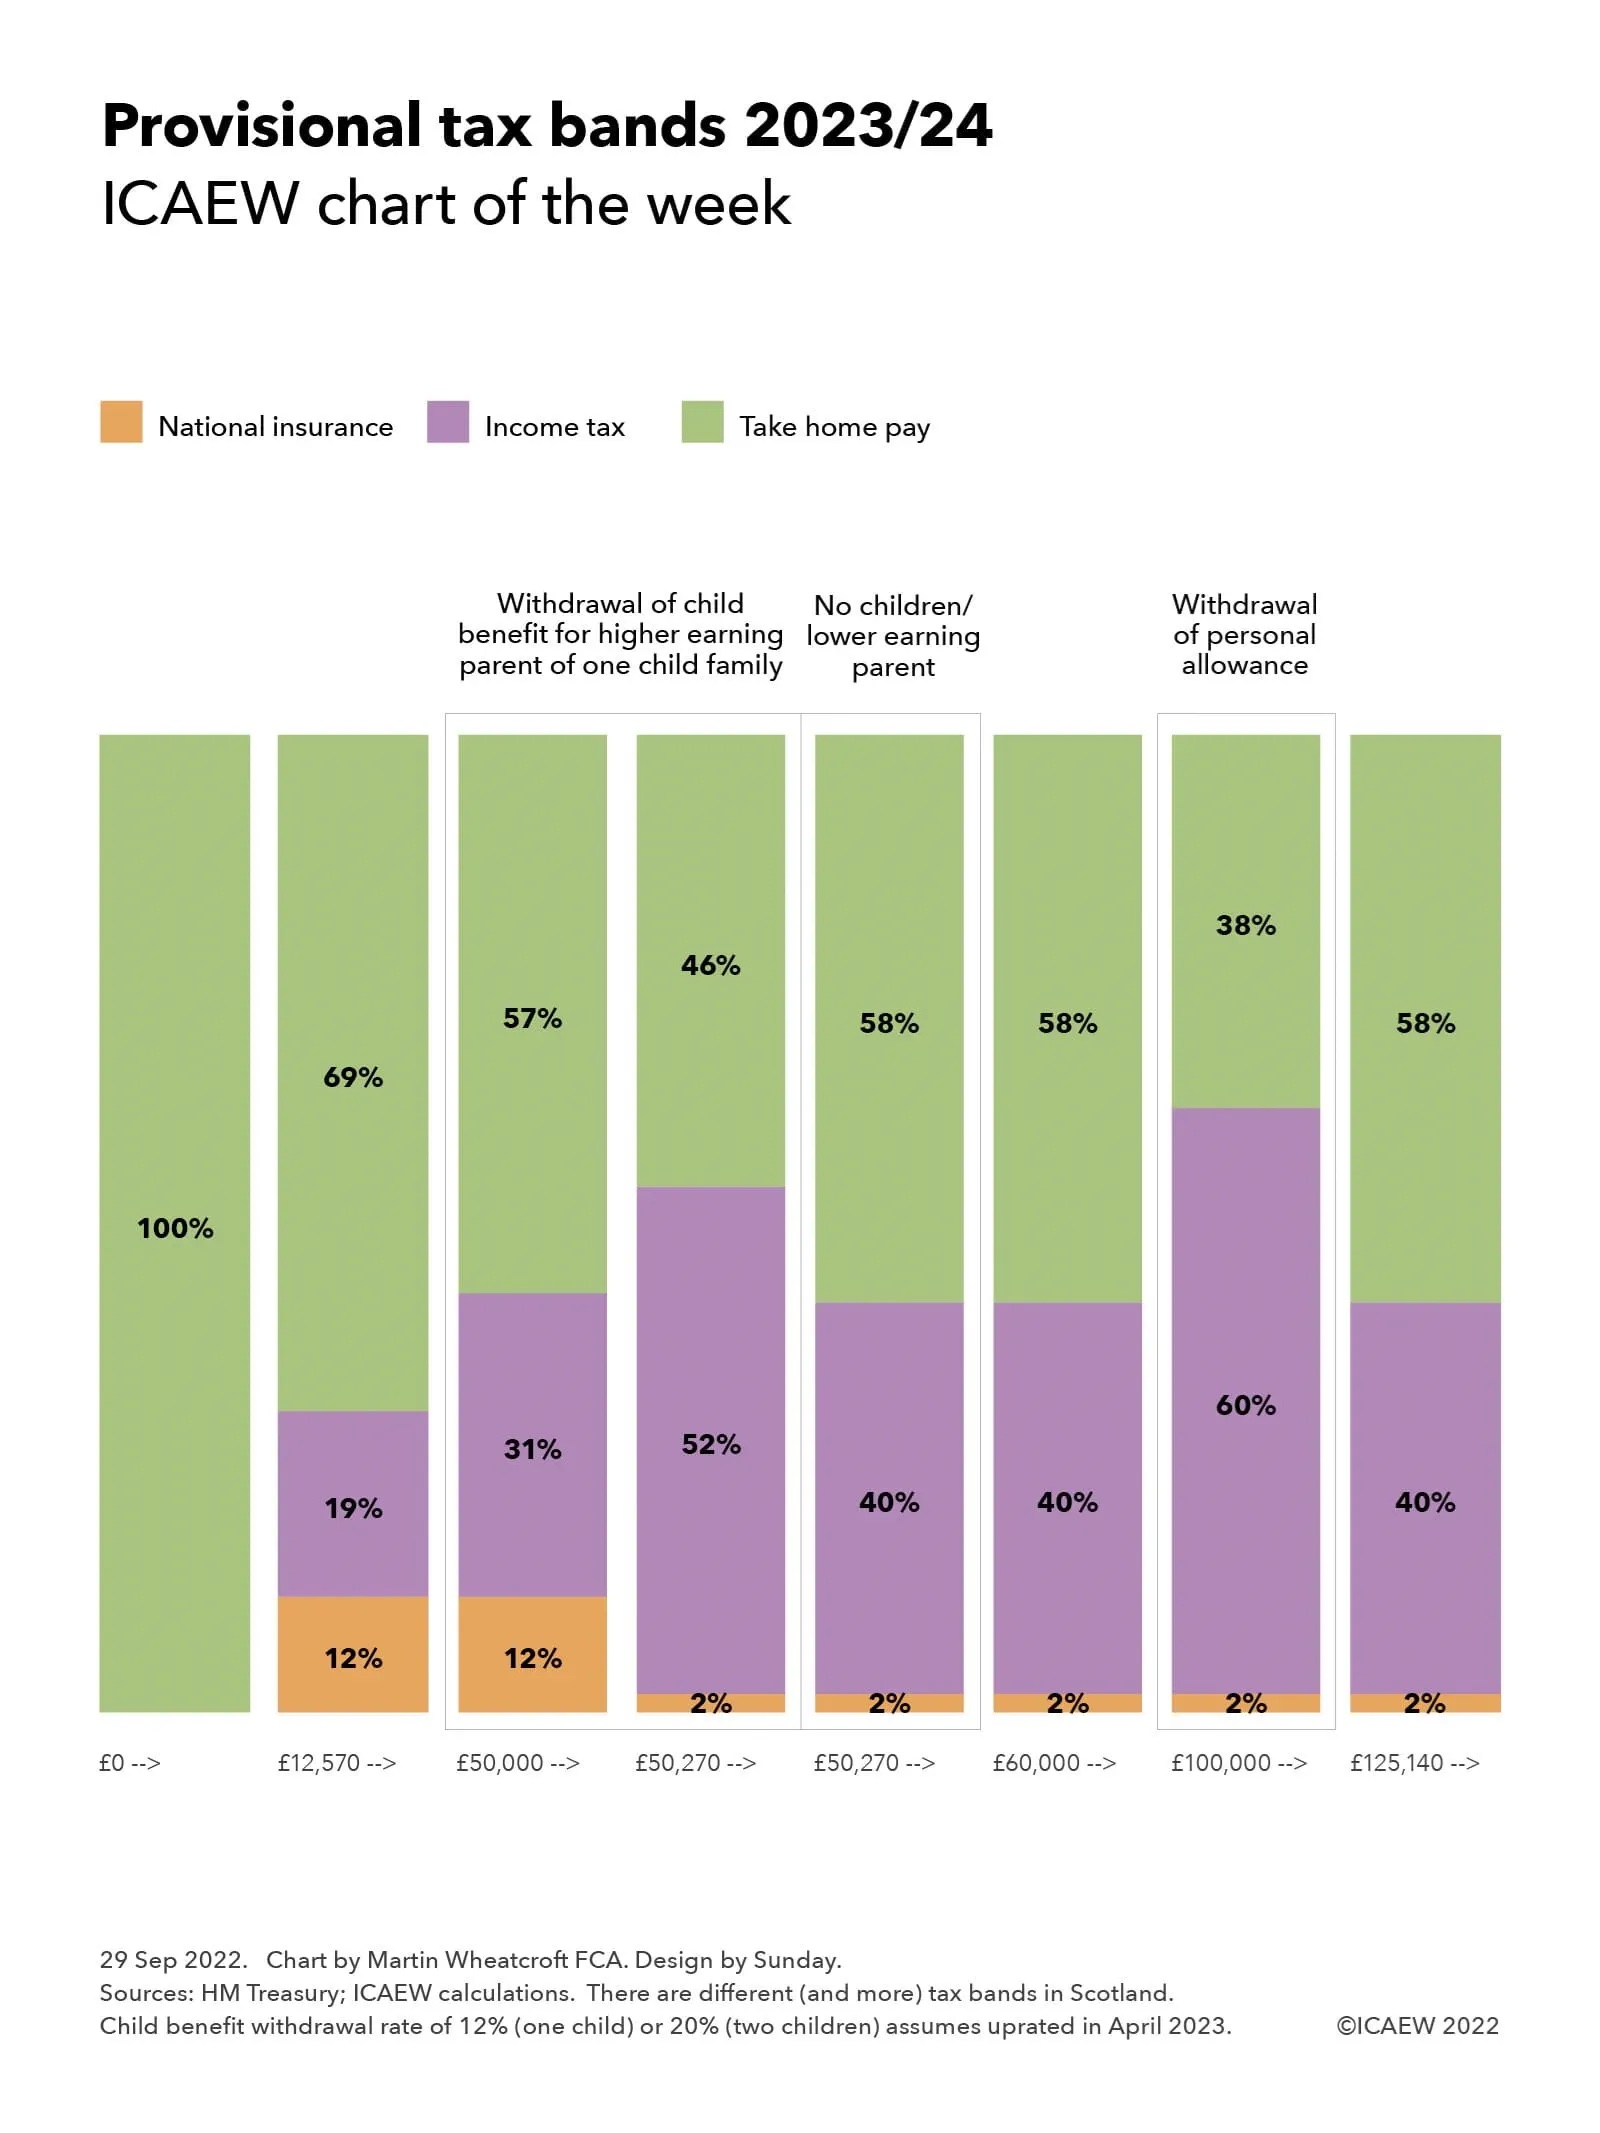
Our chart assumes the thresholds for personal income tax and national insurance remain frozen as currently planned, illustrating how there is no tax to pay on the first £12,570 of earned income – the first band in the UK’s personal tax system.
From this point upwards, income tax of 19% (a 1% cut from the current rate) and employee national insurance of 12% (a reduction from the 13.25% in force until next month) are expected to apply in 2023/24, a combined rate of 31% that reduces take-home pay to 69% of each extra pound earned.
These rates apply to earnings up to £50,000, when a strange quirk of the tax system comes into play if you are a parent with a child or children receiving child benefit. Assuming child benefit is uprated by inflation in April, then the amount clawed back between £50,000 and £60,000 from the higher-earning parent is likely to be equivalent to somewhere in the region of an extra 12% (for one child) or 20% (for two children). The quirk is the misalignment between the £50,000 at which child benefit starts to be withdrawn through the tax system and the £50,270 point at which the 40% higher rate of income tax rate and 2% lower rate of national insurance of £50,270 come into force.
This creates a small band where the higher-earning parent of one child faces a combined tax rate of 43%, followed by a band between £50,270 and £60,000 where a combined rate of 52% applies. Not shown in the chart is the even higher rates of tax for two children – 39% income tax + 12% national insurance and 60% income tax + 2% national insurance – or even higher for three or more children receiving child benefit.
For those without children, or for the lower-earning parent, there is a more straightforward jump as income exceeds £50,270, with an extra 21% taken as the income tax rate rises from 19% to 40%, partially offset by a 10 percentage-point reduction in national insurance from 12% to 2%.
Those without children and lower-earning parents should retain 58% of each pound of earnings over £50,270, as will higher-earning parents on incomes above £60,000.
For earnings above £100,000 the personal allowance is withdrawn, creating an extra tax band between £100,000 and £125,140 where there is a marginal income tax rate of 60%, which with 2% of employee national insurance means retaining 38% of each additional pound earned within this band. The new top band is above £125,140, where income tax reverts to 40%, which combined with 2% of national insurance results in 58% being retained for each extra pound earned.
With the current 45% top rate of tax abolished, there is no further band for earnings above £150,000, meaning that all incomes above £125,140 are taxed at a combined rate of 42%, at least before taking account of tax reliefs that might apply.
There have been suggestions that the Chancellor intends to attempt to simplify personal tax bands further, perhaps by abolishing the 60% tax rate between £100,000 and £125,140 by allowing higher earners to retain the personal allowance rather than have it withdrawn. A less expensive option would be to align the child benefit withdrawal threshold with that for the higher income tax rate, getting rid of the mini-tax band for higher-earning parents on incomes between £50,000 and £50,270.
We will no doubt discover whether the government’s new-found zeal to simplify the tax system will continue, or if they will revert to the longer-term trend of adding in new complications to the tax system whenever a little extra money needs to be found.