ICAEW chart of the week: Global GDP

My chart for ICAEW this week looks at the relationship between population and GDP around the world.
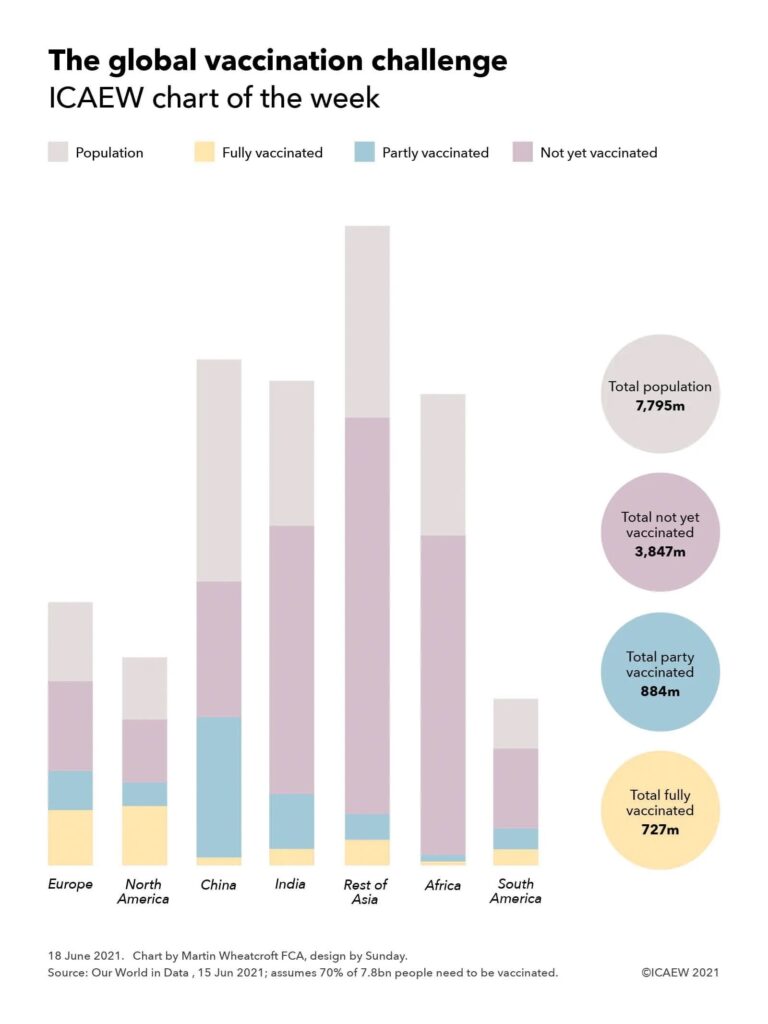
A three column chart each adding up to 100% with the central bar showing percentages of the global population, the left-hand bar showing percentages of market GDP. and the right-hand bar showing percentage of power-purchasing-parity (PPP) GDP. The bars are linked with lines to emphasise the relative proportions. 

US & Canada: Market GDP 29% - Population 5% - PPP GDP 16%. 
Europe: Market GDP 23% - Population 7% - PPP GDP 18%. 
China: Market GDP 17% - Population 17% - PPP GDP 20%.  
Rest of the world: Market GDP 24% - Population 28% - PPP GDP 30%. 
South Asia & China: Market GDP 7% - Population 43% - PPP GDP 16%. 

27 Jun 2025. Chart by Martin Wheatcroft. Design by Sunday. Source: IMF, 'World Economic Outlook Database, Apr 2025'.

According to the latest World Economic Outlook Database published by the International Monetary Fund in April 2025, the 387m people that live in the US and Canada, some 5% of the global population of 8.1bn, are together expected to generate about 29% of global economic activity as measured by GDP converted at market exchange rates in 2025. 

The US – the largest economy in the world – is expected to generate 27% with 4.3% of the global population, while Canada with 0.5% of the world’s people represents 2% of the global economy.

My chart this week also shows how the US and Canada together constitute 16% of the global economy using GDP converted on a Purchasing-Power-Parity (PPP) basis that adjusts for the relative cost of living between countries. The US is the world’s second largest economy on this basis with 15% of total economic output, while Canada represents 1.3% of the total.

Europe’s 602m people are 7% of the global population (excluding Russia, but including Georgia) and are expected to generate around 23% of global economic output at market exchange rates in 2025 or around 18% on a PPP basis. 

This includes the 452m people or 5.6% of the total living in the EU that generate 18% of global output or 14% on a PPP basis, the second largest economy on a market exchange rate basis and the third largest after adjusting for purchasing power. Germany with 1% population generates 4.3% and 3% of market GDP and PPP GDP respectively, followed by France (0.8% generating 2.9% and 2.2%), Italy (0.7% generating 2.2% and 1.8%), Spain (0.6% generating 1.6% and 1.4%), the Netherlands (0.2% generating 1.2% and 0.7%) and Poland (0.5% generating 0.9% and 1%). 

Outside the EU, the 70m people in the UK, 0.9% of the world’s total, generate 3.4% of global economic activity on a market exchange rate basis and 2.2% on a purchasing power basis.

China’s 1.4bn people constitute 17% of the world’s population and generate 17% of market GDP, in effect the average level of global economic activity on a per capita basis at current exchange rates. However, on a cost-of-living adjusted basis, they are the world’s biggest economy at 20% of PPP GDP and above average on a per capita basis.

The chart groups the rest of East Asia, South East Asia, Oceania, the Middle East, Russia, Central Asia, Latin America and the Caribbean into a ‘rest of the world’ category with 2.3bn people or 28% of the world’s population. They generate 24% of the global economy on a market exchange rate basis and 30% on a purchasing power basis.

This category includes the 10 ASEAN countries in South East Asia that together make up 8.5% of the world’s population, 3.6% of market GDP and 6.4% of PPP GDP led by Indonesia (3.5%, 1.2% and 1.4%). Others include Japan (1.5% population, 3.6% market GDP and 3.3% PPP GDP), Russia (1.5%, 2.3% and 3.5%), Türkiye (1.3%, 1.1% and 1.8%), Mexico (1.6%, 1.6% and 1.6%), South Korea (0.6%, 1.6% and 1.6%), Australia (0.3%, 1.5% and 1%), Brazil (2.6%, 1.0% and 2.4%), Taiwan POC (0.3%, 1% and 0.8%) and Saudi Arabia (0.4%, 0.8% and 1%).

The final category is South Asia and Africa, which together include many of the poorest countries on Earth, with 43% of the global population but just 7% of the global economy based on market exchange rates and 16% on a cost-of-living adjusted basis.

South Asia’s 2bn people are 24.3% of the world’s population, generating 4.4% of market GDP and 10.3% of PPP GDP. This includes India’s 1.5bn people (17.9% of the global population generating 3.6% and 8.5% respectively), the world’s fifth largest national economy at market exchange rates behind the US, China, Germany and Japan, and the third largest on a PPP basis behind China and the US. It also includes Pakistan (3% of the world’s people generating 0.3% and 0.8% of economic activity) and Bangladesh (2.1% generating 0.4% and 0.9%).

Africa’s 1.5bn people constitute 18.3% of the world’s total, generating just 2.7% of market GDP and only 5.3% of PPP GDP. This includes South Africa (0.8%, 0.4% and 0.5%), Egypt (1.3%, 0.3% and 1.1%), Nigeria (2.9%, 0.2% and 0.8%), Ethiopia (1.4%, 0.1% and 0.2%) and the Democratic Republic of the Congo (1.3%, 0.1% and 0.1%).

The chart illustrates how economic activity, both before and after adjusting for purchasing power, is weighted towards the US and Europe, while South Asia and Africa have a long way to go to become as prosperous.

While this may seem a stiff mountain to climb economically, China’s transformation over the last 30 years provides an example of what is possible, especially as ageing populations in many developed countries reduce their ability to grow as quickly as those countries with much younger demographics such as in South Asia and Africa.

As they say, watch this space.
This chart was originally published by ICAEW.

ICAEW chart of the week: Overseas travel

My chart this week is about visits abroad by UK residents, illustrating how people have started to travel again following restrictions during the pandemic.

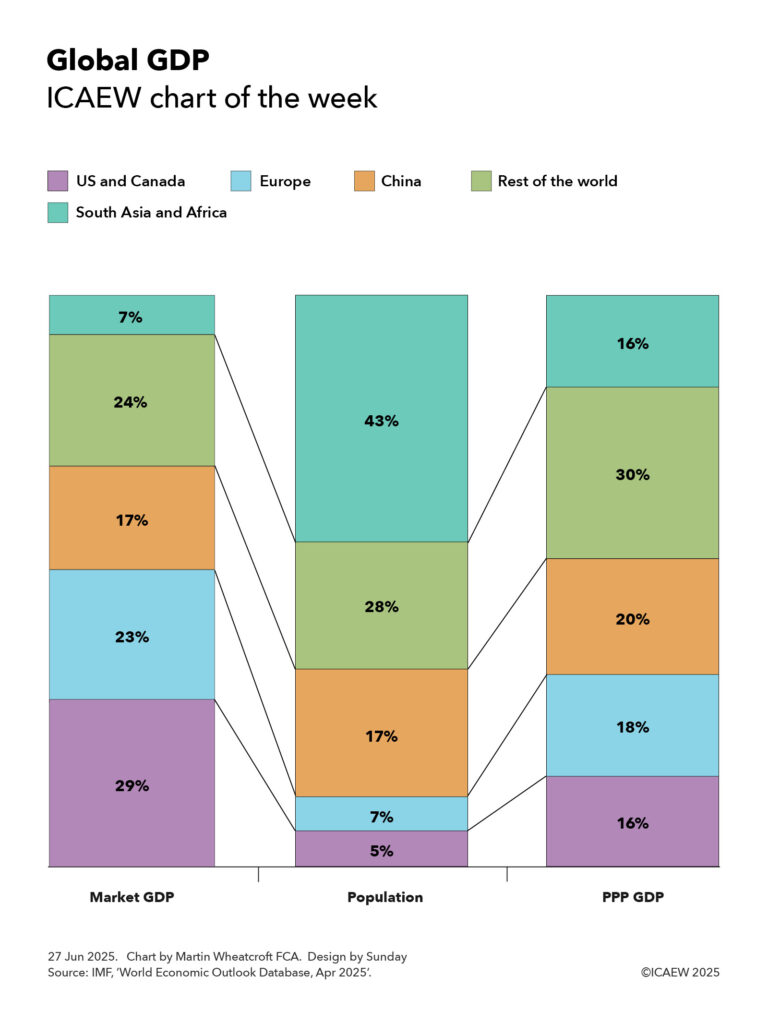
Column chart showing number of foreign trips by UK residents by calendar quarter.

2017: 15.9m, 23.7m, 28.7m. 18.9m
2018: 16.6m, 24.6m, 29.9m, 19.4m
2019: 18.2m, 25/8m, 30.0m, 19.2m
2020: 13.9m, 0.9m, 6/2m, 2.8m
2021: 0.9, 1.2m, 8.1m, 9.0m
2022: 9.4m, 20.4m

Visits abroad by UK residents have picked up following the depths of the pandemic but have yet to recover to pre-pandemic levels.

According to the Office for National Statistics, the number of visits abroad by UK residents by quarter amounted to 15.9m, 23.7m, 28.7 and 18.9m in 2017; 16.6m, 24.6m, 29.9m and 19.4m in 2018; 18.2m, 25.8m, 30.0m and 19.2m in 2019; 13.9m, 0.9m, 6.2m and 2.8m in 2020; 0.9m, 1.2m, 8.1m and 9.0m in 2021; and 9.4m and 20.4m in the first two quarters of 2022.

Although substantially higher than at the height of COVID-19 travel restrictions, trips abroad during the first half of 2022 were still substantially lower than before the pandemic. 

The 20.4m visits during the second quarter of 2022 comprised 15.1m to countries in the European Union, 1.3m to other European countries, 1.0m to North America and 3.0m to other countries around the world. Of these trips, 13.4m were for holidays, 5.1m were to visit friends or relatives, 1.4m for business and 0.5m were for other reasons. 

These numbers compare with 25.8m visits in the second quarter of 2019, comprising 18.9m to the EU, 1.4m to other European countries, 1.6m to North America and 3.9m to the rest of the world. This comprised an estimated 16.8m holidays, 6.0m visits to friends or relatives, 2.5m business trips and 0.5m other.

The amount spent by travellers in the second quarter of 2022 was estimated to be £15.8bn, an average of approximately £775 per visit. This compares with an average of around £630 in the second quarter of 2019, reflecting a weaker pound, inflation and the mix of travellers and countries visited.

Trips abroad during the key summer quarter of July to September 2022 has yet to be released by the ONS, so we wait to see whether there will be anywhere near the peak of 30.0m visits recorded in Q3 of 2019.

This chart was originally published by ICAEW.

ICAEW chart of the week: The global vaccination challenge

This week’s chart looks at how much progress there has been in vaccinating an estimated global population of 7.8bn people, and how much is left to be done.

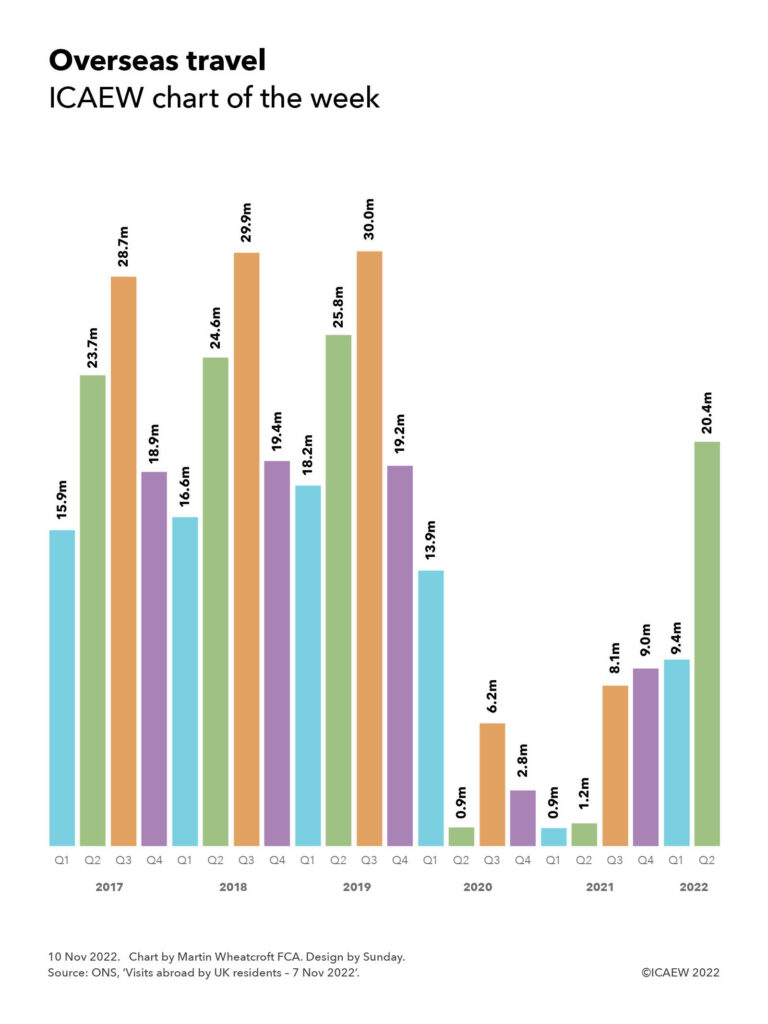
Chart showing vaccination status across Europe, North America, China, India, Rest of Asia, Africa and South America. (See text below for details).

According to Our World in Data as of 15 June 2021, 727m people are fully vaccinated, 884m are partly vaccinated and 3,847 are not yet vaccinated, based on a target of 70% of a world population of 7,795m.

With a vaccination target of 70% needed to prevent the further spread of the virus, we need to vaccinate just under 5.5bn people. So far, only 727m (9% of the global population) have been fully vaccinated, mostly in China (223m), North America (169m) and Europe (158m).

Only relatively small numbers have been fully vaccinated in India (47m), the rest of Asia (73m), South America & Oceania (46m) and Africa (11m). A further 884m (11%) have been partly vaccinated, comprising China (399m), India (156m), Europe (111m), rest of Asia (73m), North America (67m), South America & Oceania (59m) and Africa (19m).

This leaves 3,847m people (49%) yet to be vaccinated, with 1,128m in Asia excluding China and India, 909m in Africa, 763m in India, 386m in China, 255m in Europe, 227m in South America and 179m in North America.

At the current run rate of around 33m vaccinations a day and assuming two doses are needed for each person, it should in theory take around 260 days or just under nine months to deliver the 8.5bn remaining doses needed. With some vaccinations requiring only one dose and expanded manufacturing capacity, the potential is that the world could be vaccinated even sooner than that.

In practice, it will not be so easy. The current level of vaccinations is being driven by China, which is vaccinating around 16m of its population a day at the moment, and whether many countries in the rest of Asia and Africa can get up to proportionately similar levels is not certain. Many countries will struggle to afford the vaccines they need and the 1bn doses just announced by the G7 will only go so far. Logistically, there are some big challenges in getting vaccines into arms in many parts of the world.

That is why some are saying that it will take until the end of 2022 to fully vaccinate the 70% of people needed to protect against the virus. Let’s hope that they are just being cautious, and the momentum can be maintained to get the world vaccinated even sooner than that.

Source: Our World in Data COVID-19 dataset extracted on 15 June 2021 – Mathieu, E., Ritchie, H., Ortiz-Ospina, E. et al. A global database of COVID-19 vaccinations. Nat Hum Behav (2021).

This chart was originally published by ICAEW.