Our first chart of 2022 highlights how the cost of government borrowing remains extremely low for most of the 21 largest economies in the world, despite the huge expansion in public debt driven by the pandemic.
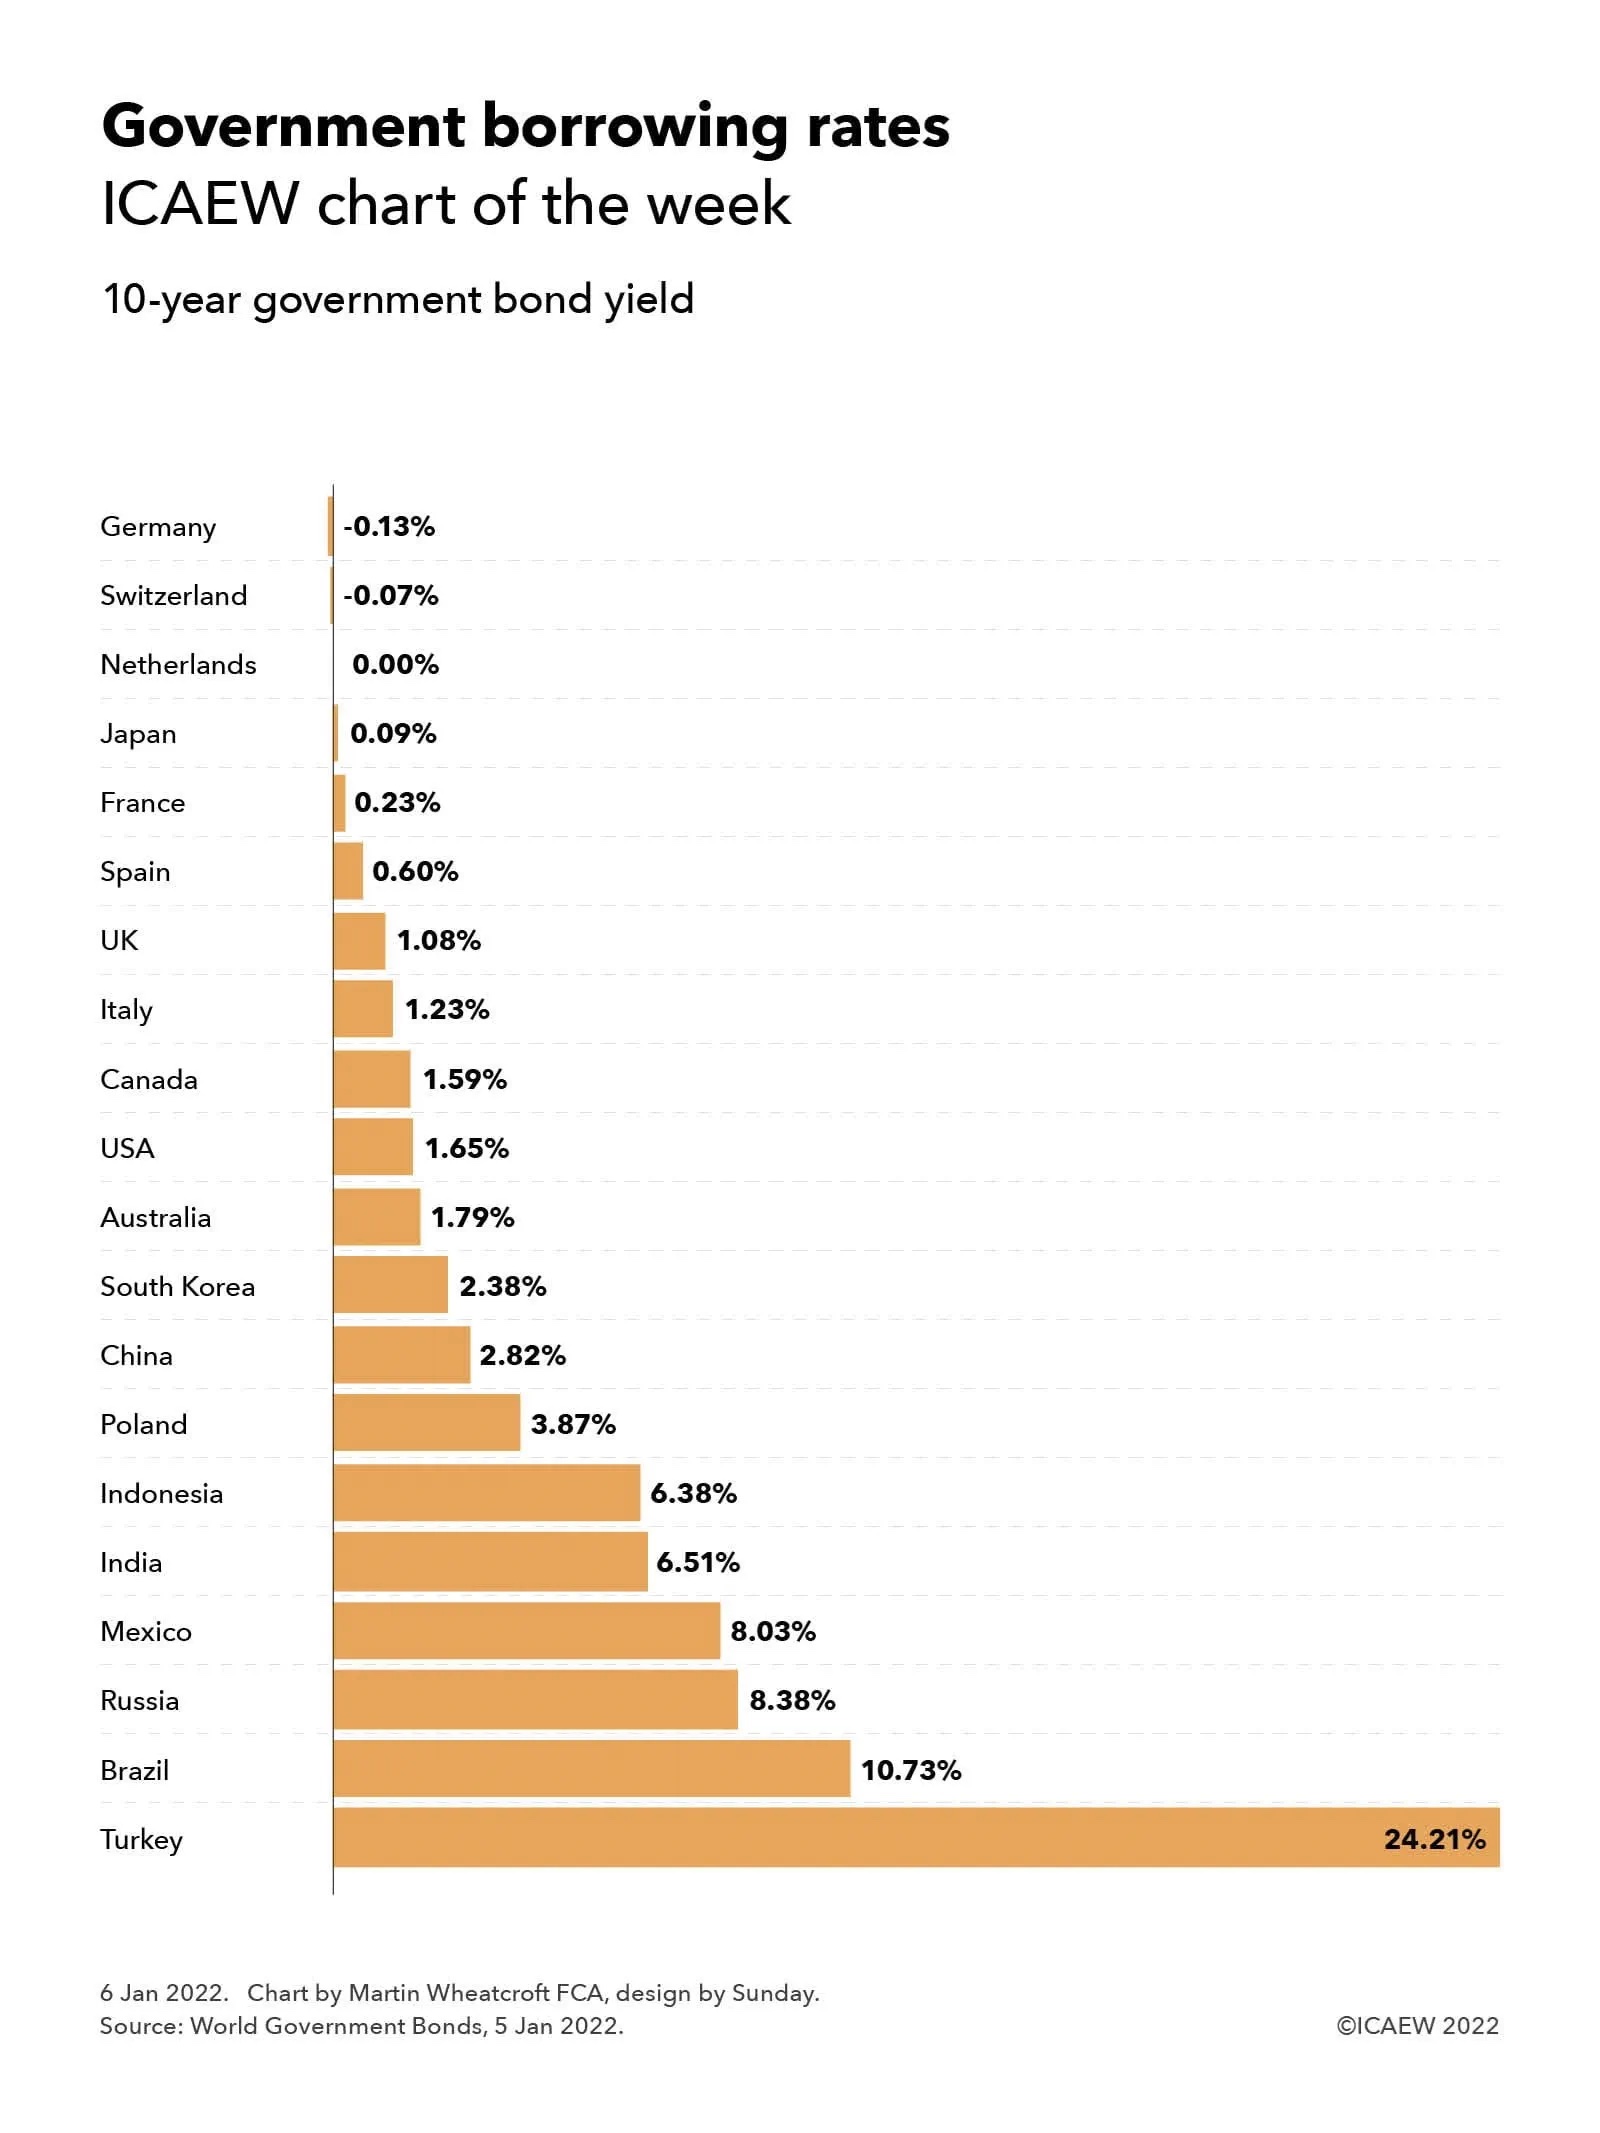
Our chart of the week illustrates how borrowing costs are still at historically low rates for most of the 21 largest national economies in the world, with negative yields on 10-year government bonds on 5 January 2022 for Germany (-0.13%) and Switzerland (-0.07%), approximately zero for the Netherlands, and yields of sub-2.5% for Japan (0.09%), France (0.23%), Spain (0.60%), the UK (1.08%), Italy (1.23%), Canada (1.59%), the USA (1.65%), Australia (1.79%) and South Korea (2.38%).
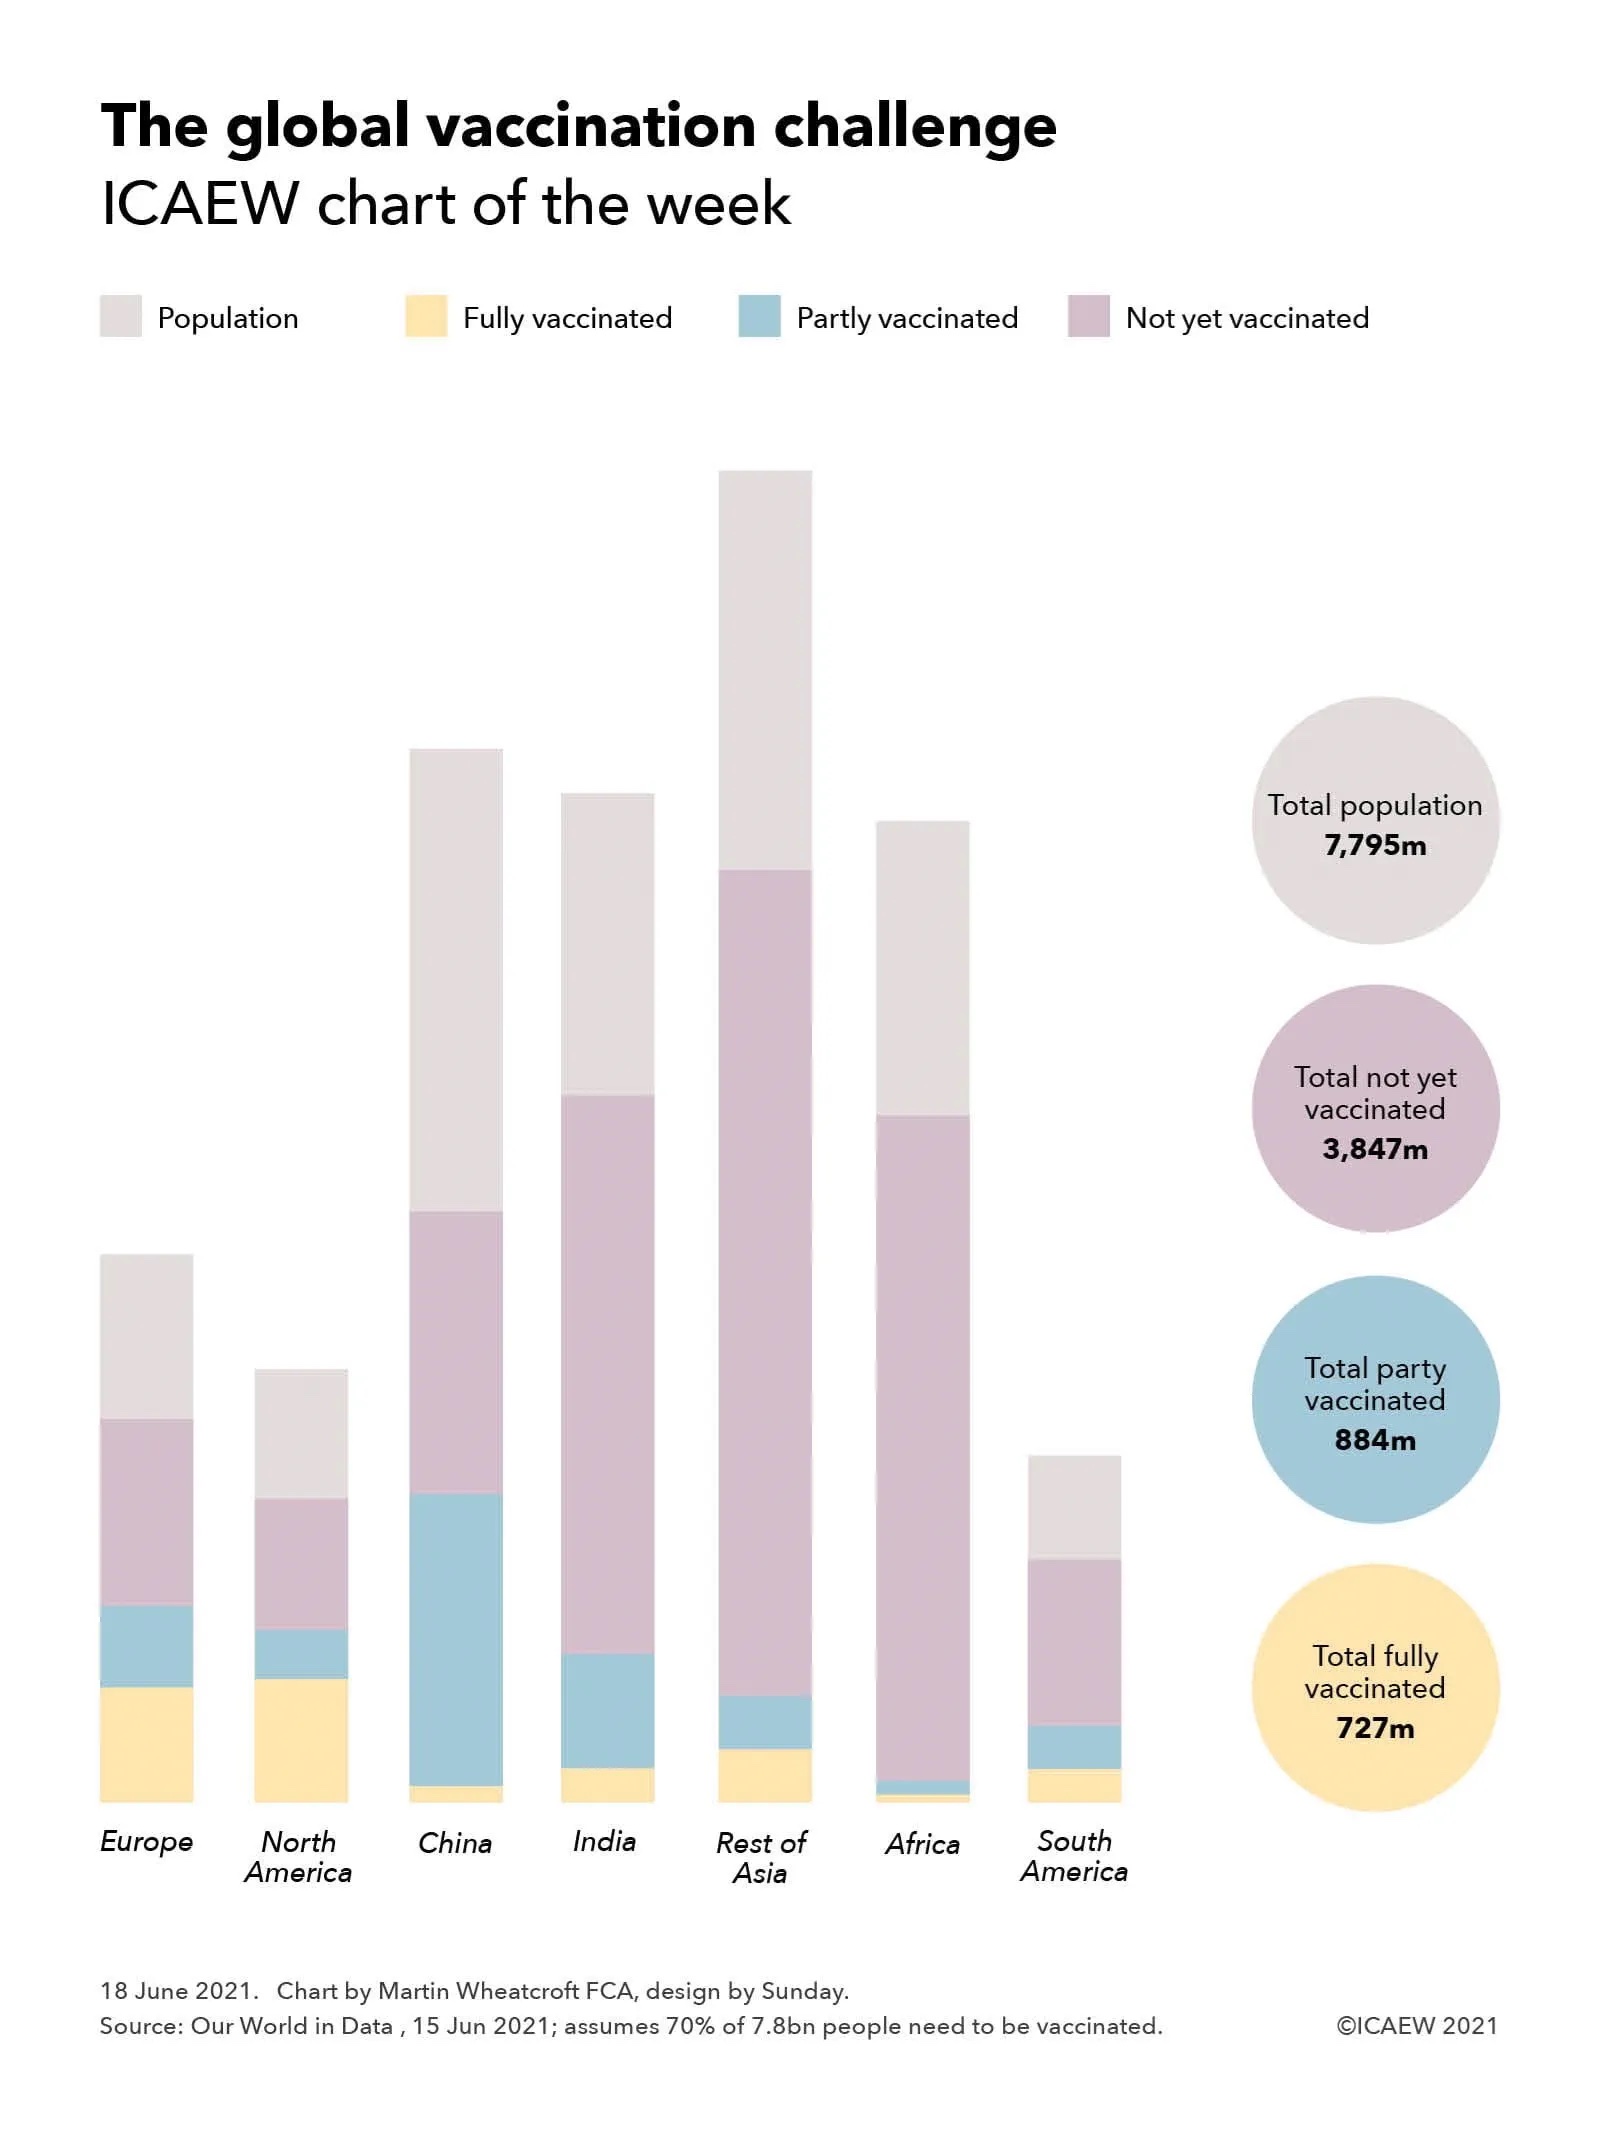
This is despite the trillions added to public debt burdens across the world over the past couple of years as a consequence of the pandemic, including the $5trn added to US government debt since March 2020 (up from $17.6trn to $22.6trn owed to external parties) and the more than £500bn borrowed by the UK government (public sector net debt up from £1.8trn to £2.3trn) for example.
Yields in developing economies are higher, although China (2.82%) and Poland (3.87%) can borrow at much lower rates than Indonesia (6.38%), India (6.51%), Mexico (8.03%), Russia (8.37%) and Brazil (10.73%). The outlier is Turkey (24.21%), which is experiencing some difficult economic conditions at the moment. Data was not available for Saudi Arabia, the 19th or 20th largest economy in the world, which has net cash reserves.
With inflation higher than it has been for several years, real borrowing rates are negative for most developed countries, meaning that in theory it would make sense for most countries to continue to borrow as much as they can while funding is so cheap. However, in practice fiscal discipline appears to be reasserting itself, with Germany, for example, planning on returning to a fully balanced budget by the start of next year and the UK targeting a current budget surplus within three years.
For many policymakers, the concern is not so much about how easy it is to borrow today, but the prospect of higher interest rates multiplied by much higher levels of debt eating into spending budgets just as they are looking to invest to grow their economies over the rest of the decade. Despite that, with the pandemic still raging and an emerging cost of living crisis, there may well be a temptation to borrow ‘just one more time’ to support struggling households over what is likely to be a difficult start to 2022.