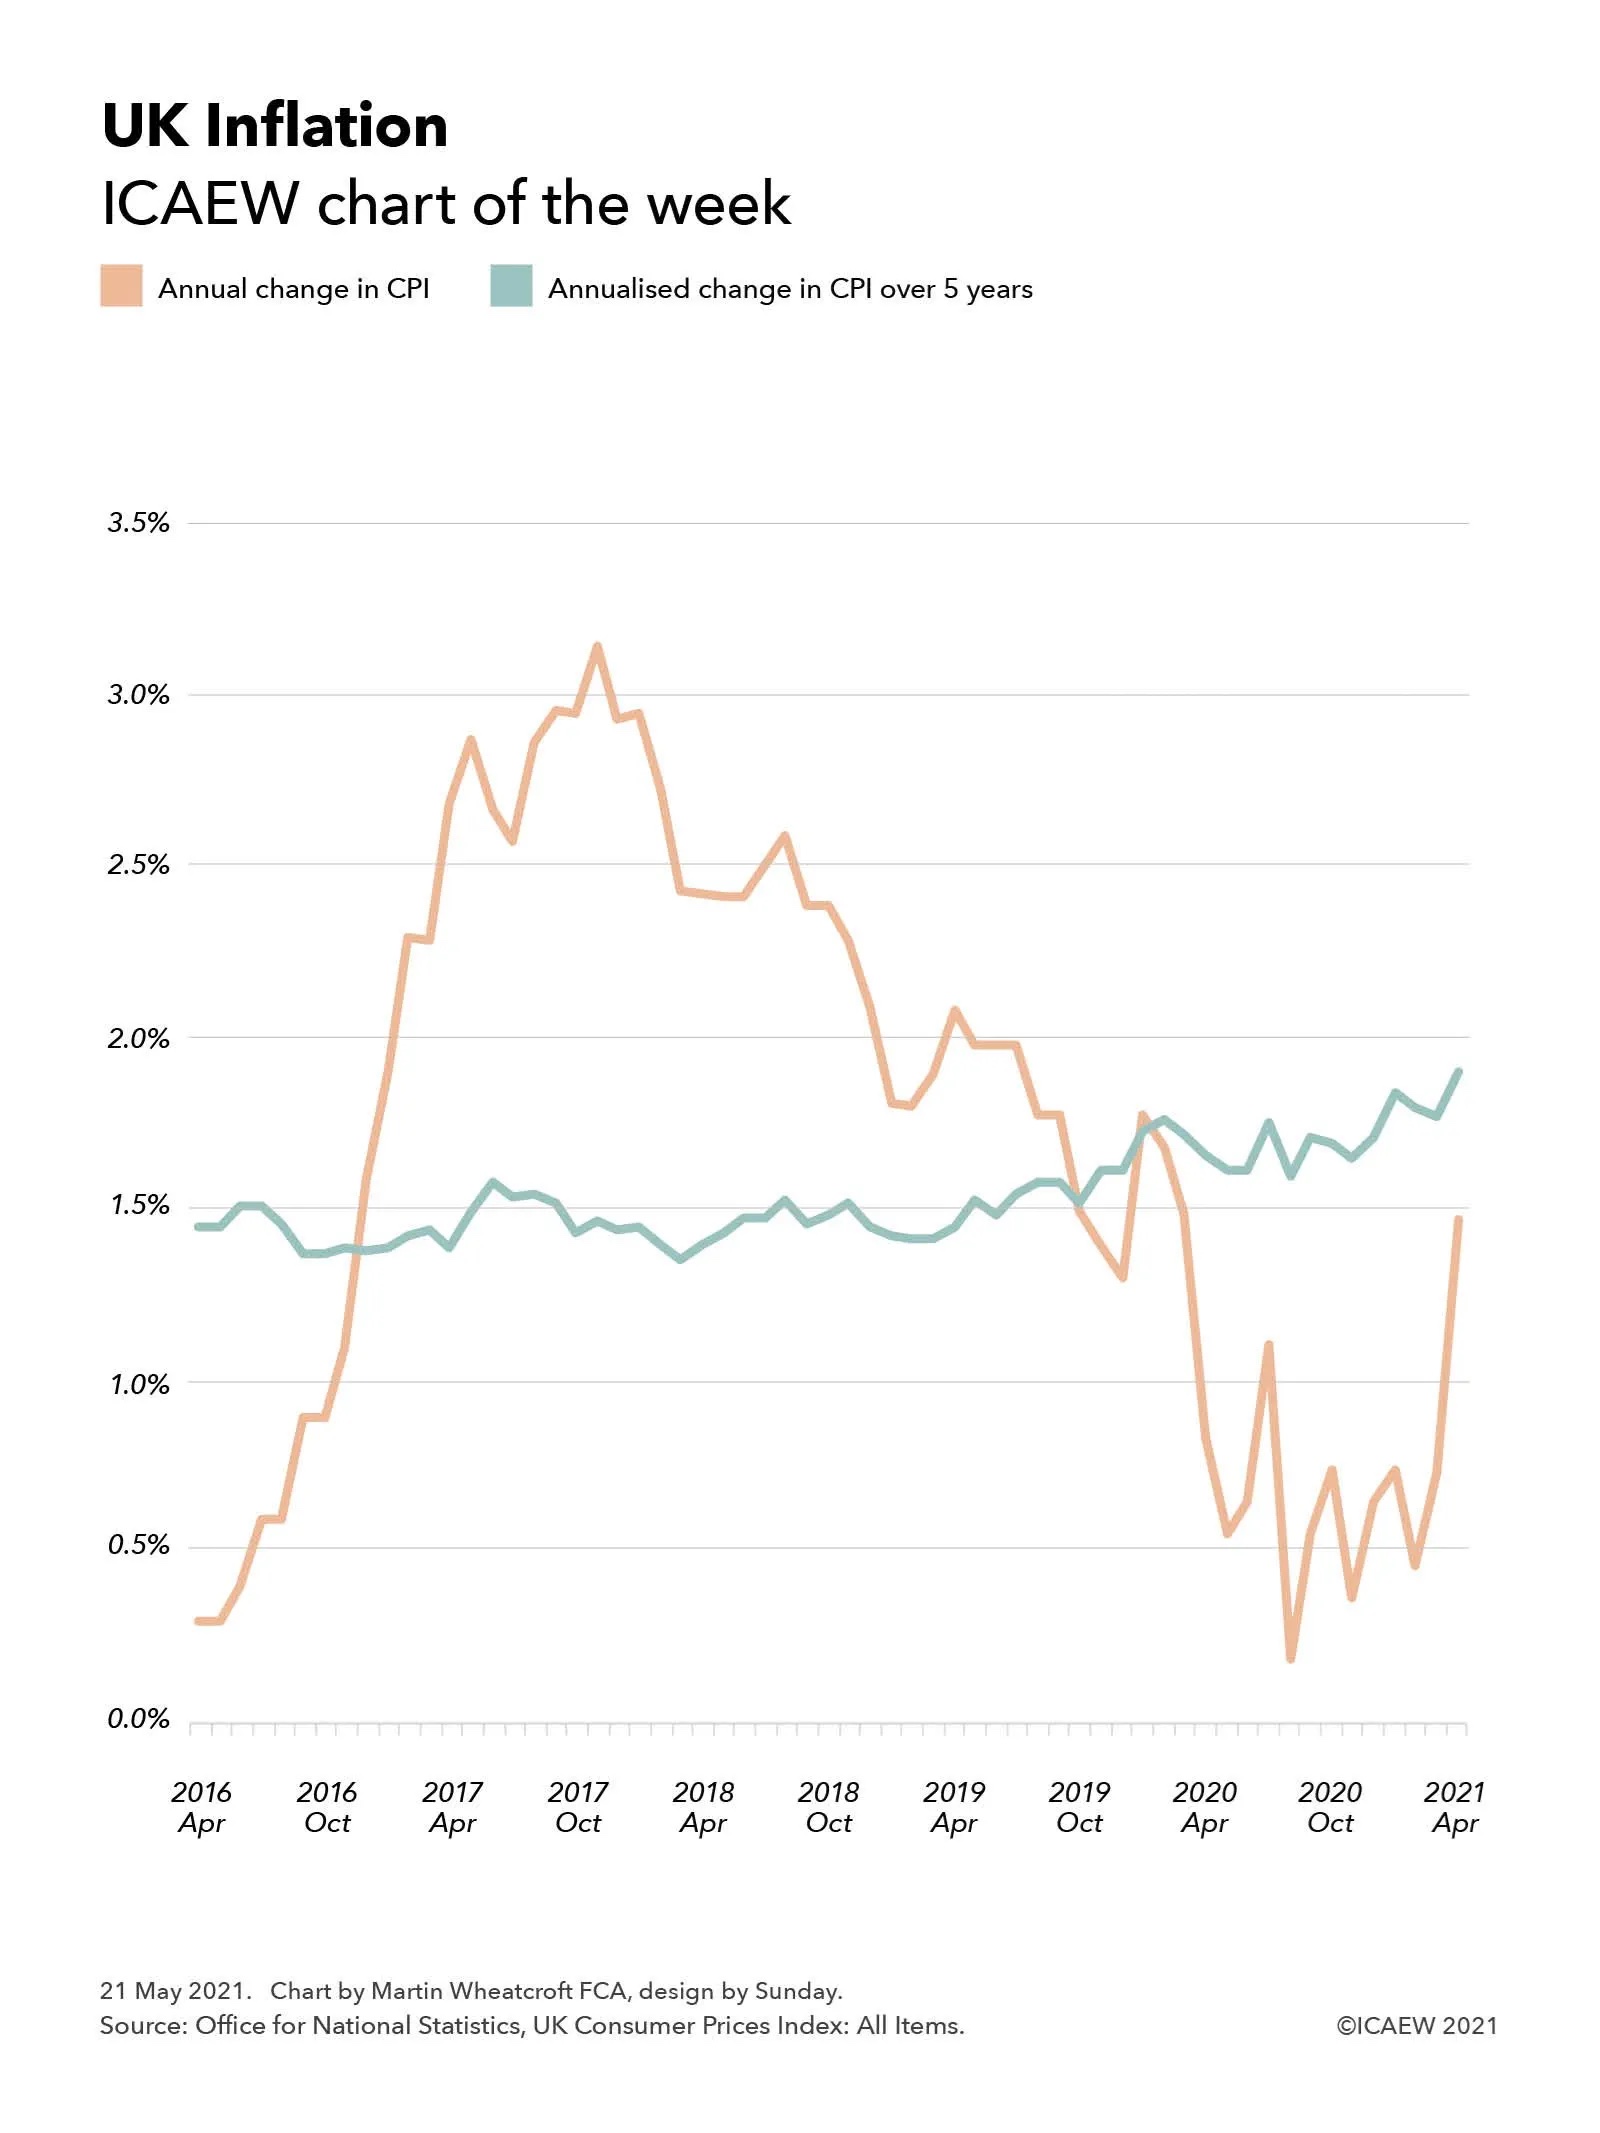
This week’s chart takes a look at UK inflation following news that the annual rate of inflation more than doubled in April to 1.5%, more than twice the 0.7% reported for the previous month.
The headline rate of inflation doubled this week from 0.7% to 1.5%, giving rise to concerns about the economic recovery. Economists aren’t getting worried just yet, but are they right to be so sanguine?
This scale of this jump partly reflects the timing of the first and current lockdowns, as inflation is typically measured by comparing prices with the same month a year previously, with significant changes both this year as the UK started to emerge from its third lockdown and a year ago as it was entering its first. Some commentators have pointed out that the temporary cut in VAT on restaurant food and leisure activities help prevent the jump from being even higher.
Our chart compares the annual rate of Consumer Price Index (CPI) inflation with a more stable measure, which is the annualised rate of CPI inflation over a five-year period. This is less susceptible to short-term swings in the economy, but as the chart shows, medium-term inflation has been gradually rising over the past five years even as headline rates on an annual basis fell over the last four years before the pandemic.
This perhaps explains some of the relaxed responses from economists about the sudden burst in inflation in the last month, given the annual rate of increase still remains below the medium-term trend, despite the current extraordinary economic circumstances.
Of course, that is not to say that inflation might not become a problem as the UK emerges further from lockdown. Many businesses have closed over the last year, particularly in the retail sector, while those that have survived will be looking to repair their balance sheets – a recipe for higher prices as constrained supply meets higher post-lockdown demand from consumers. Only time will tell whether this will feed into sustained higher levels of inflation or will jump be a temporary adjustment that falls out of the headline rate again in a year or so’s time.
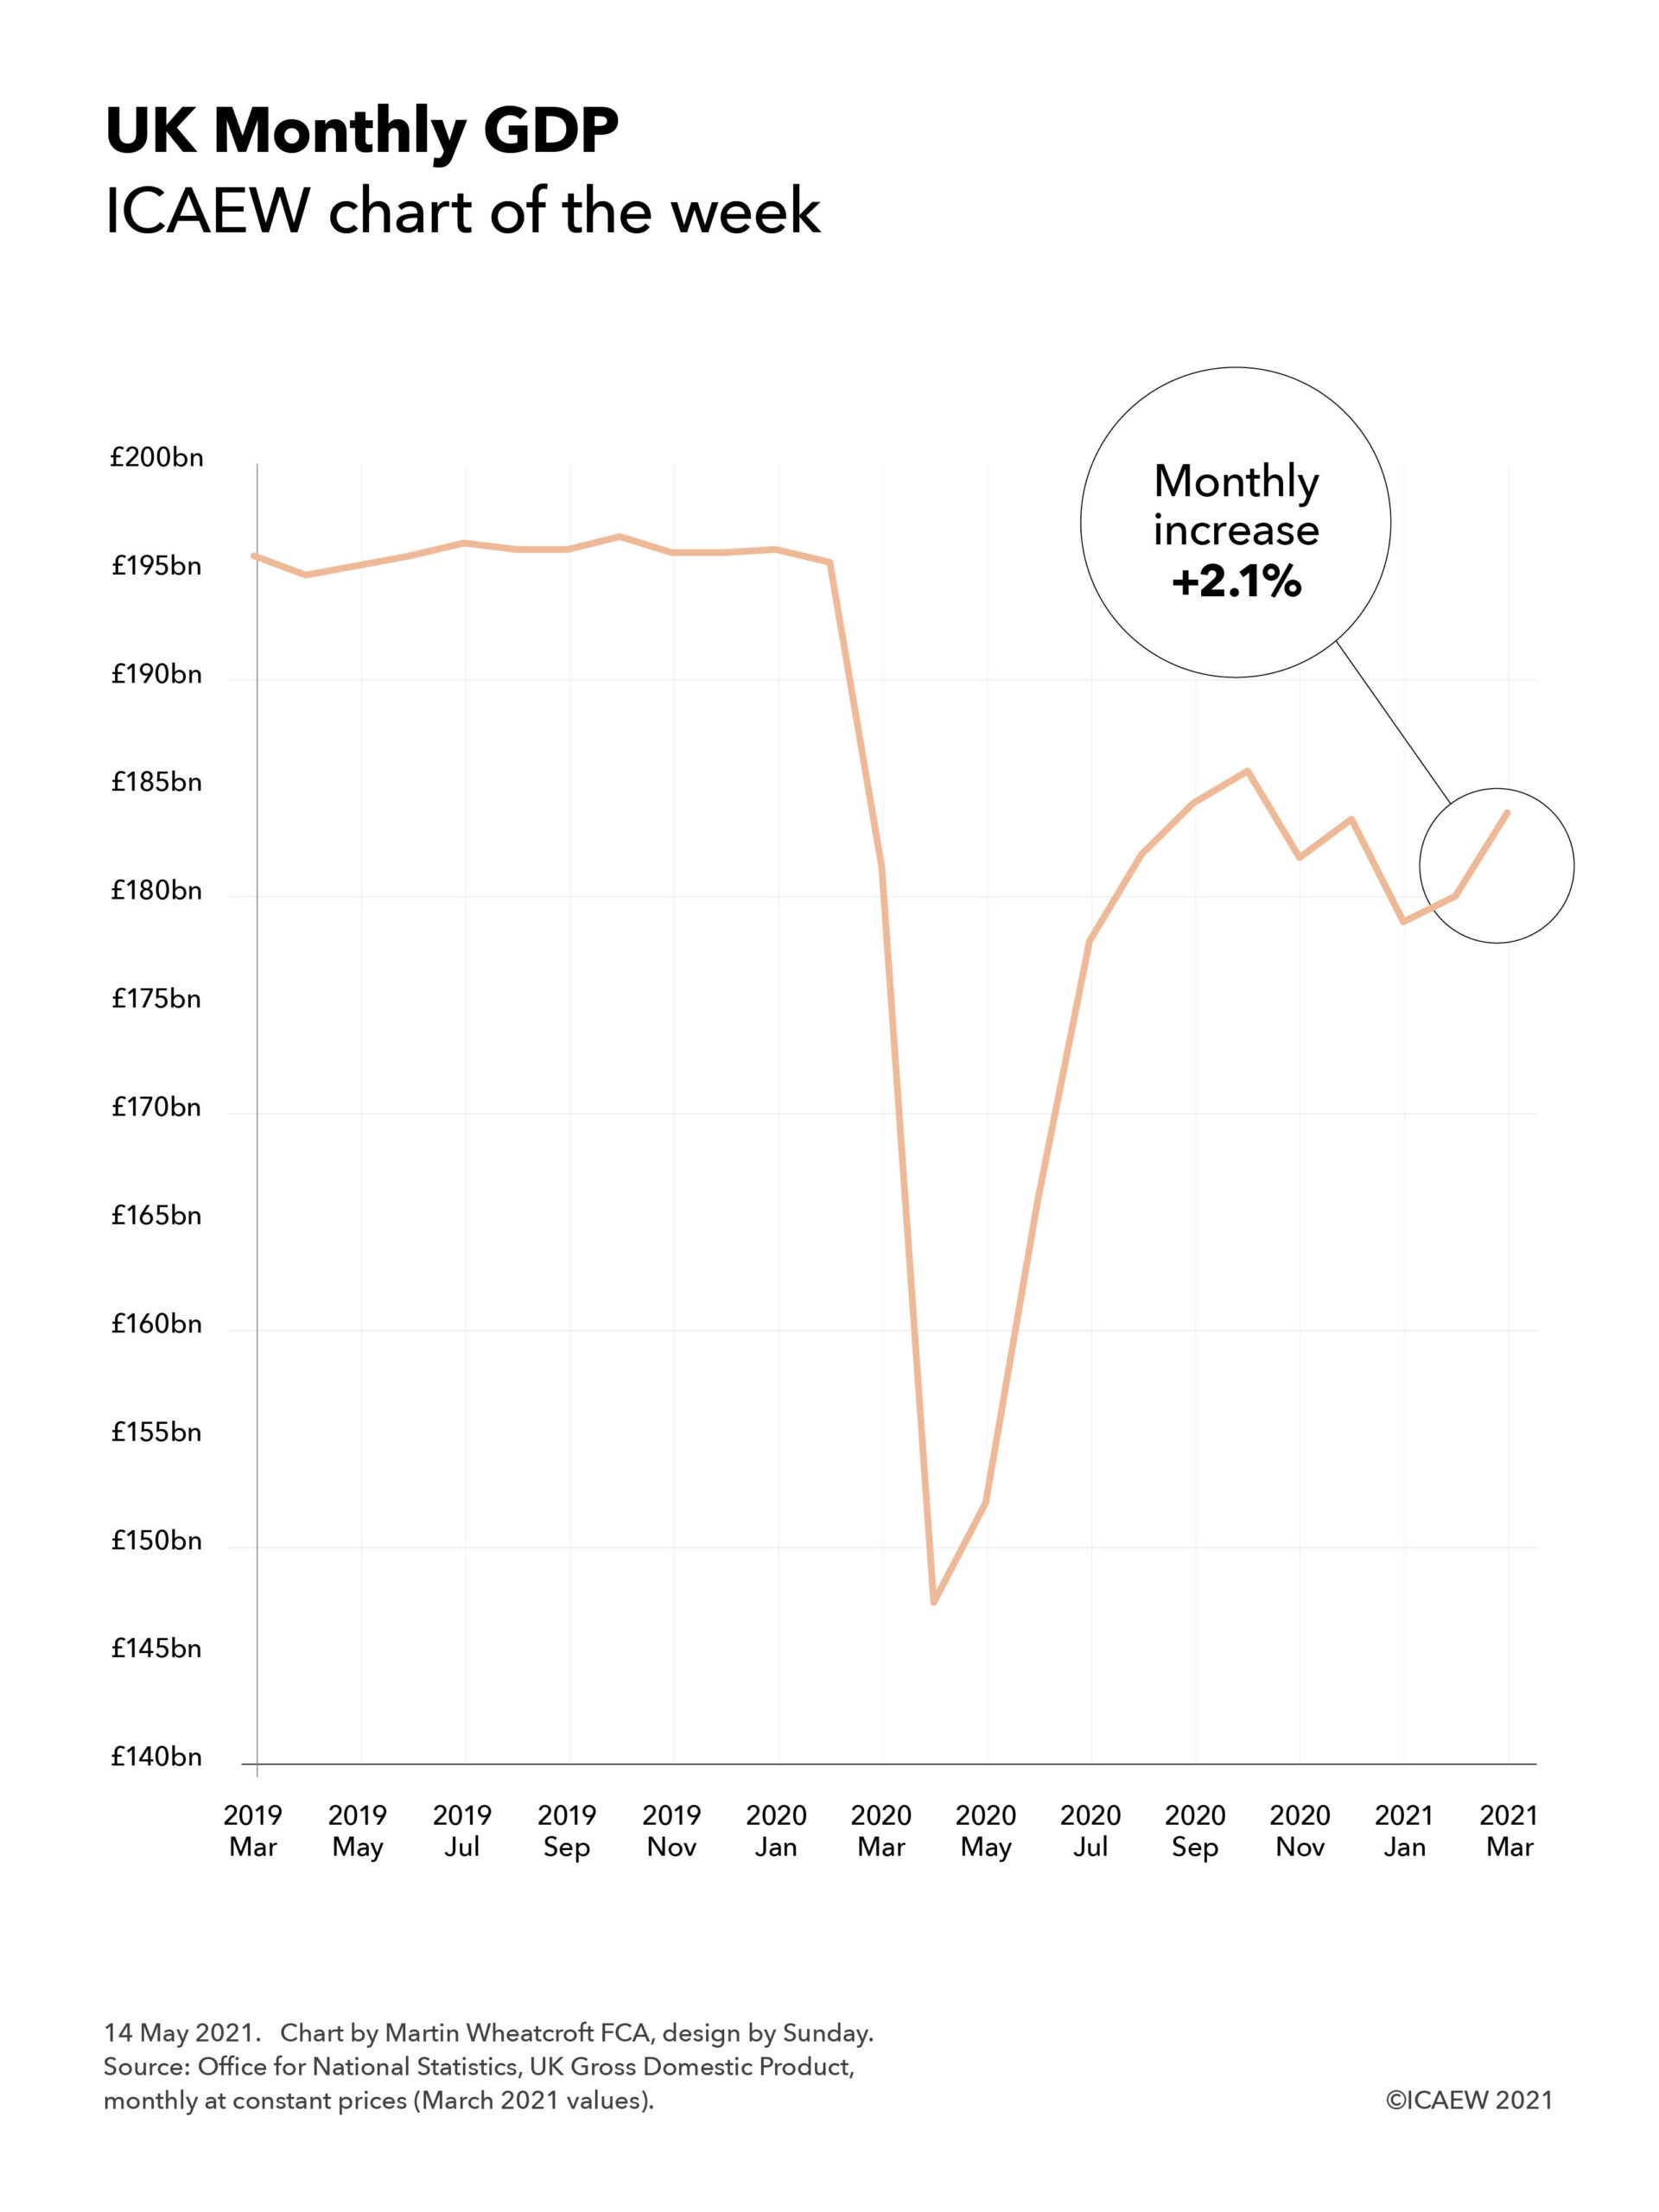
This week’s chart takes a look at the rebound in UK gross domestic product in March 2021, despite the country remaining in lockdown.
UK GDP jumped 2.1% in March 2021 according to the Office for National Statistics. A positive sign but, as our chart of the week illustrates, there is still a long way to go to get back to pre-pandemic levels of economic activity.
The #icaewchartoftheweek is on the economy this week, taking a look at how the latest economic statistics from the Office for National Statistics indicate a rebound in GDP in March 2021 even as the country remained in lockdown. This is a positive sign as the UK starts to emerge from the pandemic and people start to return to ‘normality’, albeit a new normal that is likely to be different to what came before.
However, the chart also makes clear how far the UK still has to go to return to pre-pandemic levels of economic activity, with the anticipated square-root shaped recovery stopped in its tracks in the last quarter of 2020 as COVID-19 resurged and restrictions on daily life were reimposed. The 2.1% real-terms growth in GDP in March follows a pattern of ups and downs in recent months with a fall of 2.2% in November, an increase of 1.0% in December, a fall of 2.5% in January, and an increase of 0.7% in February.
With the progress made in combating the virus over the last few months enabling lockdown restrictions to be progressively lifted across the UK, the hope is that March will be the second month on a more sustainable upward curve.
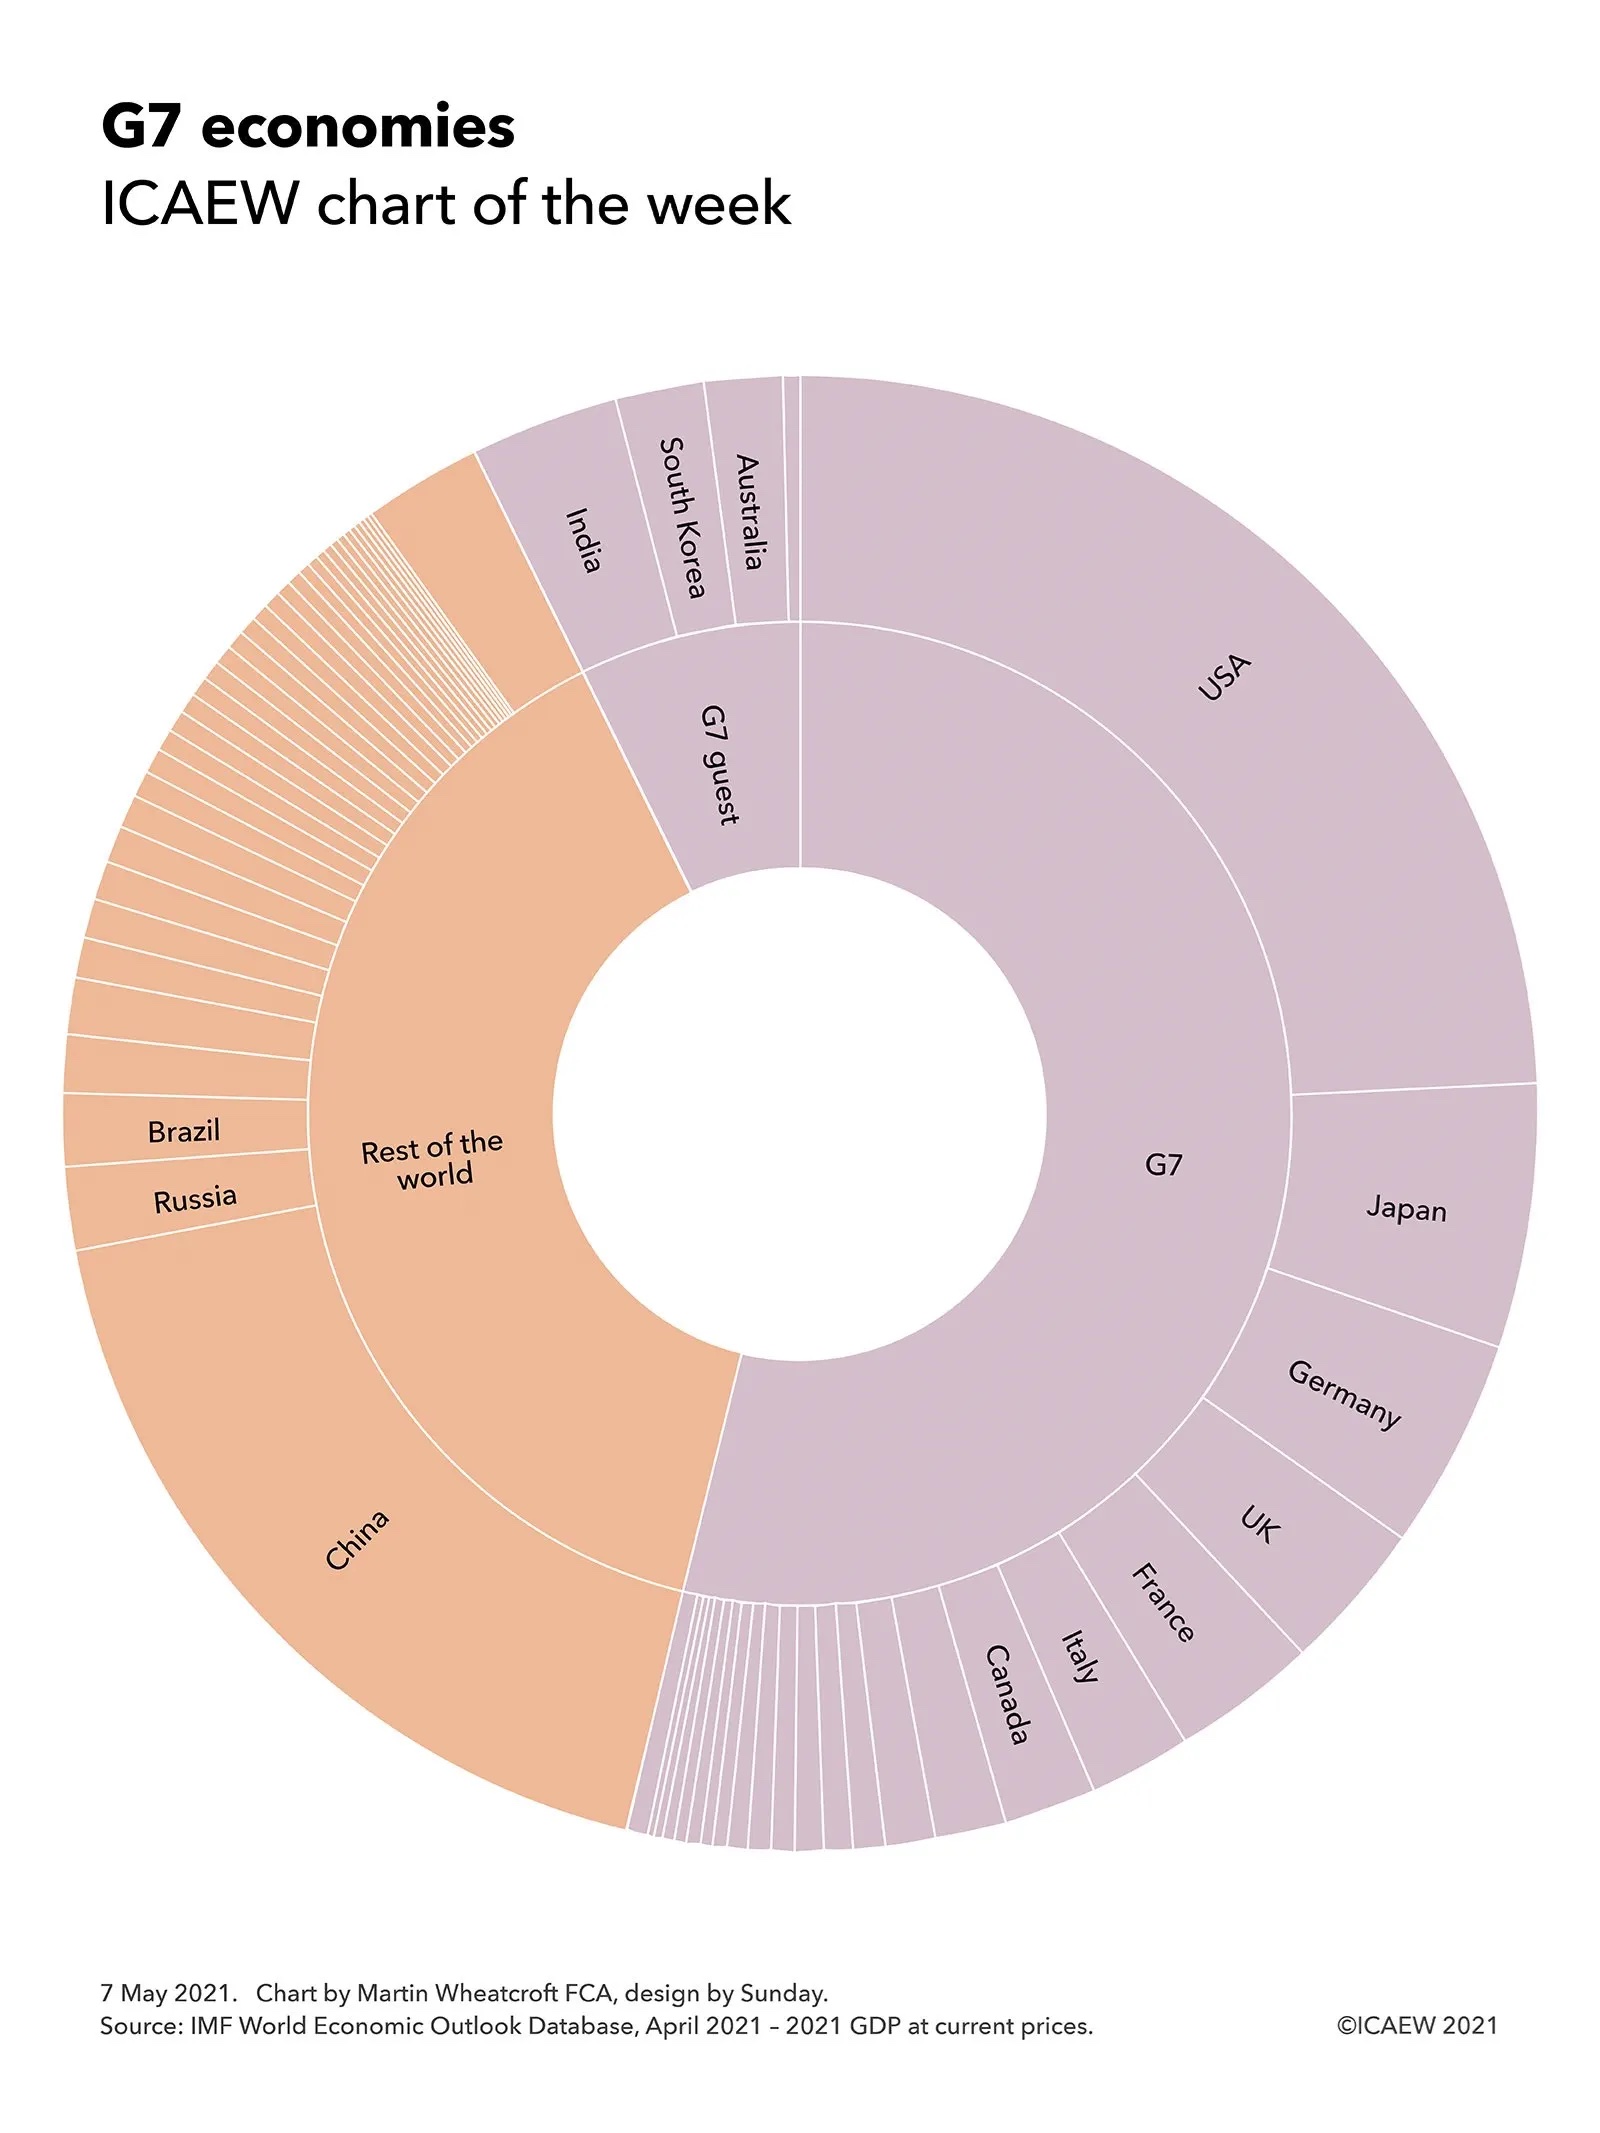
Our chart this week illustrates how in representing more than half of the world economy, decisions taken by the G7 can have a significant impact on the entire planet.
The G7 summit hasn’t formally started yet, but Group of Seven (G7) ministers and their guests have already started to meet ahead of the main event next month, albeit subject to quarantine restrictions.
The #icaewchartoftheweek illustrates how important this gathering is by highlighting how the seven major democratic nations and the European Union that together comprise the G7 represent more than half the global economy – and even more than that, once four invited guest nations are included.
Overall, the G7 economies are forecast by the IMF to generate £35.9tn of economic activity in 2021 at current prices, 54% of forecast global GDP of £66.8tn. This comprises the economies of seven individual member nations: the USA (£16.3tn), Japan (£3.8tn), Germany (£3.1tn), the UK (£2.2tn), France (£2.1tn), Italy (£1.5tn) and Canada (£1.3tn), together with the 24 other EU member states (£5.6tn).
The guests invited to the 47th G7 summit in Cornwall are expected to generate a further £4.9tn or 7% of global GDP in 2021, bringing the total economic activity represented at the summit to £40.8tn or 61% of the total. They are India (£2.2tn), South Korea (£1.3tn), Australia (£1.2tn) and South Africa (£0.2tn).
Not represented at the G7 are China (£12.2tn), Russia (£1.2tn) and Brazil (£1.1tn) and around 160 other nations across the globe (£11.5tn in total).
The G7 summit presents an opportunity for the 11 national leaders and 2 EU representatives involved to shape the direction for much of the world, with discussions expected to range from saving the planet through to transparency in financial and non-financial reporting.
This week’s chart looks at how the pandemic has driven government debt levels higher, a topic that will be on the agenda at the G7 summit in Cornwall in six weeks’ time.
The #icaewchartoftheweek is on the topic of government debt, looking at the indebtedness of the seven nations that comprise the G7 together with the EU.
The strength (or otherwise) of public finances will underlie many of the discussions at the upcoming G7 summit in Cornwall in June as countries decide how best to deal with the coronavirus pandemic, achieving net-zero carbon and the COP26 goals, strengthening defence and security, and economic recovery. All of these are likely to require significant public investment at a time when public finances have been hit hard from a combination of the financial crisis just over a decade ago and the coronavirus pandemic over the past year.
Perhaps best-placed amongst the G7 are Canada and Germany, with stronger public balance sheets than their peers putting them in a better position to fund public investment. Canada’s general government net debt to GDP ratio (the net debts of the federal government, provincial governments and local authorities combined compared with Canadian GDP) is forecast to increase from 23% at 31 December 2019 to 37% at 31 December 2021, while Germany’s general government net debt to GDP ratio is forecast to increase from 41% to 52% over the same period.
The UK is next with its general government net debt up from 75% of GDP to a forecast 97% of GDP, followed by France with its net debt increasing from 89% in December 2019 to a forecast 106% of GDP for the end of 2021. The USA is expected to overtake France with its major stimulus packages seeing debt rise from 83% as a proportion of GDP to 109% by the end of this year. The biggest ratios within the G7 are Italy, which is expected to increase from 122% to 144%, while Japan is expected to rise from 150% to 172% of GDP.
Not shown on the chart are G7 guest nations this year: Australia (up from 26% to a forecast 49% of GDP) and South Korea (12% to 23%) are both in relatively strong public finance positions, while India (74% to 99%) is in a more challenging fiscal situation.
Despite the differences in debt levels, there will be a commonality amongst all the nations present in needing to find money to deal with increased pressure on public services and social security systems as populations age, for public investment in achieving net zero and in infrastructure more generally, to fund defence in an increasingly unstable global security environment and in economic stimulus to restart economies as they reopen, not to mention the need to replace tax income on fossil fuels as they are eliminated over the coming decades.
The signs are that tax reform will play a larger part in discussions than it may have done previously, with the USA’s suggestion for a minimum corporation tax indicative of a move to limit tax competition between nations and work more collaboratively to capture tax receipts from increasingly mobile global corporations and individuals.
Hence while many of the headlines from the G7 summit are likely to be focused on the heads of government talking about the global response to the coronavirus pandemic, the global security situation and global plans to deliver net zero, the side room containing finance ministers discussing global taxation and global public investment may be just as consequential.
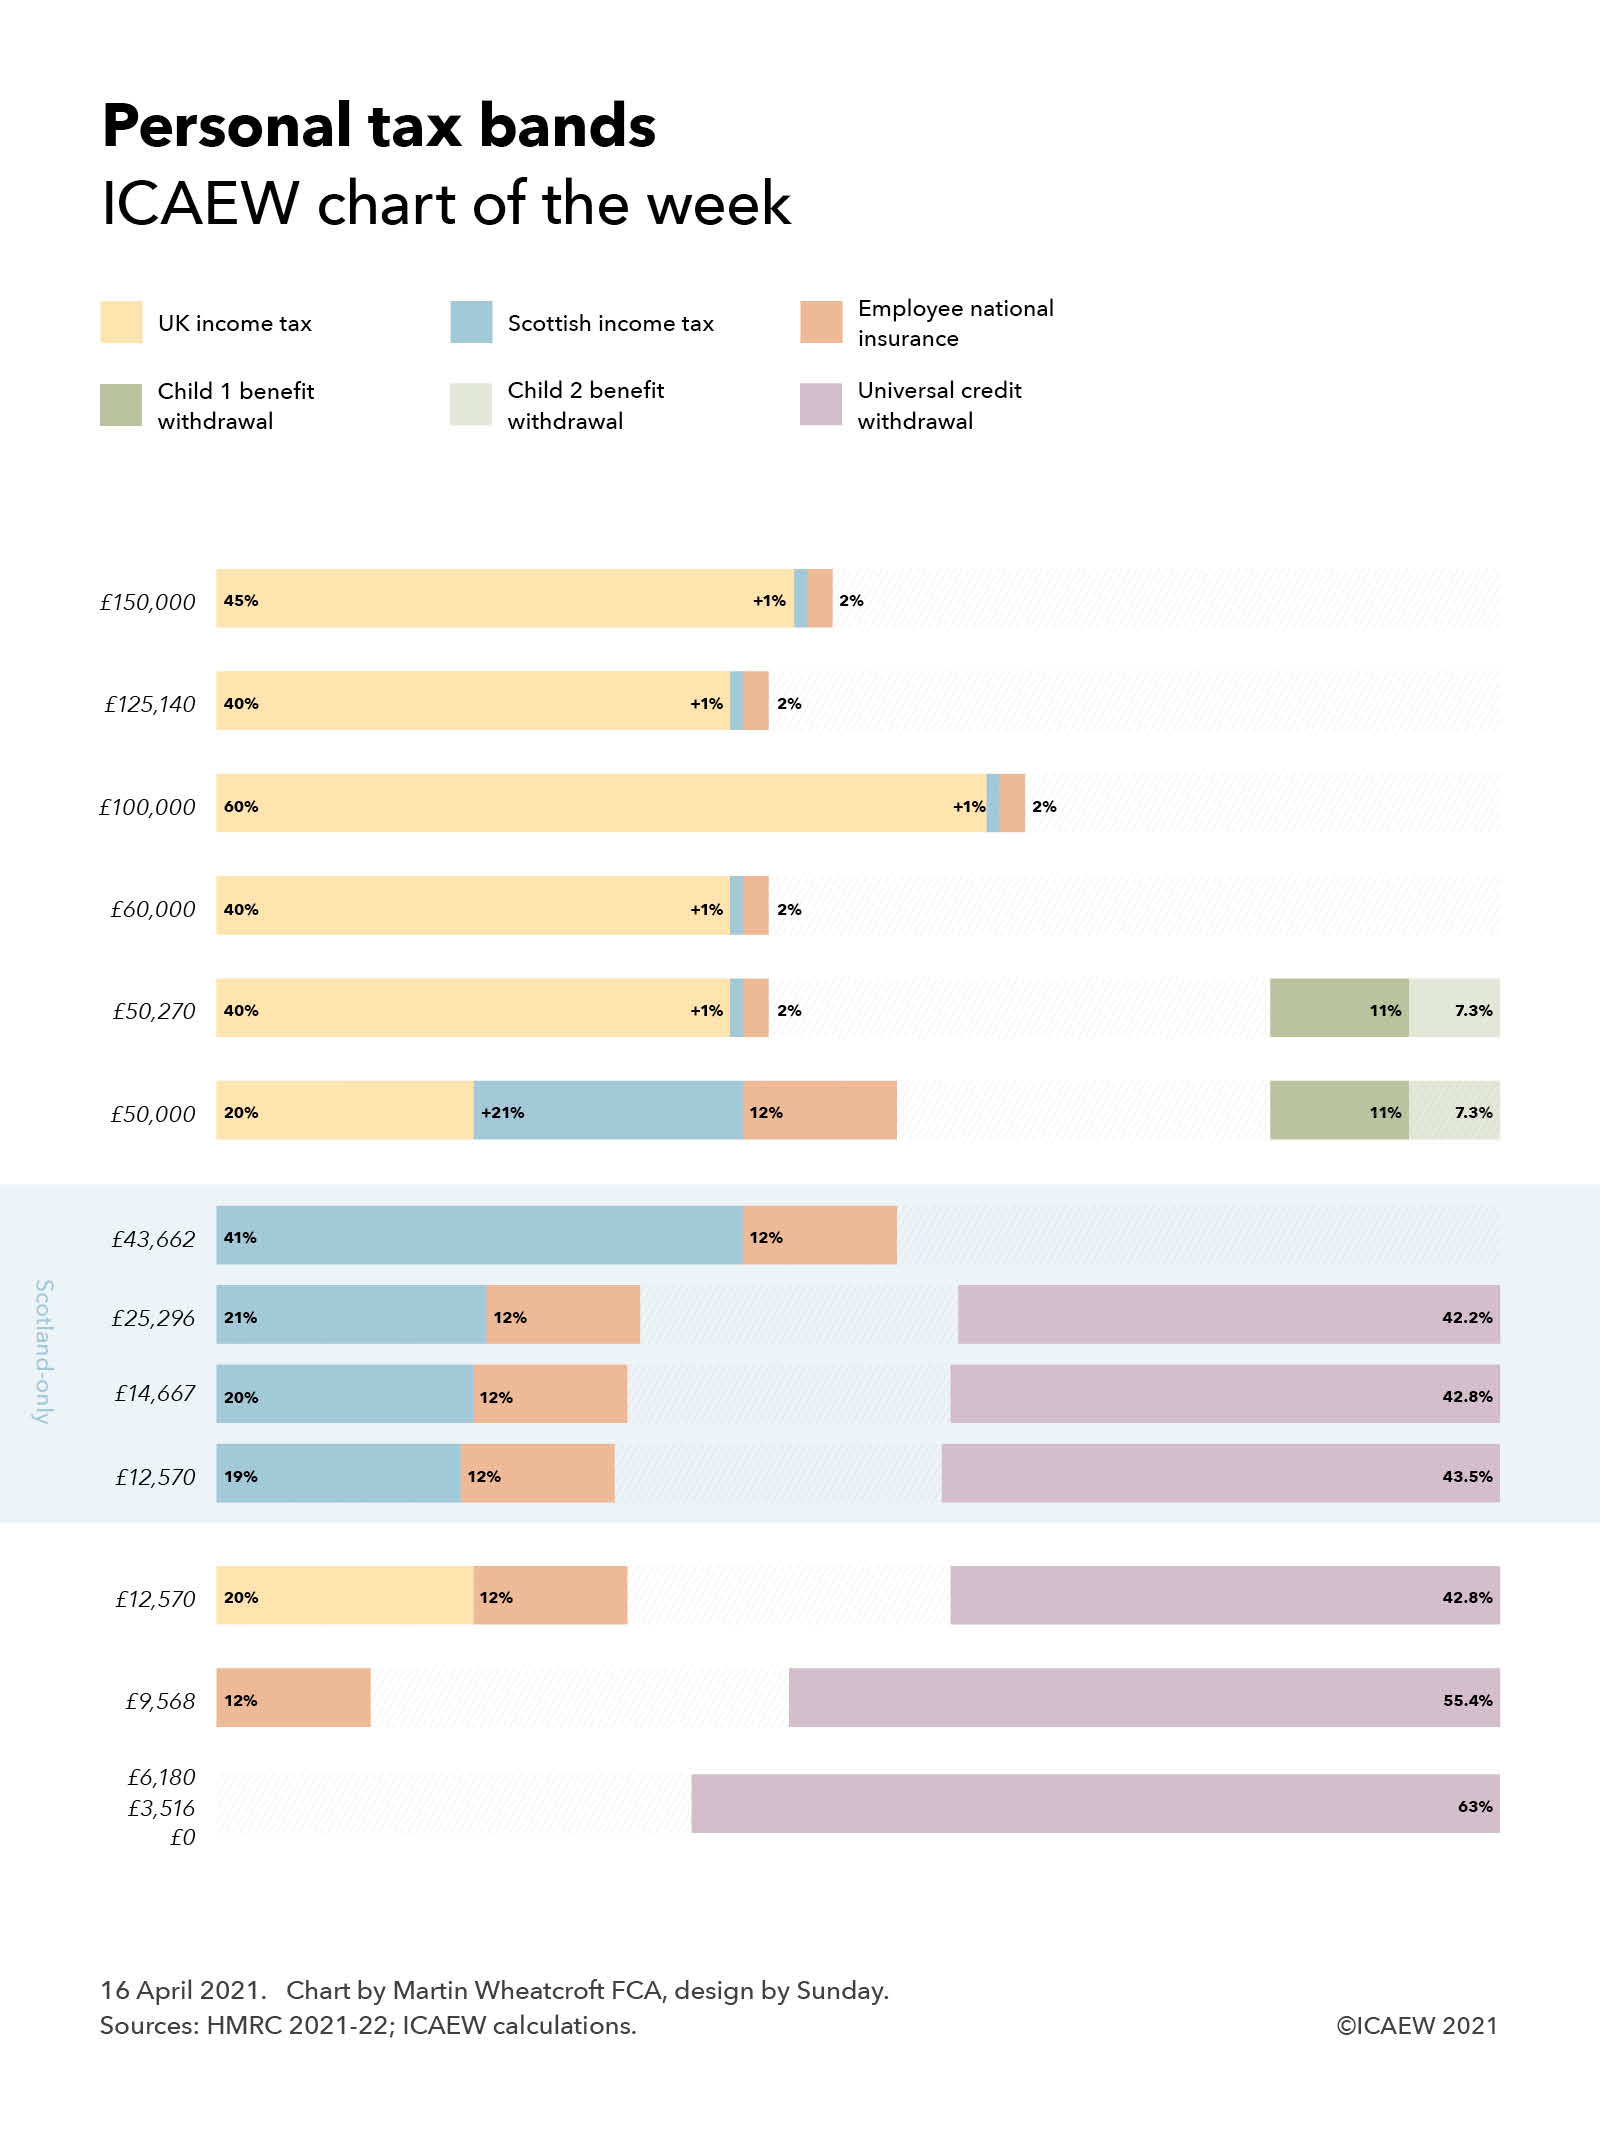
This week’s chart examines the complexity in the tax system and potential options for reform by looking at the number of tax bands for salaried employees across the UK.
The new tax year saw the introduction of an additional tax band to the UK system of personal taxation, bringing the total number to nine tax bands in England, Wales and Northern Ireland and twelve in Scotland.
The #icaewchartoftheweek continues on the theme of complexity in the tax system and potential options for tax reform by looking at the number of tax bands for salaried employees, with up to nine tax bands in England, Wales and Northern Ireland and up to twelve in Scotland.
Although the advertised personal tax allowance of £12,570 a year suggests that individuals only start to pay tax above that point, in practice ‘taxation’ in its wider sense can start from as little as £0, which is when some of those claiming universal credit start to have their benefits withdrawn at a rate of 63p in the pound. The threshold is £0 for those without dependent children, £3,516 for those on housing benefit and with dependent children or limited capability to work, or £6,180 for those with dependent children or limited capability to work who are not on housing benefit. The rate of withdrawal is even higher for those receiving council tax benefit, with an additional 20% or more levied on incomes above a certain level until it is fully clawed back – the details vary by council.
Tax in its more formal sense starts at £9,568 when employee national insurance of 12% starts to be levied. Although ‘constitutionally’ different in how the money collected is used and its role in entitlement to the state pension, in substance it operates as an income tax in all but name.
Income tax itself starts to be levied on earnings above £12,570 at a basic rate of 20%, adding to national insurance to give a marginal tax rate of 32% for those not on universal credit and 74.8% for those who are.
For those in England, Wales and Northern Ireland this tax band goes from £12,570 up to £50,000 but in Scotland, there are intermediate tax bands, with a lower rate of income tax of 19% between £12,570 and £14,667, 20% between £14,667 and £25,926, 21% between £25,926 and £43,662, and 41% above £43,662 when the higher rate of Scottish income tax kicks in.
The new tax band this year arises because the government failed to increase the £50,000 threshold at which child benefit is withdrawn from the higher-earning parent to align with the increase in the higher rate tax threshold to £50,270. This means the insertion of a new tax band between £50,000 and £50,270 as the government starts to withdraw entitlement to ‘universal’ child benefit of £21.15 a week for the eldest child and £14.00 a week for remaining children by collecting an additional tax of 11% for the eldest child and 7.3% for the second and each of any subsequent children.
Above £50,270, the higher rate of income tax of 40% starts to be levied in England, Wales and Northern Ireland, but the marginal rate of national insurance reduces to 2% meaning that this is a 10% increase from 32% to 42% in the combined marginal rate – at least assuming you don’t have children! This rate also applies to those with children from £60,000 up until £100,000 when the marginal rate jumps to 62% (63% in Scotland) as the personal income tax allowance is gradually withdrawn. The marginal rate reverts to 42% (43%) from £125,140 before increasing to 47% (48%) for those on the 45% top rate of income tax above £150,000.
While devolution has led to some of the complexity, this probably hasn’t been helped by the perennial tendency of governments to find ever more complicated approaches to extract additional money from taxpayers without touching the headline rates of tax – for example through the ‘withdrawal’ of the personal tax allowance, which in substance operates as an additional 20% tax payable by those earning between £100,000 and £125,140.
The consequence of this tinkering with the tax systems means there are now nine different tax bands in England, Wales and Northern Ireland with marginal tax rates of 0%, 12%, 32%, 32% + 11% (or more) for higher-earning parents, 42% + 11% (or more) for higher-earning parents, 42%, 62%, 42% and 47%. In Scotland there are twelve: 0%, 12%, 31%, 32%, 33%, 53%, 53% + 11% (or more) for higher earning parents, 43% + 11% (or more) for higher earnings parents, 43%, 63%, 43% and 48%.
Such a complex system invites the question of how it might be reformed, with the possibility of increasing the national insurance threshold to align with the income tax personal allowance being actively discussed in recent years to eliminate one of the bands. However, this now seems less likely than it once did since the pandemic caused such damage to the public finances. Other ideas have included aligning the 40% higher rate and 45% top rate of income tax (either up or down depending on political preference) or ‘folding’ in the personal tax allowance withdrawal into the tax system as part of the higher or top tax rates in conjunction with a reform to tax thresholds.
However, another option would be to add even more complexity, a real possibility now the Welsh government has obtained devolved powers to adjust its income tax rates and thresholds like Scotland, albeit powers that have thankfully not been used so far.
Either way, the nirvana that some tax reformers aspire to of a single flat rate of income tax applying to all earnings seems more remote than ever. One can but dream!
26 March 2021: ICAEW’s chart this week is in honour of Tax Day, the newest fiscal event in the government calendar where reforms of the tax system under consideration are opened up to consultation.
The #icaewchartoftheweek starts with the Spring Budget forecast tax receipts of £732bn for the coming financial year from 1 April 2021 and how these are expected to increase to £928bn in 2025-26 through a combination of economic growth, inflation and higher receipts principally from corporation tax, income tax, VAT and business rates.
The chart illustrates how the ‘big three’: income tax (£198bn in 2021-22), VAT (£151bn) and national insurance (£147bn) together comprise 67.8% of the total tax take, with corporation tax (£40bn), council tax (£40bn), fuel duties (£26bn), business rates (£24bn), alcohol & tobacco duties (£22bn), stamp duty (£12bn) generating a further 22.4%. The next 5 taxes – environmental levies (£10bn), capital gains tax (£9bn), insurance premium tax (£7bn), vehicle excise duties (£7bn) and inheritance tax (£6bn) – generate 5.3%, while all other taxes (£33bn) comprise the balance of 4.5%.
With the Chancellor constrained by a commitment not to raise the main rates of income tax, VAT and national insurance, the principal focus of both the Spring Budget and Tax Day has been on improving the tax take from existing taxes, for example by looking at tax reliefs and tackling tax avoidance, and on raising more money from smaller taxes.
This is reflected in the Office for Budget Responsibility projections for tax receipts that accompanied the Spring Budget, which indicate that receipts from most taxes are expected to rise broadly in line with economic growth (generating £80bn in higher tax receipts) and inflation (£46bn) between 2021-22 and 2056-26. This reflects anticipated economic recovery from the pandemic as well as a boost from stimulus measures announced by the Chancellor in addition to existing plans to increase public investment.
The biggest incremental change is an expected increase in corporation tax receipts of £38bn over and above economic growth and inflation. Some of this rise is recovery to a more normal level, as businesses will be able to reduce their tax bills in the coming year by offsetting losses incurred during the pandemic and using the temporary ‘super deduction’ of 130% of qualifying capital expenditure, but the principal driver is an increase in the corporation tax rate on larger businesses from 19% to 25% in 2023.
The next highest increases are from income tax (+£16bn) and VAT (+£9bn) where a combination of fiscal drag from freezing tax allowances (income tax) and registration thresholds (VAT) will bring more transactions into the scope of both taxes and hence generate more revenue. Both taxes are also the focus of efforts to make taxes easier to pay and to tackle tax avoidance as addressed in several of the Tax Day consultations.
The other significant increase is in business rates (+£7bn), although this mostly reflects pandemic related reliefs in the coming financial year that are not expected to continue into subsequent financial years. In practice, there are some questions as to whether this increase will be deliverable, with the Tax Day consultation on business rates suggesting that levels are too high and a reduction could help bricks and mortar businesses survive against online competition and so ‘save the high street’. The dilemma for the Chancellor is that if he were to cut business rates as some hope, then what tax lever he would need to pull to make up for that lost revenue?
Much of the focus of this first Tax Day has been on the efficiency and effectiveness of the tax system and how it can be made to work better. Perhaps future Tax Days will tackle some of the bigger questions surrounding the role of taxation in the long-term sustainability and resilience of the public finances – and whether some bigger tax levers might need to be pulled at some point in the future?
19 March 2021: The UK’s Integrated Review is the inspiration for this week’s chart, illustrating the 20 countries around the world that spend the most on their militaries.
The UK Government launched its Integrated Review of Security, Defence, Development and Foreign Policy on 16 March 2021, setting out a vision for the UK’s place in the world following its departure from the European Union and in the context of increasing international tensions and emerging security threats.
At the core of the Integrated Review is security and defence, and ICAEW’s chart of the week illustrates one aspect of that by looking at military spending around the world.
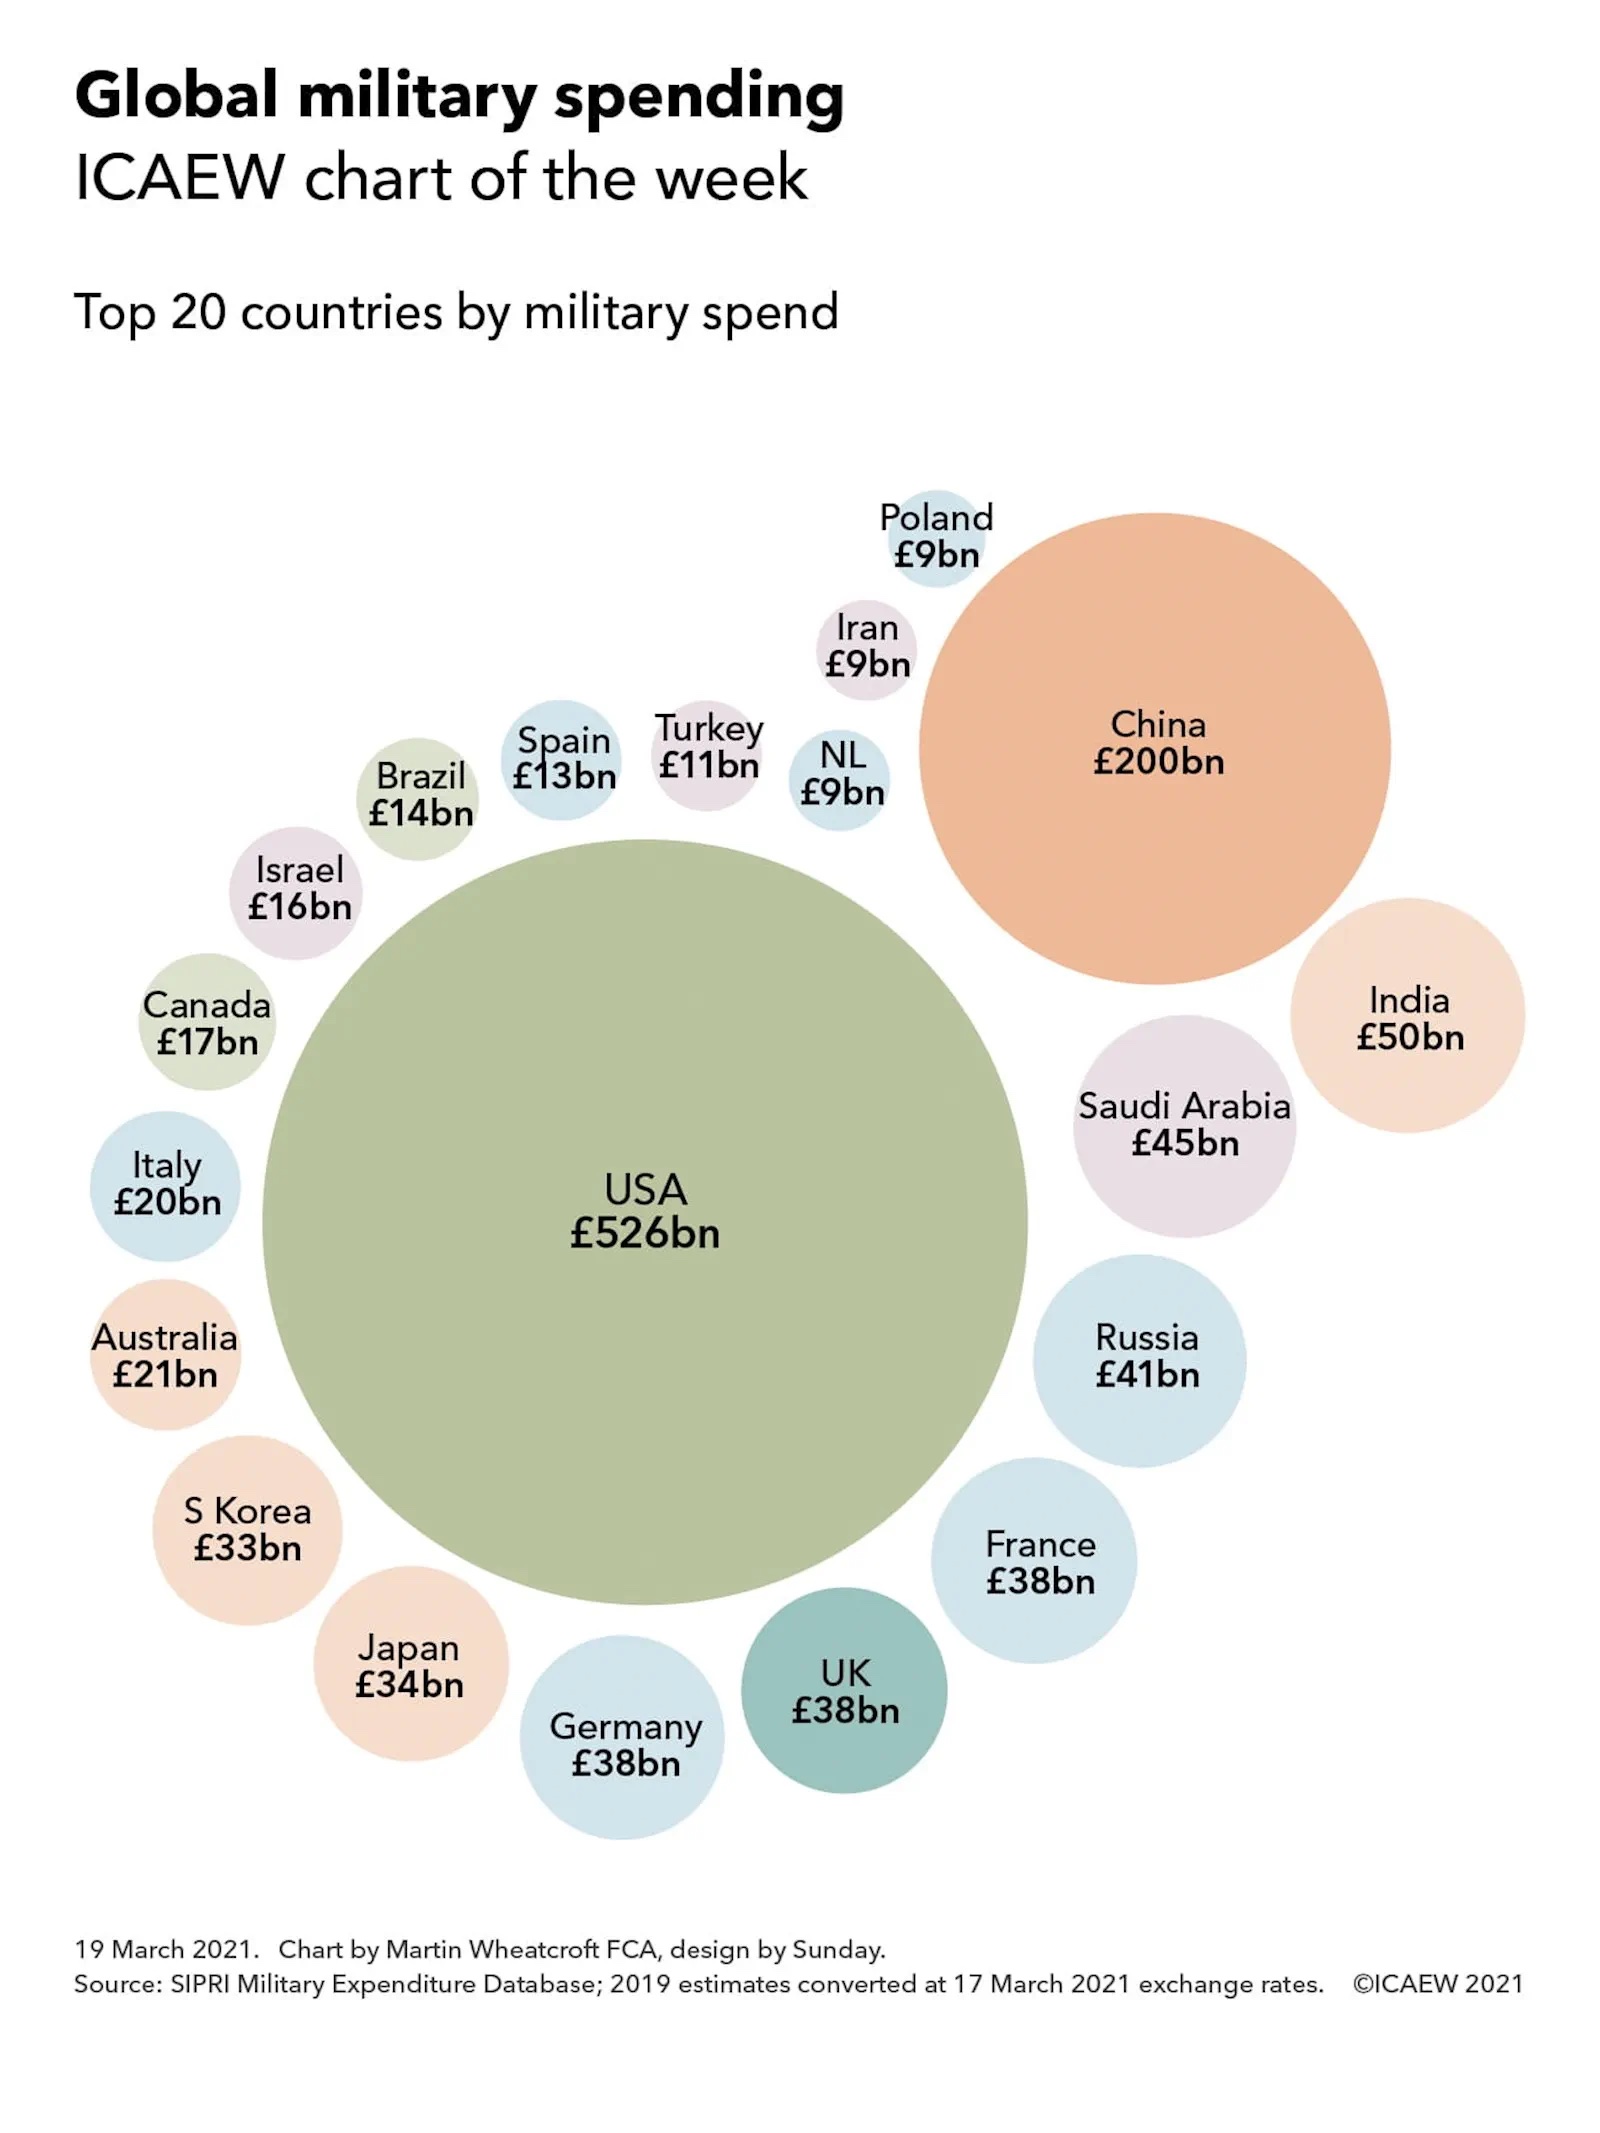
The chart shows spending by the top 20 countries, which together comprise in the order of £1.2tn of estimated total military spending of around £1.4tn to £1.5tn globally in 2019 – an almost textbook example of the 80:20 rule in action.
More than a third of the total spend is incurred by just one country – the USA – which spent in the order of £526bn in 2019 converted at current exchange rates. The next biggest were China and India at £200bn and £50bn respectively, although differences in purchasing power mean that they can afford many more soldiers, sailors and aircrew for the same amount of money. This is followed by Saudi Arabia (£45bn), Russia (£41bn), France (£38bn), the UK (£38bn), Germany (£38bn), Japan (£34bn), South Korea (£33bn), Australia (£21bn), Italy (£20bn), Canada (£17bn), Israel (£16bn), Brazil (£14bn), Spain (£13bn), Turkey (£11bn), the Netherlands (£9bn), Iran (£9bn) and Poland (£9bn).
Exchange rates affect the relative orders of many countries in the list, for example between Russia, France, the UK and Germany which can move up or down according to movements in their currencies, while there are a number of caveats over the estimates used given the different structures of armed forces around the world and a lack of transparency in what is included or excluded in defence budgets in many cases.
In addition, the use of in-year military spending does not necessarily translate directly into military strength. Military capabilities built up over many years or in some cases (such as the UK) over many centuries need to be taken into account, as do differing levels of technological development and spending on intelligence services, counter-terrorism and other aspects of security. Despite these various caveats, estimated military spending still provides a useful proxy in understanding the global security landscape and in particular highlights the UK’s position as a major second-tier military power – in the top 10 countries around the world.
Global Britain in a Competitive Age: the Integrated Review of Security, Defence, Development and Foreign Policy sets out some ambitious objectives for security and defence, which it summarises as follows: “Our diplomatic service, armed forces and security and intelligence agencies will be the most innovative and effective for their size in the world, able to keep our citizens safe at home and support our allies and partners globally. They will be characterised by agility, speed of action and digital integration – with a greater emphasis on engaging, training and assisting others. We will remain a nuclear-armed power with global reach and integrated military capabilities across all five operational domains. We will have a dynamic space programme and will be one of the world’s leading democratic cyber powers. Our diplomacy will be underwritten by the credibility of our deterrent and our ability to project power.”
12 March 2021: This week’s chart illustrates how an expected increase of £1tn of additional public debt between 2020 and 2026 translates into the debt to GDP ratio.
This week’s #icaewchartoftheweek illustrates how a trillion pounds of extra public debt translates into the debt to GDP ratio. This rises from 84.4% last March to a forecast peak of 109.7% in 2024 before falling to 103.8% in 2026, according to the medium-term economic and fiscal forecasts from the Office for Budget Responsibility (OBR) that accompanied the Spring Budget. These forecast a rise in public sector net debt from £1.8tn at 31 March 2020 to £2.8tn at 31 March 2026.
Most of the additional borrowing is expected to occur in the period to March 2024, with £781bn (equivalent to 35.2% of a year’s GDP) borrowed to fund four years of deficits – an estimated £355bn (16.9% of GDP) in the current financial year and forecast deficits of £234bn (10.3% of GDP), £107bn (4.5% of GDP) and £85bn (3.5% of GDP) in 2021-22 through 2023-24 respectively. A further £168bn (7.5% of GDP) is needed over that same period to fund lending and working capital requirements.
Despite borrowing the equivalent of 42.7% of GDP, the debt to GDP ratio is expected to increase by a smaller amount – 25.3% of GDP from 84.4% at 31 March 2020 to 109.7% of GDP at 31 March 2024. This reflects an increase in the denominator for GDP, as a combination of inflation and economic growth ‘inflate away’ the debt by the equivalent of 17.4% over four years. This effect appears quite large, given the annualised growth of 0.7% a year forecast over the four years (comprising a 12% fall during the current financial year followed by growth of 10% in the coming financial year, 5% in 2022-23 and 1.5% in 2023-24) and an average GDP deflator inflation rate of 1.8%, but the magic of compounding, combined with timing differences in the value for GDP used in the calculation all multiply up.
The following two years see the forecast debt to GDP ratio decline to 103.8%. Debt is only expected to increase by £57bn (or 2.2% of GDP) over these two years because lending to businesses during the pandemic is expected to be repaid, reducing the £148bn (5.7% of GDP) needed to fund deficits of £74bn (2.9% of GDP) in 2024-25 and £74bn (2.8% of GDP) in 2025-26 by a net cash inflow of £91bn (3.5% of GDP). As a consequence, the debt to GDP ratio is forecast to drop by 5.9% overall once 8.1% of ‘inflating away’ is taken into account.
As with all forecasts, the reality will be different. A stronger economic recovery would both reduce the need for borrowing and increase the size of GDP at the same time, accelerating the decline in the debt to GDP ratio. A weaker recovery combined with higher spending in response to pressures on public services and/or higher interest rates might do the reverse. Either way, the debt to GDP is likely to remain at a significantly higher level than the pre-financial crisis 34% seen in 2008 for many years, if not decades, to come.
5 March 2021: The Budget provides the basis for this week’s chart, which illustrates government plans to achieve a current budget surplus to meet a new fiscal rule that hasn’t yet been formally announced but was hinted at.
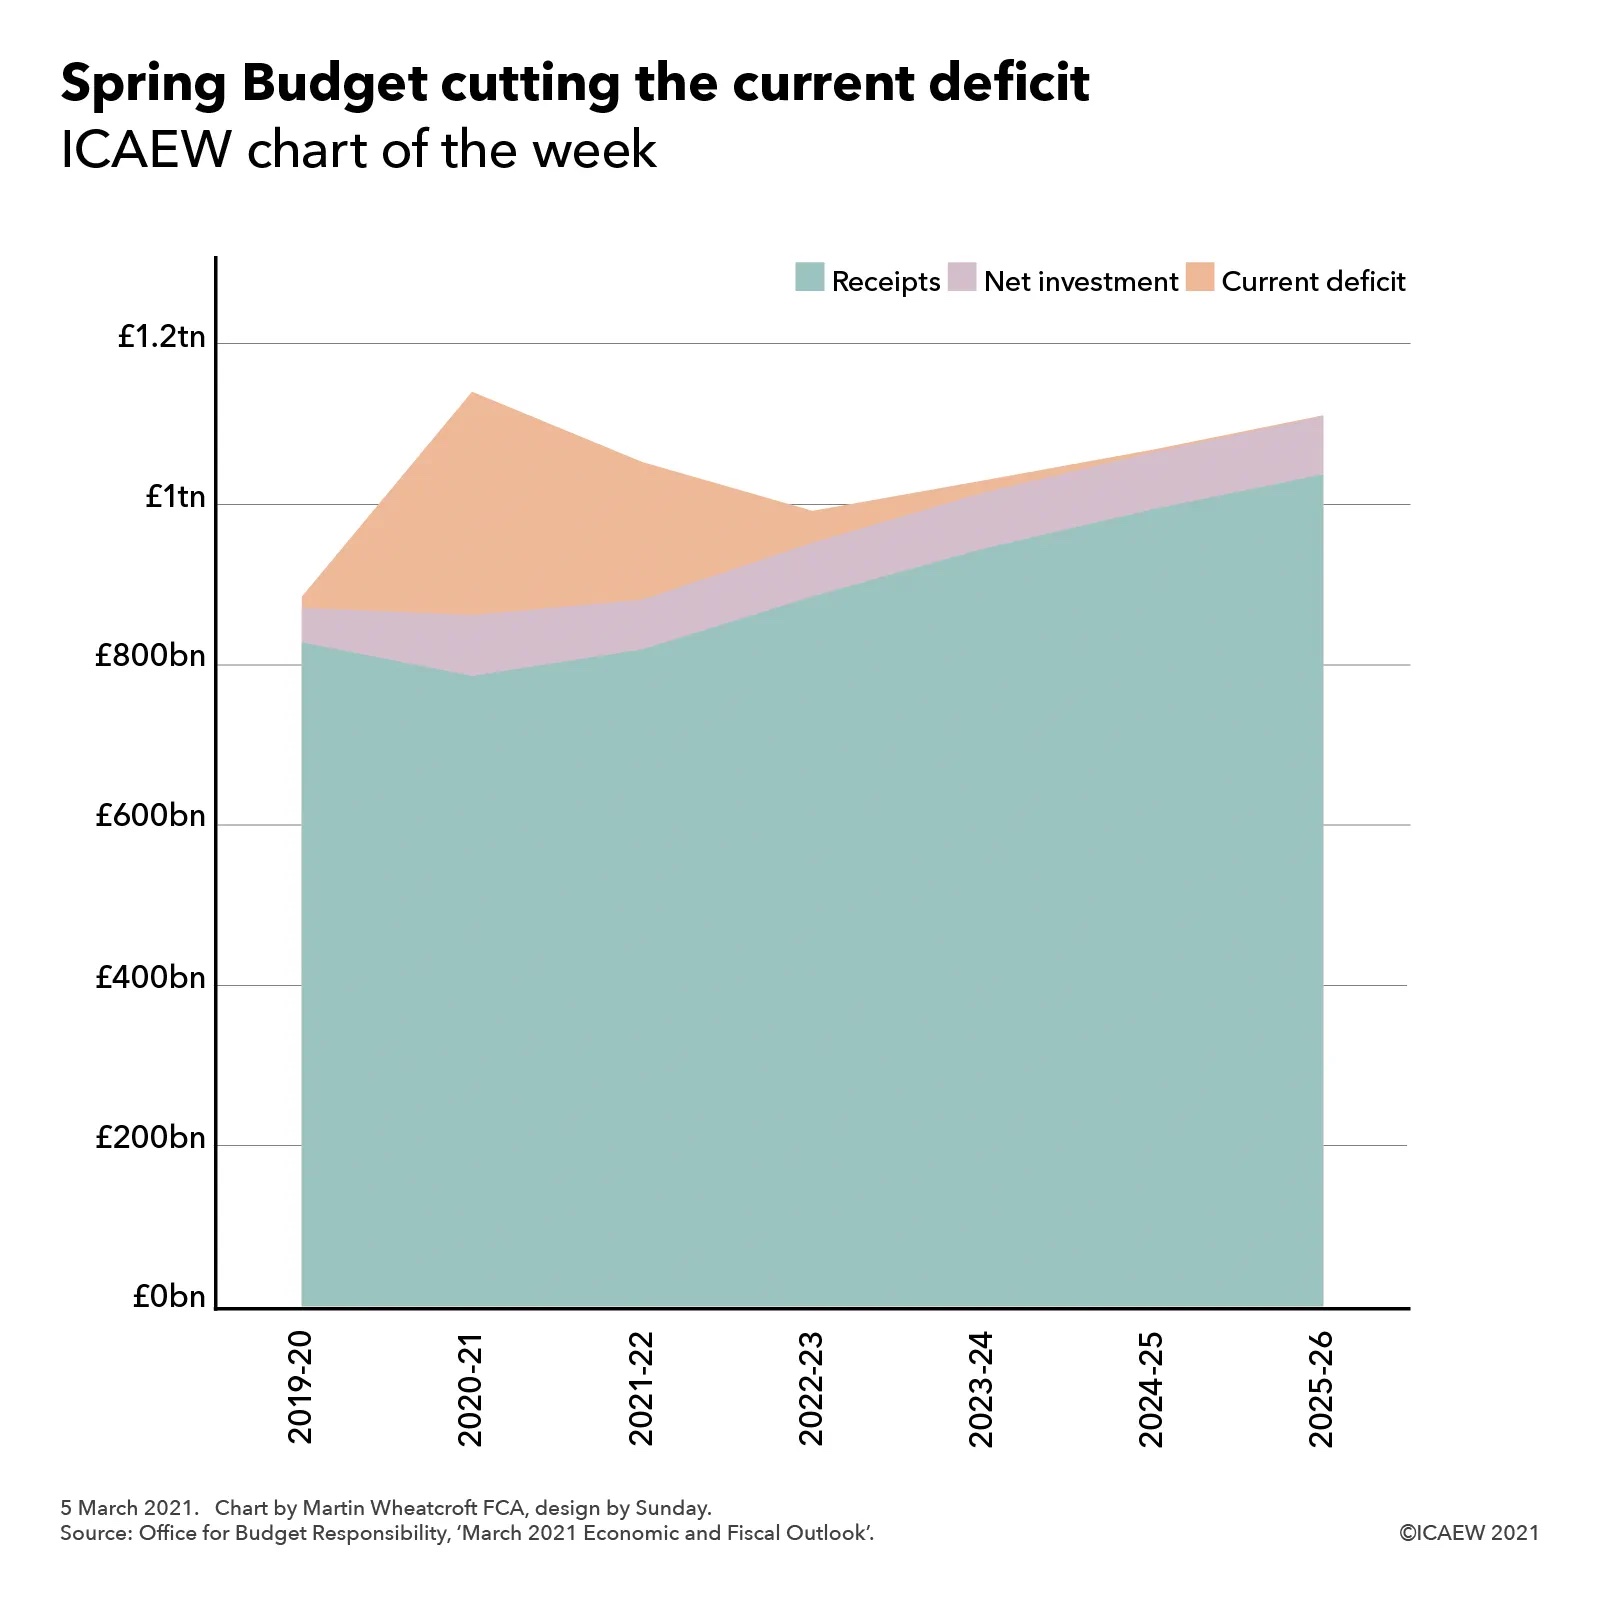
The Chancellor will use a corporation tax rise and spending cuts to cut the current deficit over the next five years, but this relies on the economy recovering as expected and being able to restrain pressures on public spending.
The current deficit – the difference between receipts and expenditure excluding net investment – is expected to go from £14bn in 2019-20 to £279bn in the current financial year before falling to £172bn in 2021-22, £40bn in 2022-23, £15bn in 2023-24, £3bn in 2024-25 and just under £1bn in 2025-26 – almost, but not quite meeting the anticipated fiscal rule hinted at by Rishi Sunak in his Budget speech.
This will only be achievable if the pandemic can be brought under control so that support measures are no longer needed, in addition to depending on the strength of the economic recovery. The government will be hoping that the economic stimulus it plans to provide over the next two years will help drive that growth, with the hope of higher corporate profits to pay a higher rate of corporation tax over the rest of the period.
Despite the uncertainties around the numbers, the Chancellor felt it necessary to trim £4bn a year from public spending to get within touching distance of meeting his non-target – signalling his commitment to ‘fiscal responsibility’ and helping to achieve his other main non-target, which is to see the debt to GDP ratio start to fall after peaking at 110% of GDP in 2024. However, a number of commentators have suggested that this appears unlikely to be achievable, given both pre-existing pressures on public spending and a likely need to provide additional post-pandemic support to the NHS, social care and education in particular.
This provides a challenging context for the three-year Comprehensive Spending Review later this year, especially as the longer-term challenges facing the public finances remain unaddressed. In the nearer term though, the Chancellor will be hoping for a bigger bounce back to the economy over the summer to provide him with more room for manoeuvre in the autumn.
26 February 2021: The Chancellor needs to build a bridge to economic recovery in his first Budget on Wednesday, focusing on jobs, exports and investment. But with the OBR’s official projections showing public debt to be on an unsustainable path, what vision will he set out for the public finances in the long-term?
The Spring Budget announcement on Wednesday will primarily be about the government’s fiscal budget for the financial year commencing 1 April 2021. The UK is still in the midst of a major health emergency and in a difficult economic situation, and the announcement is likely to provide for an extension of support measures for businesses and individuals affected by the pandemic, funding for under-pressure public services and stimulus measures to drive economic growth once restrictions are lifted, particularly in the second half of the financial year.
In the absence of a formal fiscal strategy event in the Parliamentary calendar, the Budget is also the main forum the Chancellor has to discuss the medium and long-term prospects for the public finances. This includes considering the five-year fiscal forecasts prepared by the Office for Budget Responsibility (OBR), as well as setting out any medium-term fiscal rules the government might want to use in determining its tax and spending plans and in demonstrating financial credibility with debt investors and citizens.
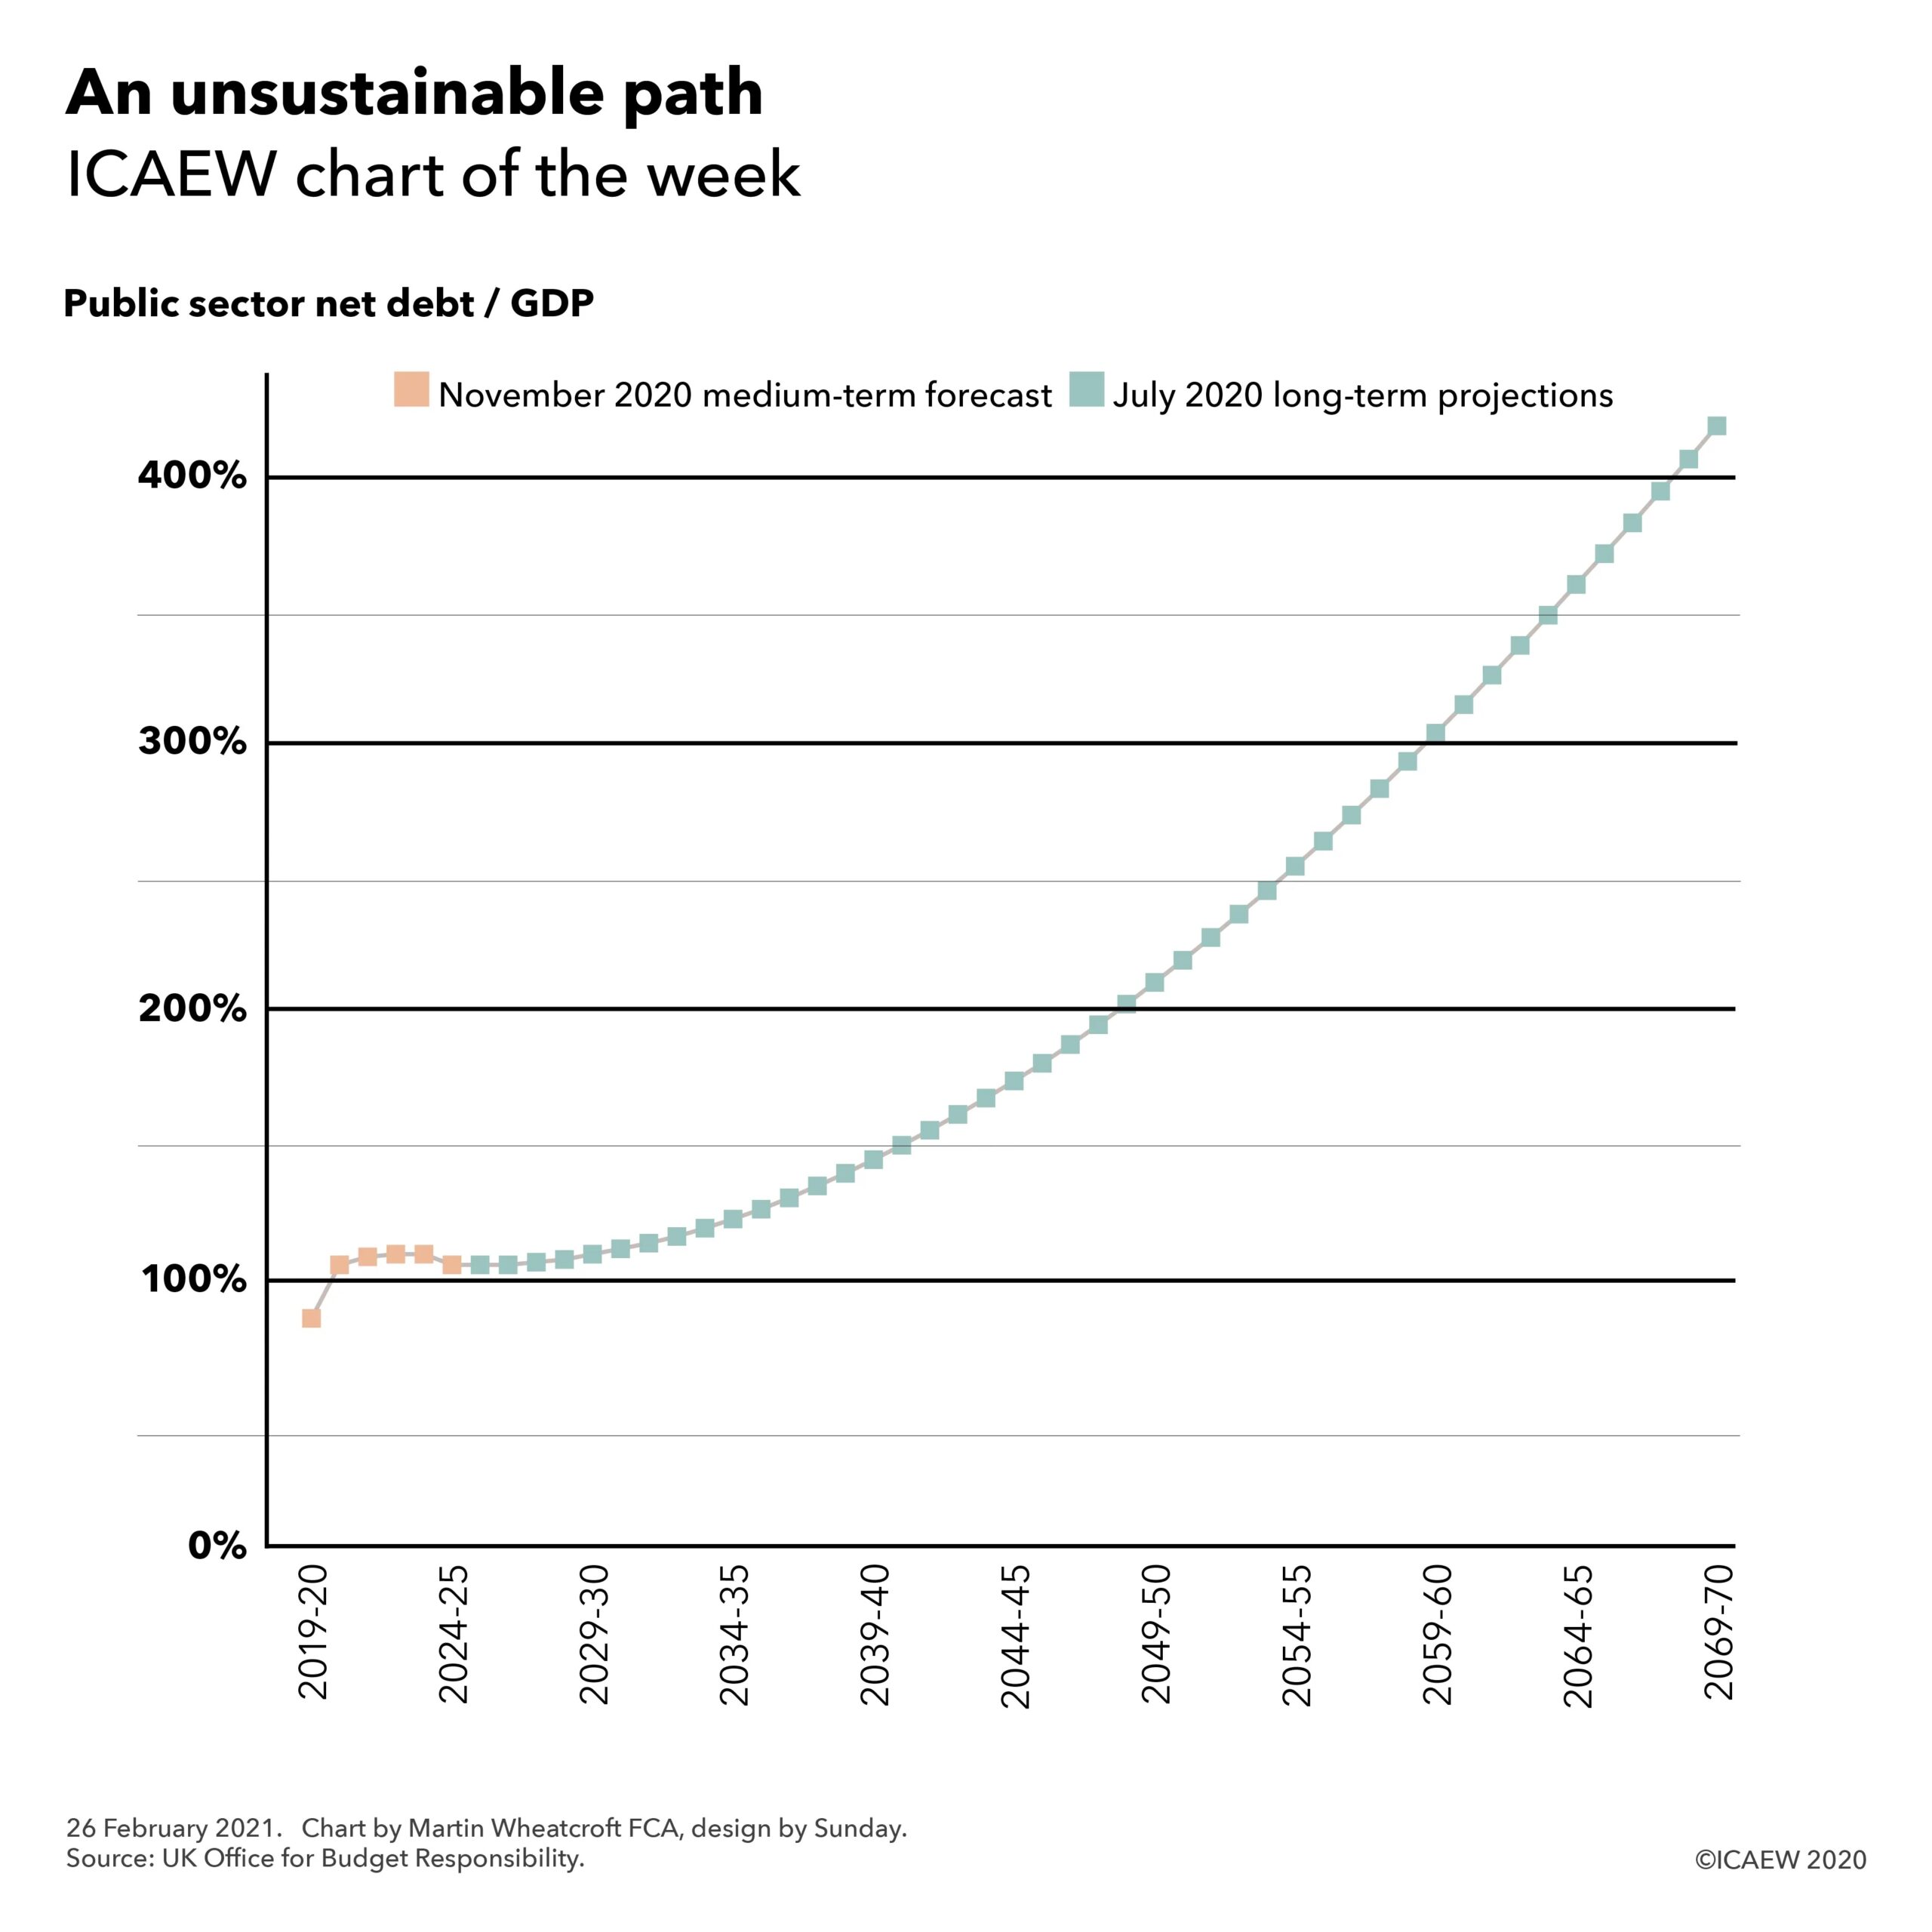
What is often less discussed is the long-term path for the public finances, which – as the #icaewchartoftheweek illustrates – is on an unsustainable path according to the official 50-year fiscal projections prepared by the OBR last July.
These projections indicate that, in the absence of government action, public debt will rise steadily over the next fifty years as public spending grows in line with anticipated demand, and increasing amounts of borrowing will be needed to cover the shortfall between that spending and the amount collected in taxes. It is important to understand that these projections were already on this path before the pandemic arrived and the principal difference between the OBR’s 2020 and 2018 projections is that the initial level of debt has increased from in the order of 80% to just over 100% of GDP. The starting point may be higher, but the fundamental issues haven’t changed.
This financial backdrop permeates every Budget and is the reason the Chancellor finds himself constrained in the choices he can make, despite ultra-low interest rates that currently permit him to borrow huge sums for one-off expenditures at almost no cost. He doesn’t have the same freedom when it comes to permanent increases in spending, whether that be on health, social care, welfare, education, defence or other public services, especially if he wants to minimise the scale of any potential tax increases. Of course, higher economic growth would help – but as successive Chancellors have found that is not so easy to deliver.
So while much of the focus on the Budget on Wednesday will be on the short-term extension of the life support package for individuals and businesses while restrictions remain in place and the economic stimulus thereafter, the Chancellor’s words will also be scrutinised for his vision on the direction of travel for the public finances beyond the end of the next financial year.