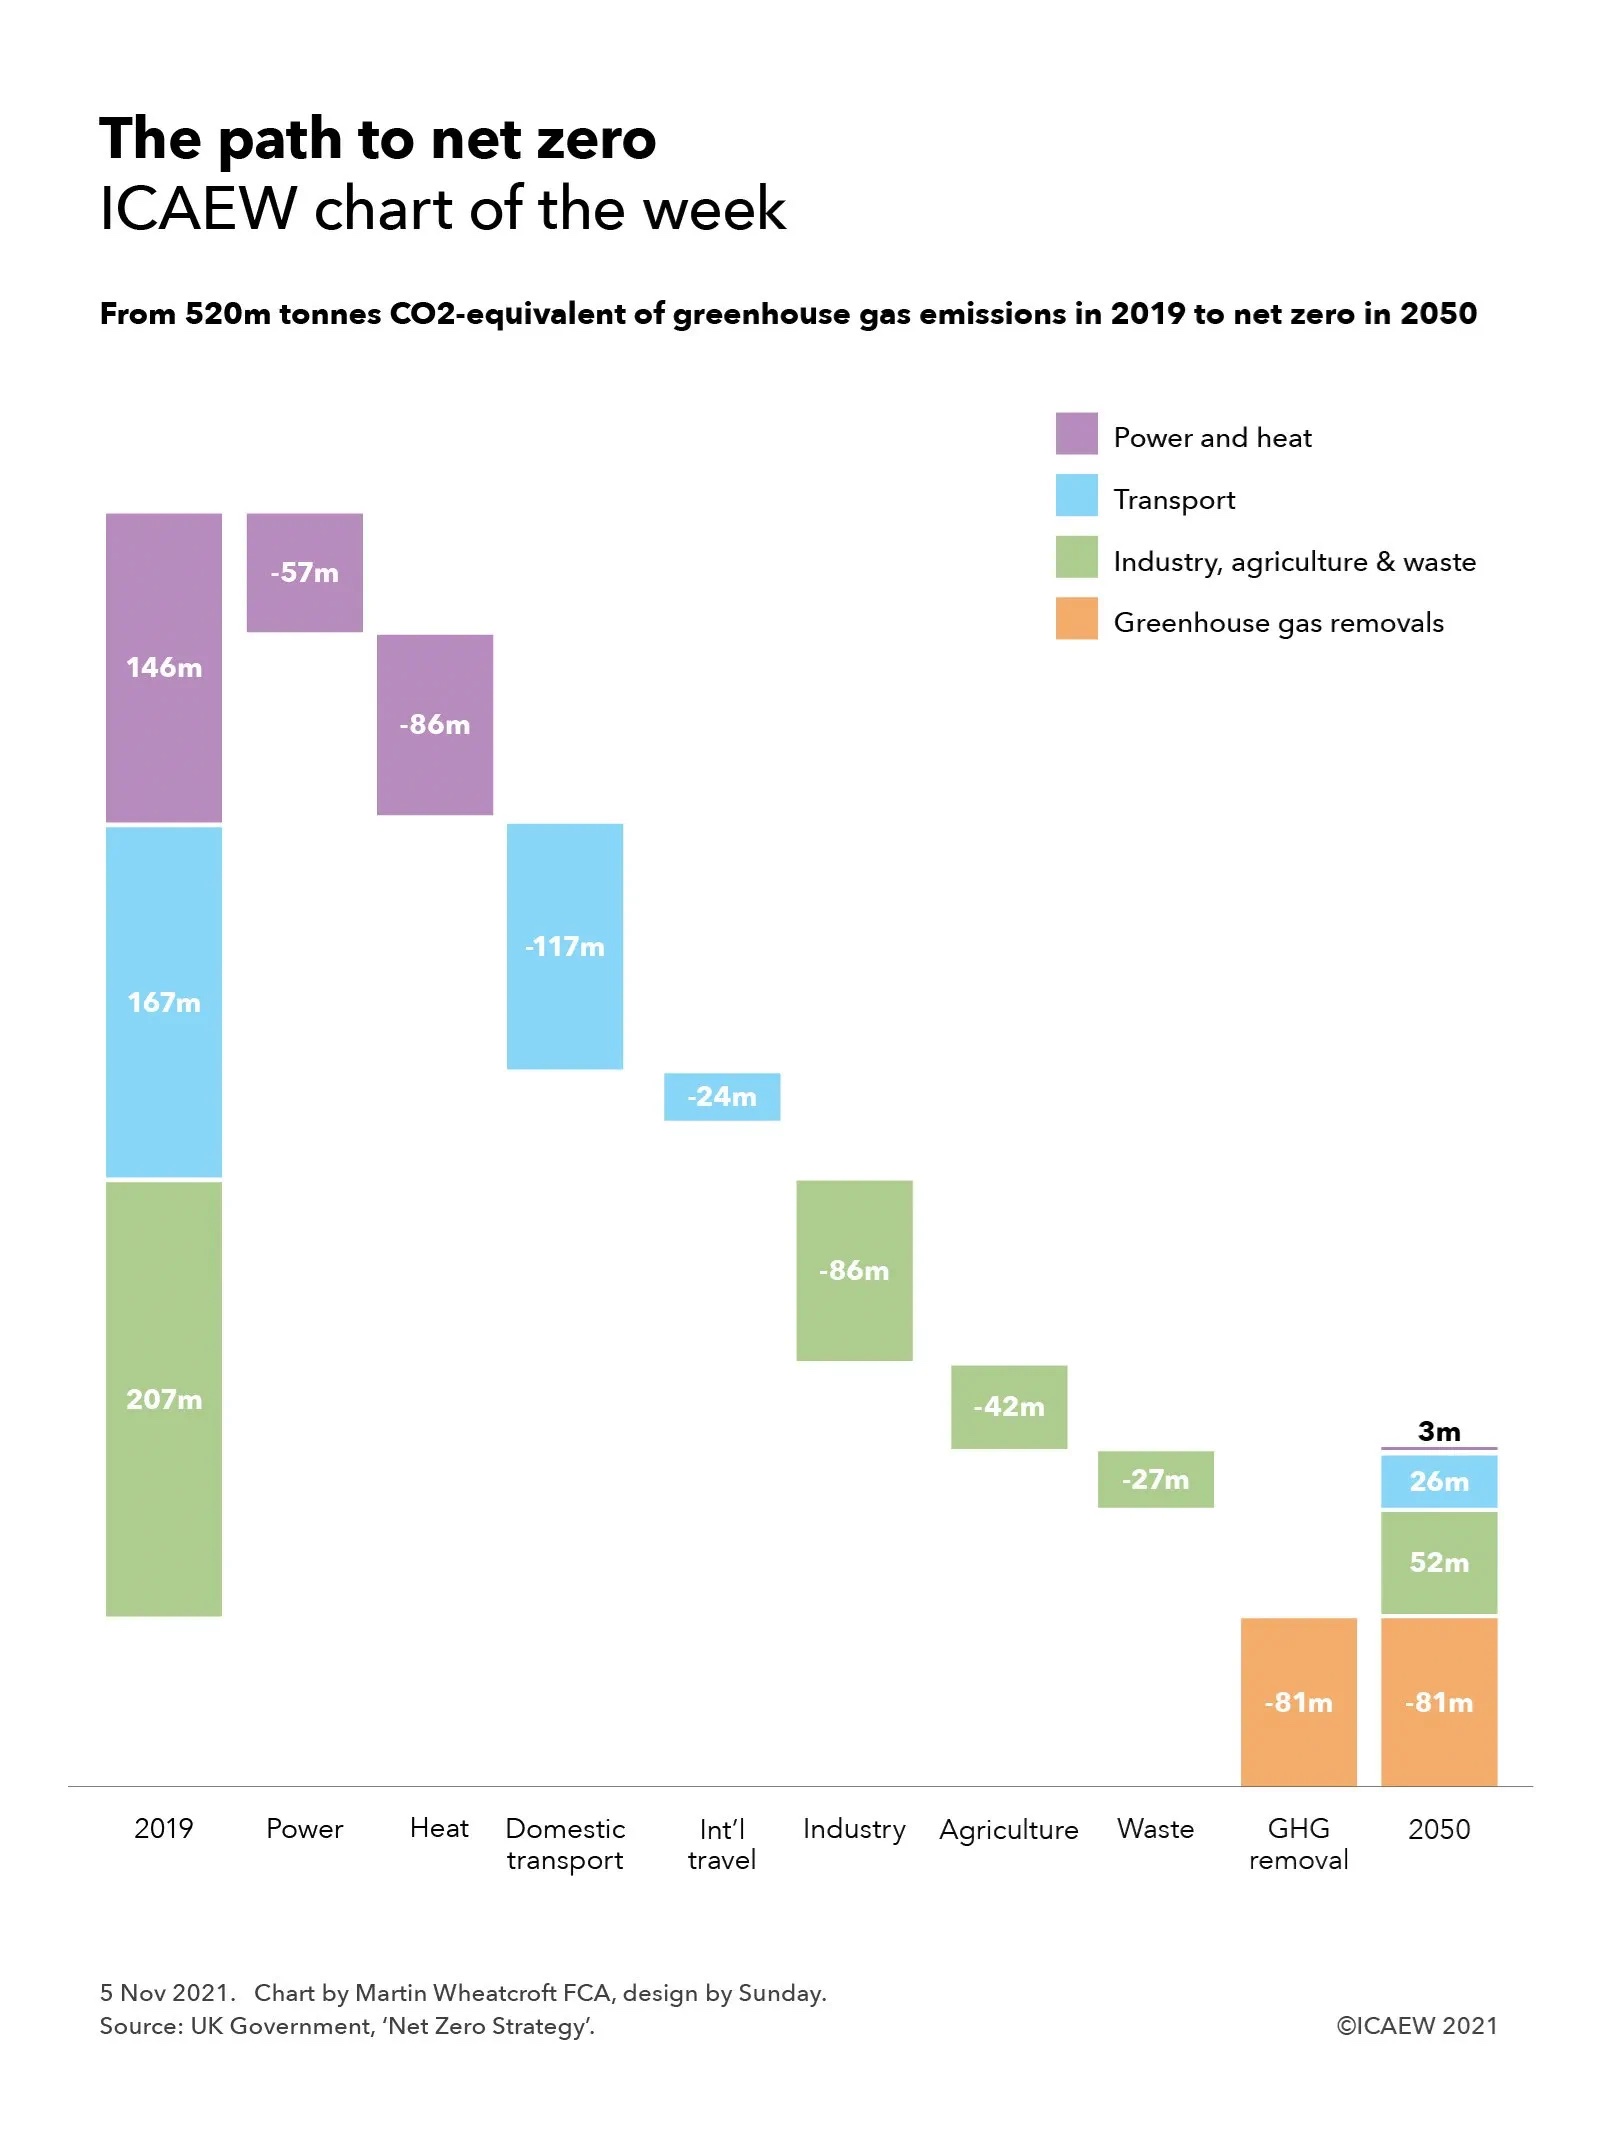
While November’s deficit of £17.4bn is in line with expectations, public sector net debt is up by more than half a trillion pounds since the start of the pandemic and as a proportion of GDP, debt is the highest it has been since March 1963.
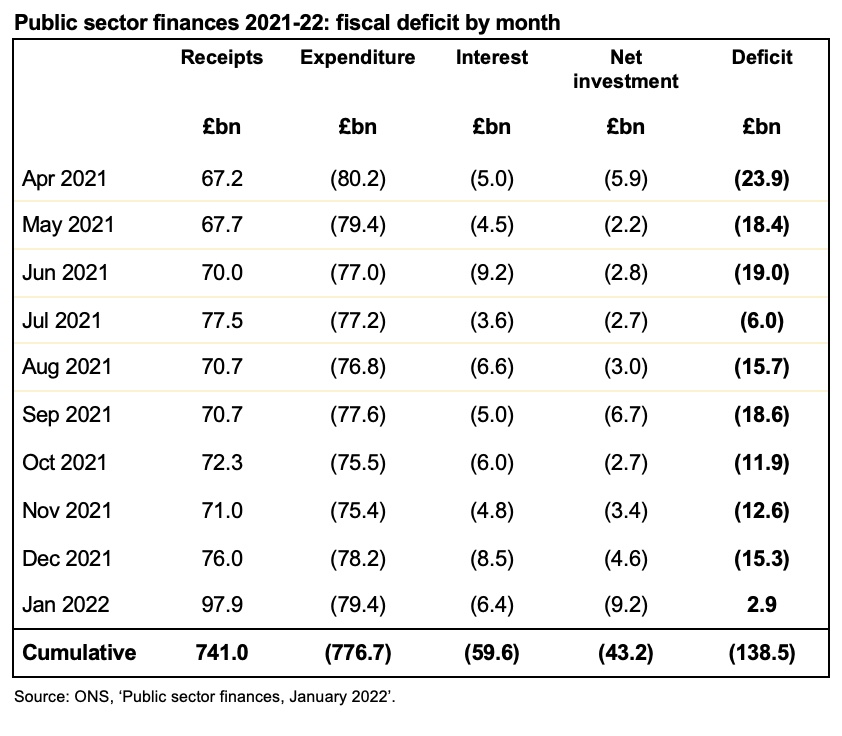
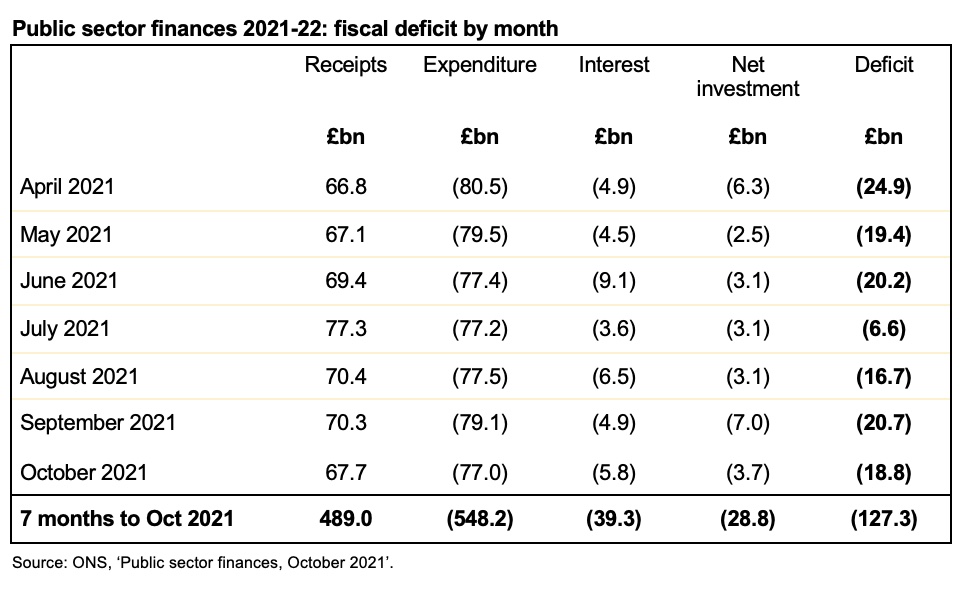
The public sector finances for November 2021 released on Tuesday 21 December reported a monthly deficit of £17.4bn – £4.8bn lower than the £22.2bn reported for November 2020 but £11.8bn higher than the £5.6bn deficit reported for November 2019.
This brings the cumulative deficit for the first eight months of the financial year to £136.0bn compared with £251.7bn and £52.5bn for the same period last year and the year before that respectively.
Public sector net debt increased from £2,283.0bn at the end of October to £2,317.7bn or 96.1% of GDP at the end of November. This is £183.3bn higher than at the start of the financial year and an increase of £524.6bn over March 2020. As a proportion of GDP, debt is the highest it has been since March 1963, almost 60 years ago.
The increase in public sector net debt of £34.7bn in the month reflects borrowing to finance the deficit of £17.4bn and £26.9bn in the final tranche of the Bank of England’s Term Funding Scheme, offset by repayments in coronavirus lending as well as other net movements.
As in previous months this financial year, the deficit came in below the forecast for 2021-22 prepared by the Office for Budget Responsibility (OBR) in March 2021 but was in line with the OBR’s revised forecast issued in October 2021 alongside the Autumn Budget and Spending Review 2021.
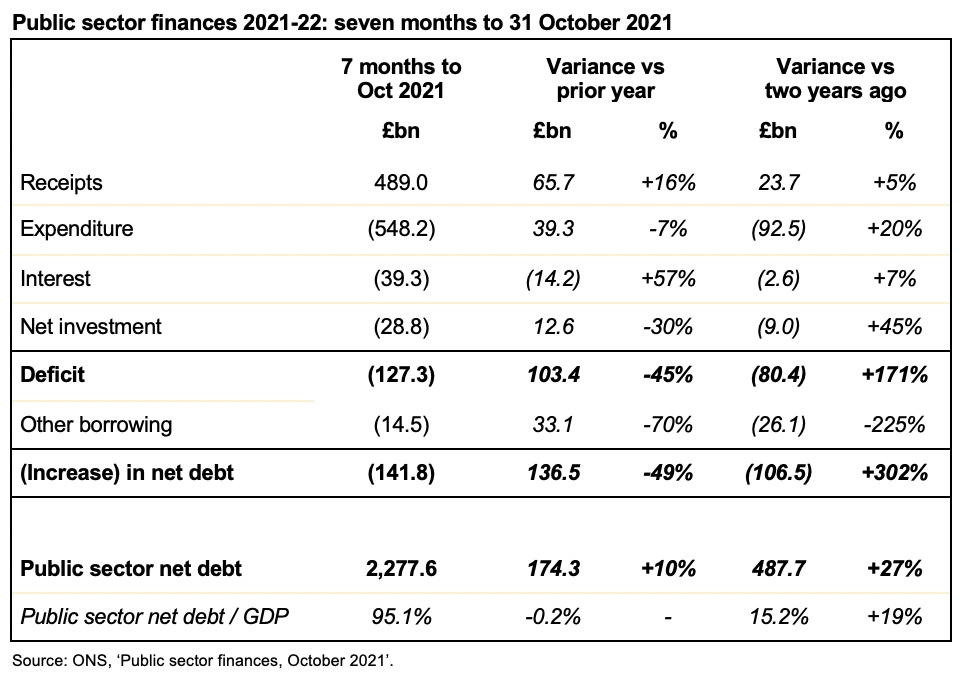
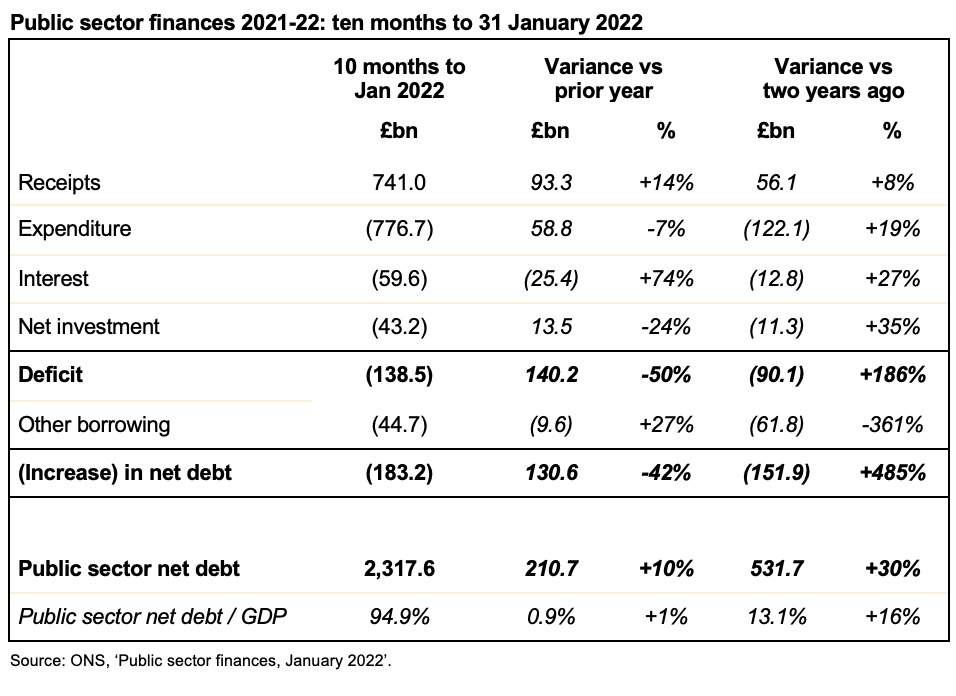
Cumulative receipts in the first eight months of the 2021-22 financial year amounted to £560.7bn, £71.4bn or 15% higher than a year previously, but only £31.2bn or 6% above the level seen a year before that in 2019-20. At the same time cumulative expenditure excluding interest of £622.7bn was £44.4bn or 7% lower than the first eight months of 2020-21, but £102.1bn or 20% higher than the same period two years ago.
Interest amounted to £44.2bn in the eight months to October 2021, £14.6bn or 49% higher than the same period in 2020-21, principally because of higher inflation affecting index-linked gilts. Despite debt being 29% higher than two years ago, interest costs were only £5.0bn or 13% more than the equivalent eight months ended 30 November 2019.
Cumulative net public sector investment in the eight months to November 2021 was £29.8bn. This was £14.5bn less than the £44.3bn reported for the first eight months of last year, which included around £17bn or so of coronavirus lending that is not expected to be recovered. Investment was £7.6bn or 34% more than two years ago, principally reflecting a higher level of capital expenditure, in particular on investment in HS2.
Debt increased by £183.3bn since the start of the financial year, £47.3bn more than the deficit. This reflects funding to cover outflows on lending, including to banks through the Term Funding Scheme, lending to businesses through the British Business Bank, and student loans, offset by the receipt of taxes deferred last year and the repayment of coronavirus loans taken out during the pandemic.
Commenting on the figures Alison Ring, ICAEW Public Sector and Taxation Director, said: “While the numbers for November are in line with expectations, it’s notable that debt has risen both in cash terms and as a proportion of GDP, and at 96.1% is the highest it has been for almost 60 years. The monthly deficit of £17.4bn is below the peaks of last year but still substantially above the pre-pandemic position.
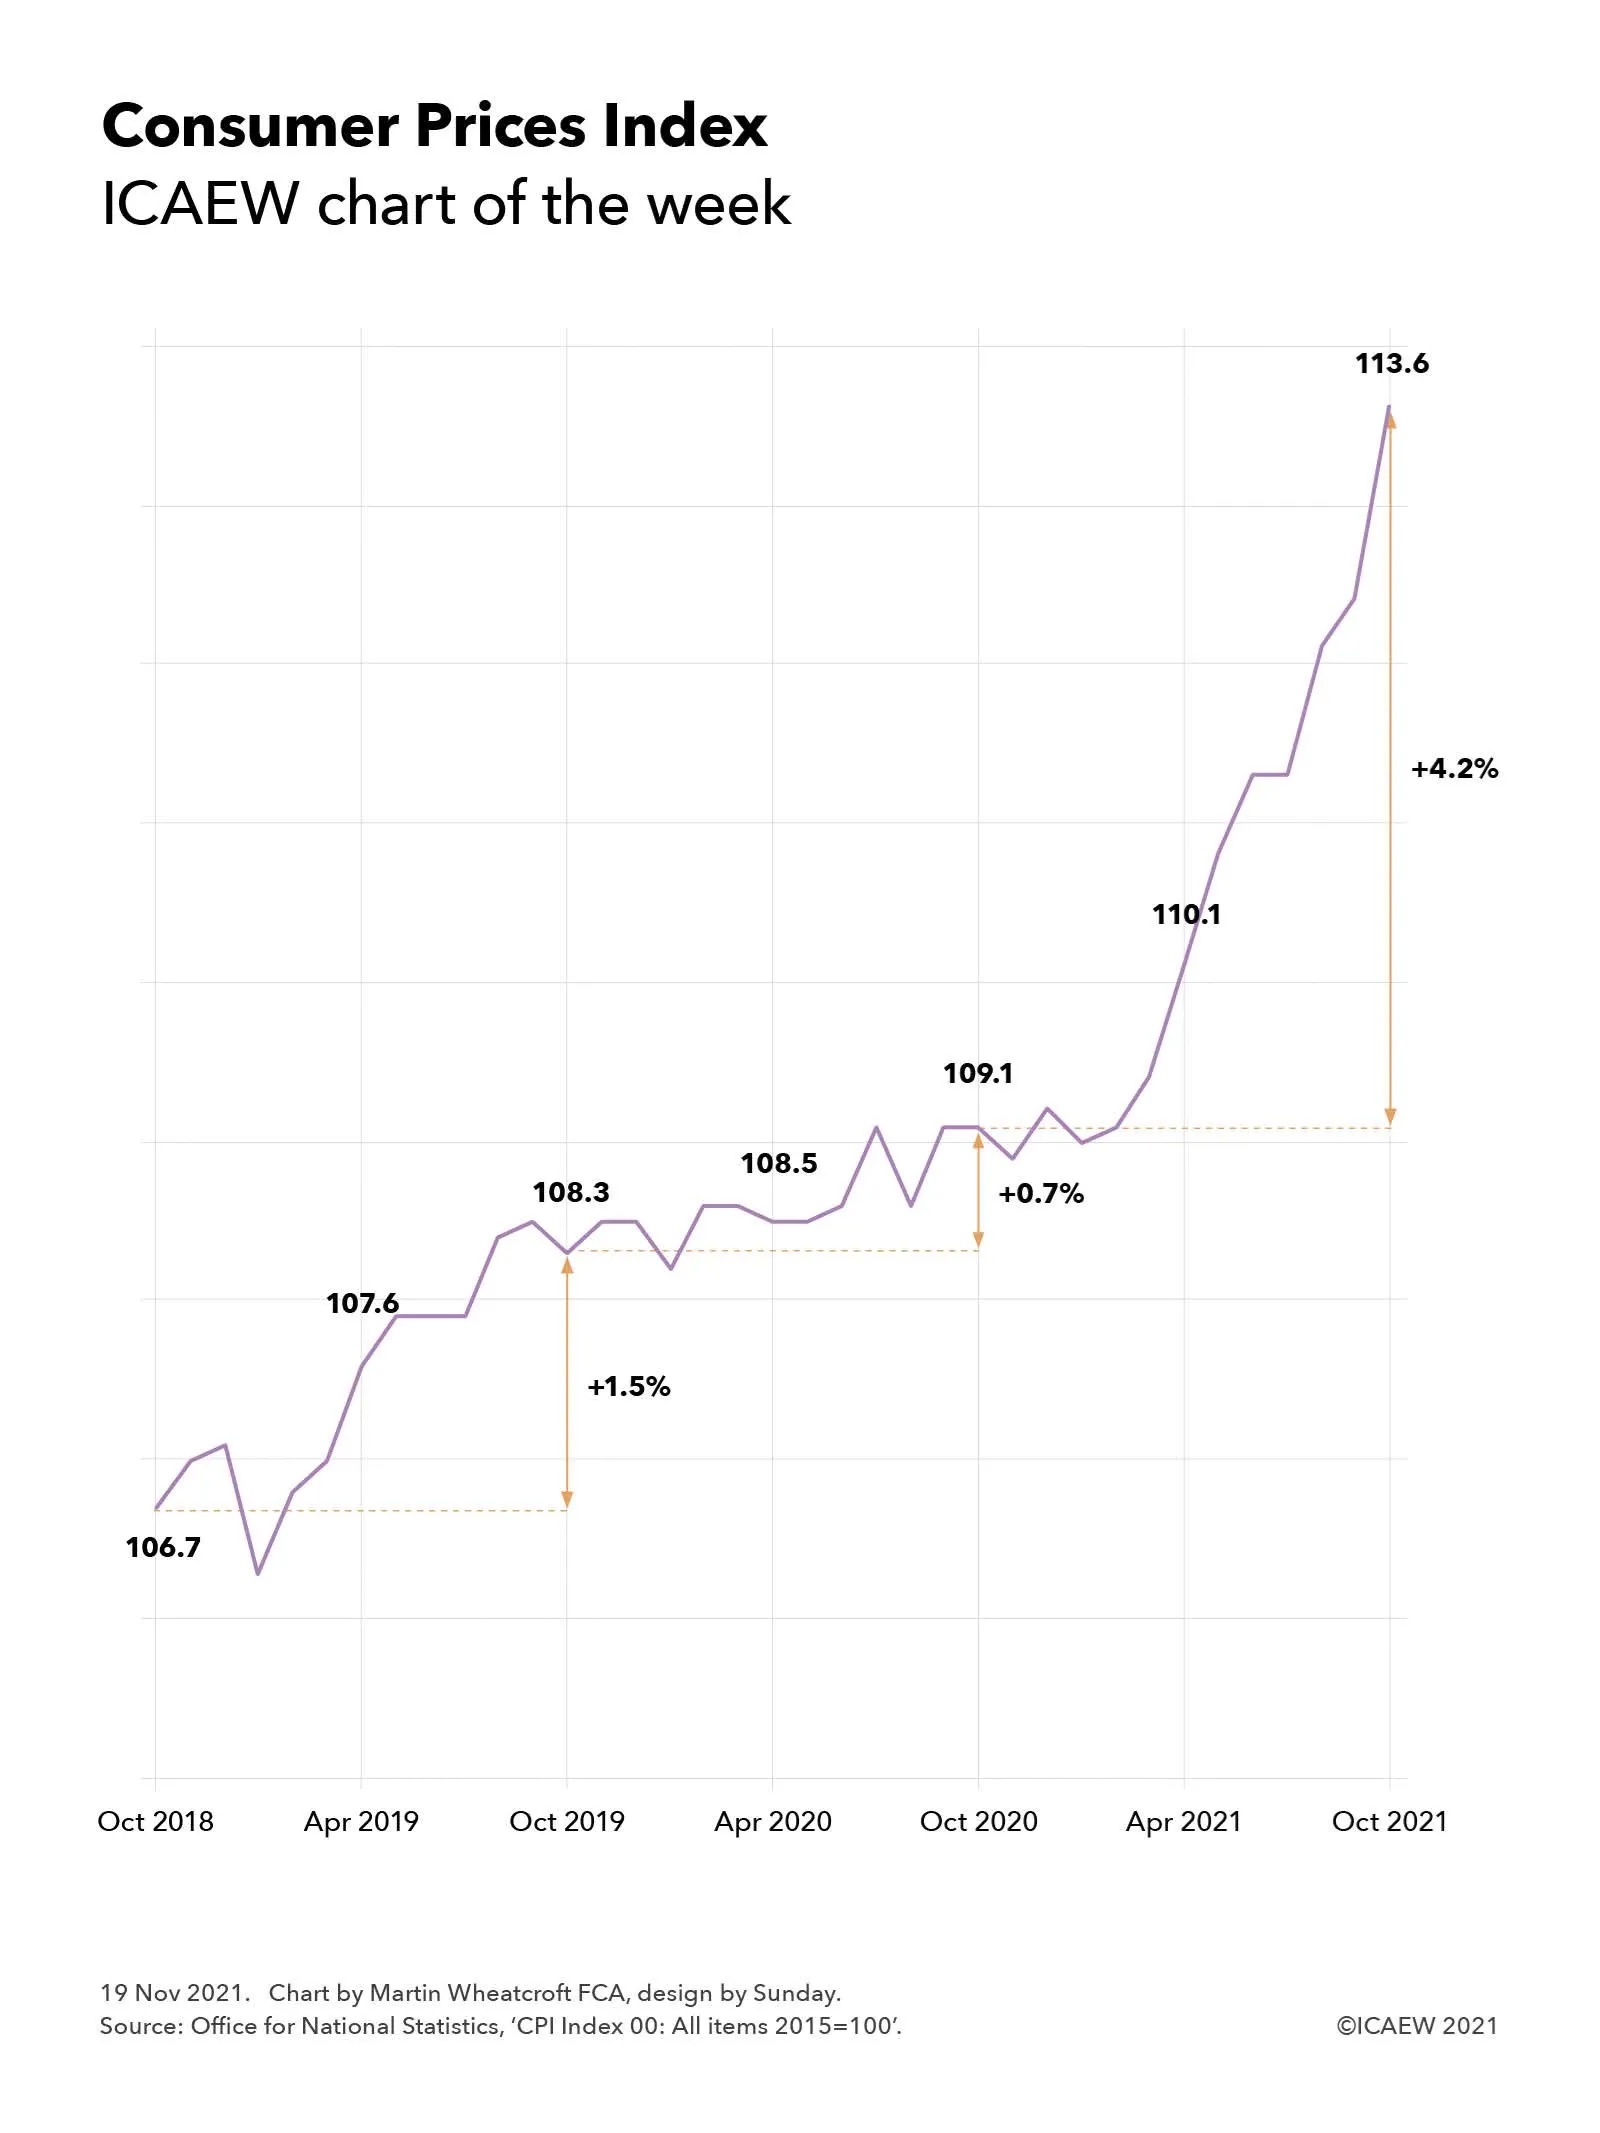
“Despite the rise in interest rates earlier this month, the Chancellor is still able to take advantage of historically-low borrowing costs if he wants to provide support to businesses adversely affected by the Omicron variant and prevent further scarring to the economy. His concern will be how to do so without stoking inflation, which is expected to head even higher over the next few months.”
Caution is needed with respect to the numbers published by the ONS, which are expected to be repeatedly revised as estimates are refined and gaps in the underlying data are filled.
The ONS made a number of revisions to prior month and prior year fiscal numbers to reflect revisions to estimates. These had the effect of decreasing the reported fiscal deficit for the seven months to October 2021 from £127.3bn to £118.6bn and the deficit for the year ended 31 March 2021 from £323.1bn to £321.9bn.