The Chancellor used tax rises to start repairing the public finances but spending pressures could derail his hopes for a pre-election tax giveaway in 2023 or 2024.
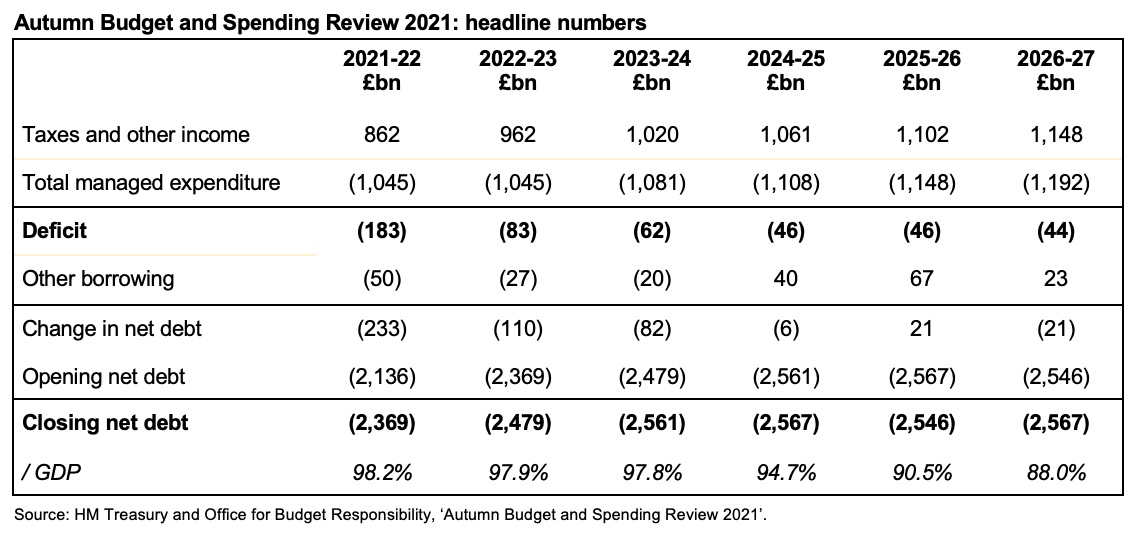
Wednesday’s Autumn Budget and Spending Review saw total public spending settle permanently above a trillion pounds a year, as additional spending increases more than offset the end of temporary COVID-19 interventions.
A ‘Boris Budget’ – full of fizz and capital spending announcements
Despite Rishi Sunak’s avowed commitment to a small state and low taxes, the Autumn Budget reality featured both higher taxes and higher spending, and the Spending Review focused on addressing the many pressures bearing down on public services.
The Chancellor benefited from a faster rebound in the economy due to the vaccination programme, as well as being helped by the time lag between inflation benefiting the revenue line and when it starts to feed through into public spending. Combined with the health and social care levy and other tax rises, this provided him with the budgetary capacity to increase spending on health, reverse previously announced cuts in departmental spending, and still reduce borrowing.
This led the Resolution Foundation to label this a ‘Boris Budget’, reflecting the reputedly more generous instincts of Prime Minister Boris Johnson as compared with his Chancellor.
The Office for Budget Responsibility (OBR)’s high-level analysis was that the Chancellor used around half the £50bn net benefit from forecast revisions and tax rises in 2022-23 to increase spending, with the balance reducing the deficit from £107bn to £83bn. However, the Institute for Fiscal Studies (IFS) points out that, apart from health and social care, the additional spending mostly reversed planned cuts made during the November 2020 and March 2021 Budgets that were always going to be difficult to achieve in practice.
The good news from better economic forecasts, including the OBR’s revision of its estimate of the permanent scarring effect on the economy from 3% to 2%, was offset by concerns over the impact of inflation on living standards and the impact of the ending of the temporary uplift in universal credit on those on low incomes.
Higher inflation will also put public sector budgets under pressure as higher wage settlements and supplier costs start to eat into the spending increases awarded as part of the Spending Review. Clearing backlogs built up over the course of the pandemic will absorb further amounts, while there is also a risk that construction worker shortages and rising construction costs will make it difficult to deliver on the capital programmes announced in such a flurry over the weekend before the Budget announcement.
Unemployment – the dog that didn’t bark
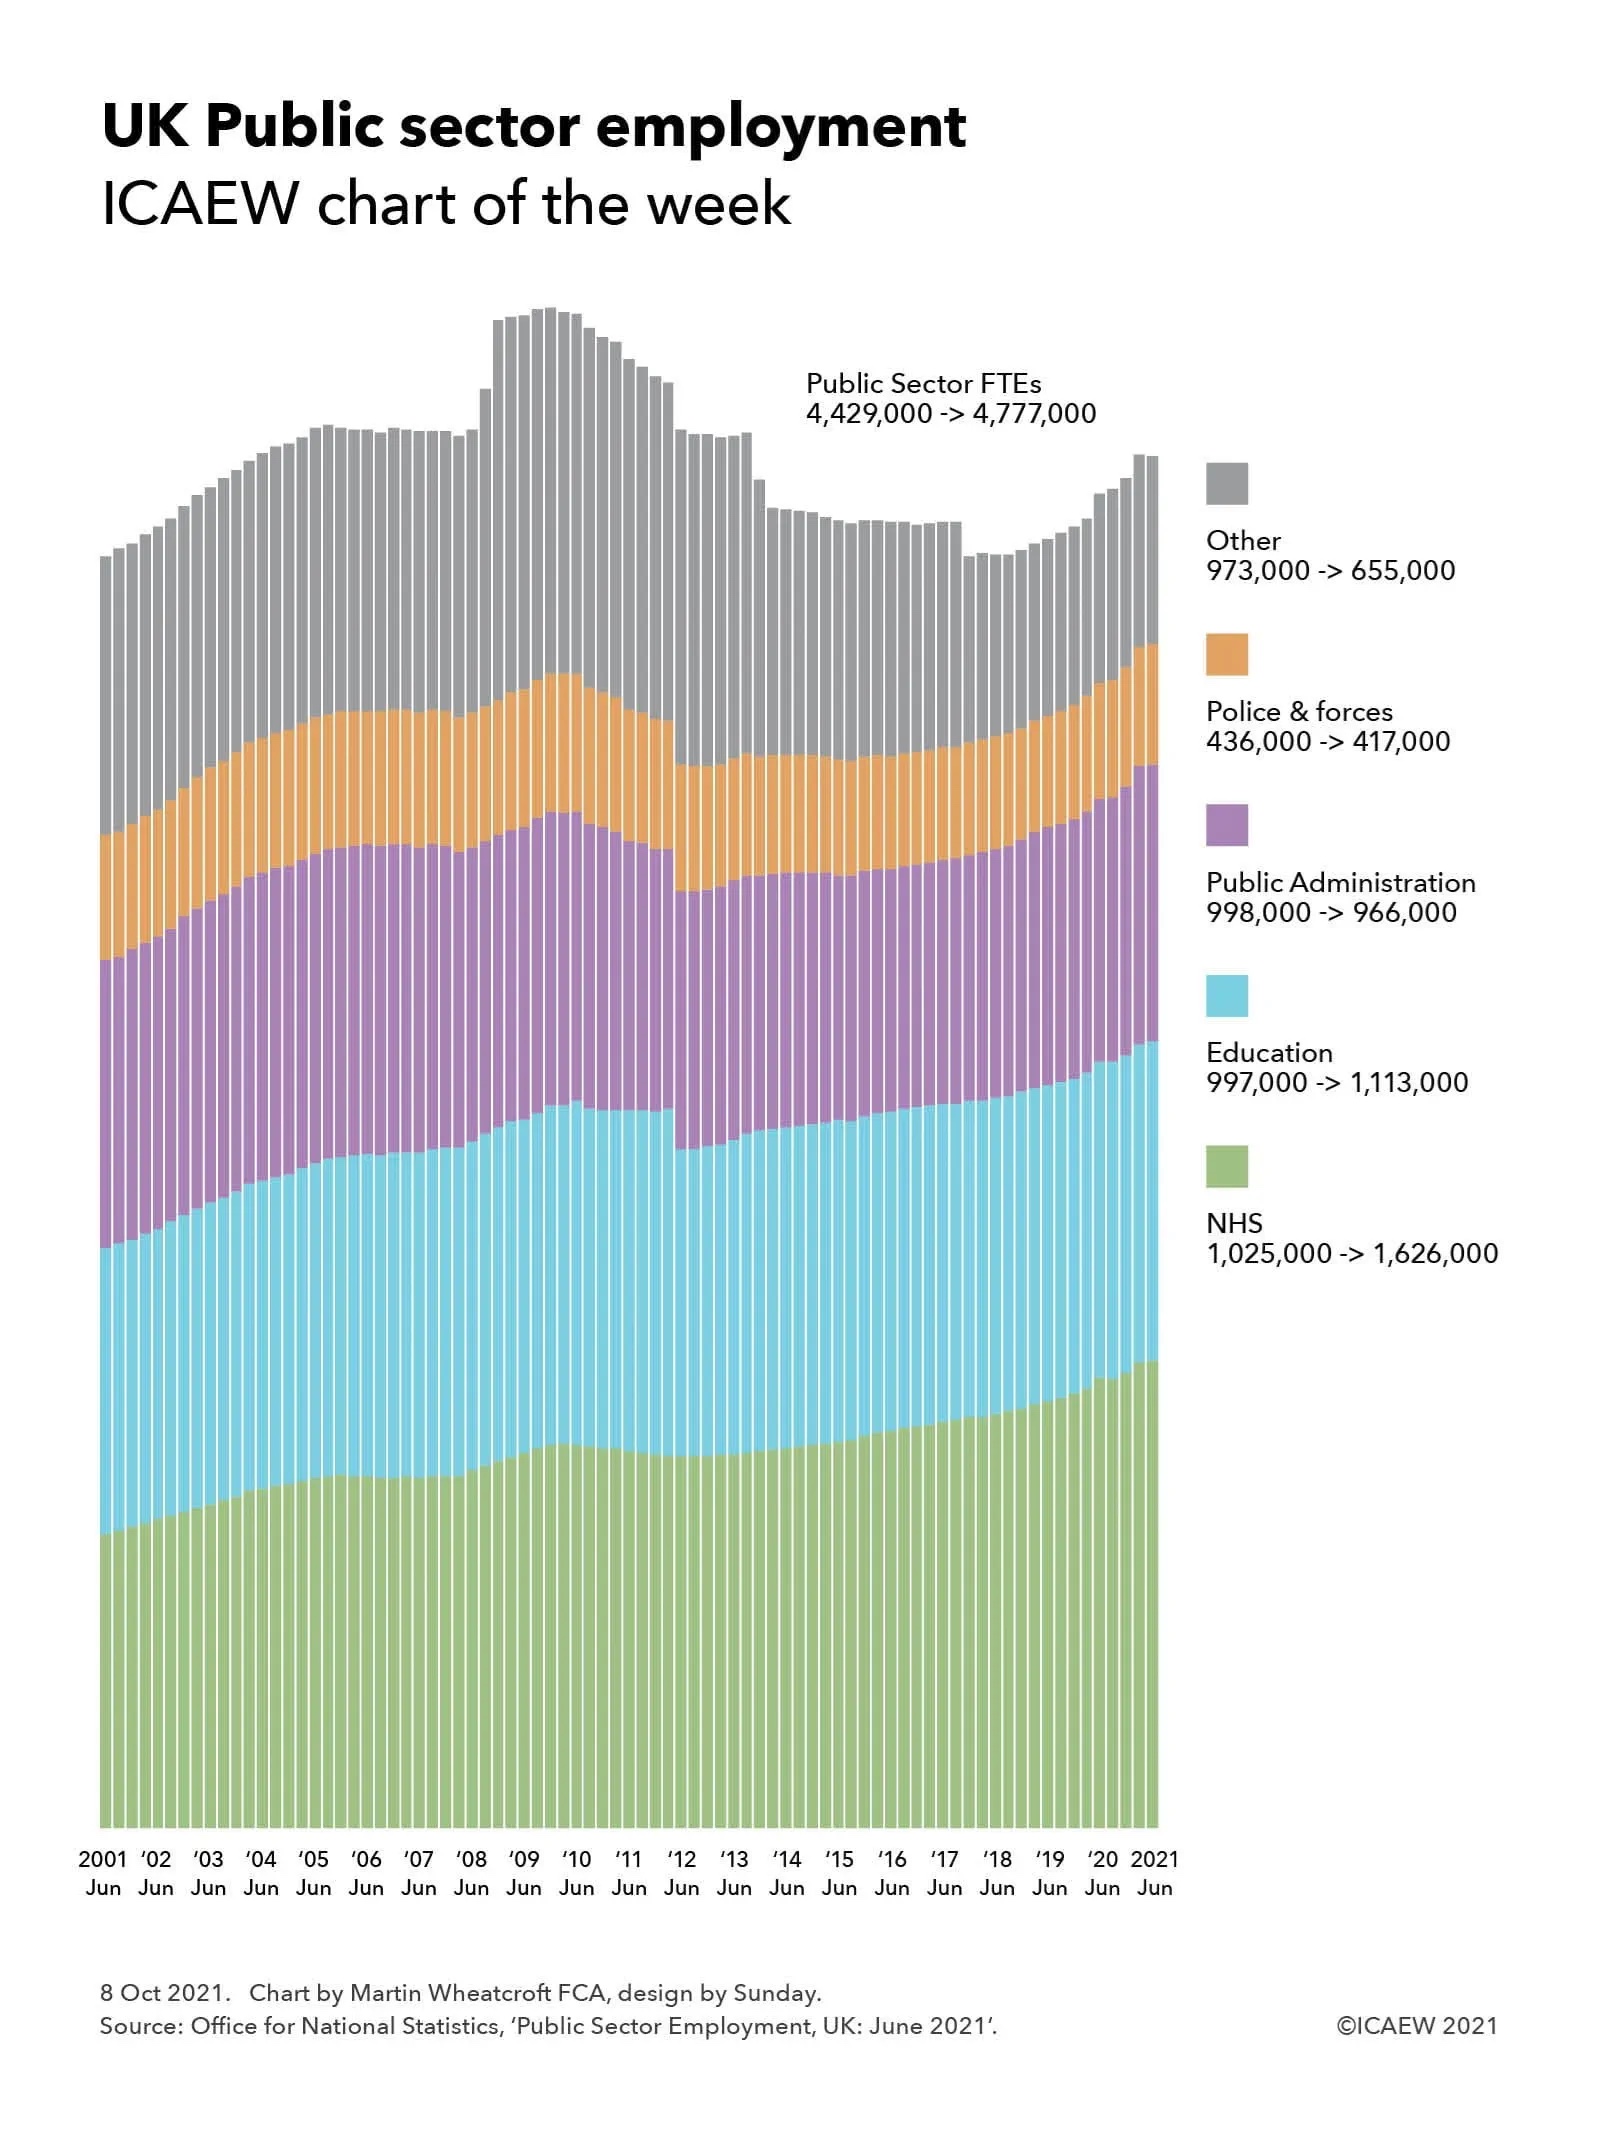
One of the key reasons for the better economic situation than was expected at the start of the pandemic is that unemployment has not gone up significantly. The contribution of the furlough schemes and business support has been hugely significant to this outcome, not only by supporting workers and businesses during successive lockdowns but more importantly preserving businesses and the jobs for workers to return to as pandemic restrictions have been lifted.
Unemployment may still increase following the ending of the furlough schemes in September, but any increase is likely to be significantly smaller than the potential more than doubling in unemployment rates that some had anticipated at the start of the first lockdown.
Modest tax reforms overshadowed by higher tax rates, fiscal drag and a major ‘tax’ cut
Perhaps the most radical ‘tax’ change announced in the Autumn Budget was not a formal tax at all. The reduction in the universal credit taper rate from 63% to 55% is in effect a significant tax cut on those on the lowest incomes, even if it still leaves poorer households on higher effective marginal rates than those earning over £150,000 a year. It also does not make up for the removal of the temporary £20 a week boost to universal credit that has already started to hit many of the poorest households this month.
Higher inflation benefits the public finances by increasing fiscal drag as tax allowances reduce in value in real terms, bringing more people into the scope of income tax or onto higher tax bands. This is a hidden tax increase that brings in more for the government without it needing to increase headline rates.
Of course, the government did that as well. The headline rates of employee national insurance, employer national insurance and dividend tax were increased by 1.25% in the coming year, even if in subsequent years the health and social care levy will appear on payslips and PAYE statements as a separate tax in its own right.
Modest reforms to business rates (principally more frequent revaluations), alcohol duties, and air passenger duties were relatively light touch compared with the previously announced health and social care levy and the planned 6% increase in the main corporation tax rate, even if banks saw a reduction of 5% in the bank levy on corporate profits to offset some of that increase.
More money for health and the criminal justice system, but less for the armed forces
The Spending Review saw extra money for health (funded by the new health and social care levy) where demographic pressures continue to drive demand in addition to dealing with the costs of the pandemic and the backlog of treatments that have built up.
The criminal justice system also received a substantial settlement (4.1% on average over three years), but this will not be sufficient to restore spending to the level before austerity. Indeed, the IFS has calculated that with the exception of the Department for Health & Social Care, the Home Office and the Department for Education, all other departments will continue to spend less in real terms than they did in 2009-10.
One surprise in the detail was the flat current spending settlement for the Ministry of Defence over the coming three years, implying a further cut in spending in real terms on the armed forces, which are expected to contract even further than they have done already. While equipment spending is up as part of a ‘more drones, fewer soldiers’ policy, this is one area where additional settlements in the next couple of Budgets appear more likely than not.
Higher levels of capital investment targeted at boosting regional economic growth
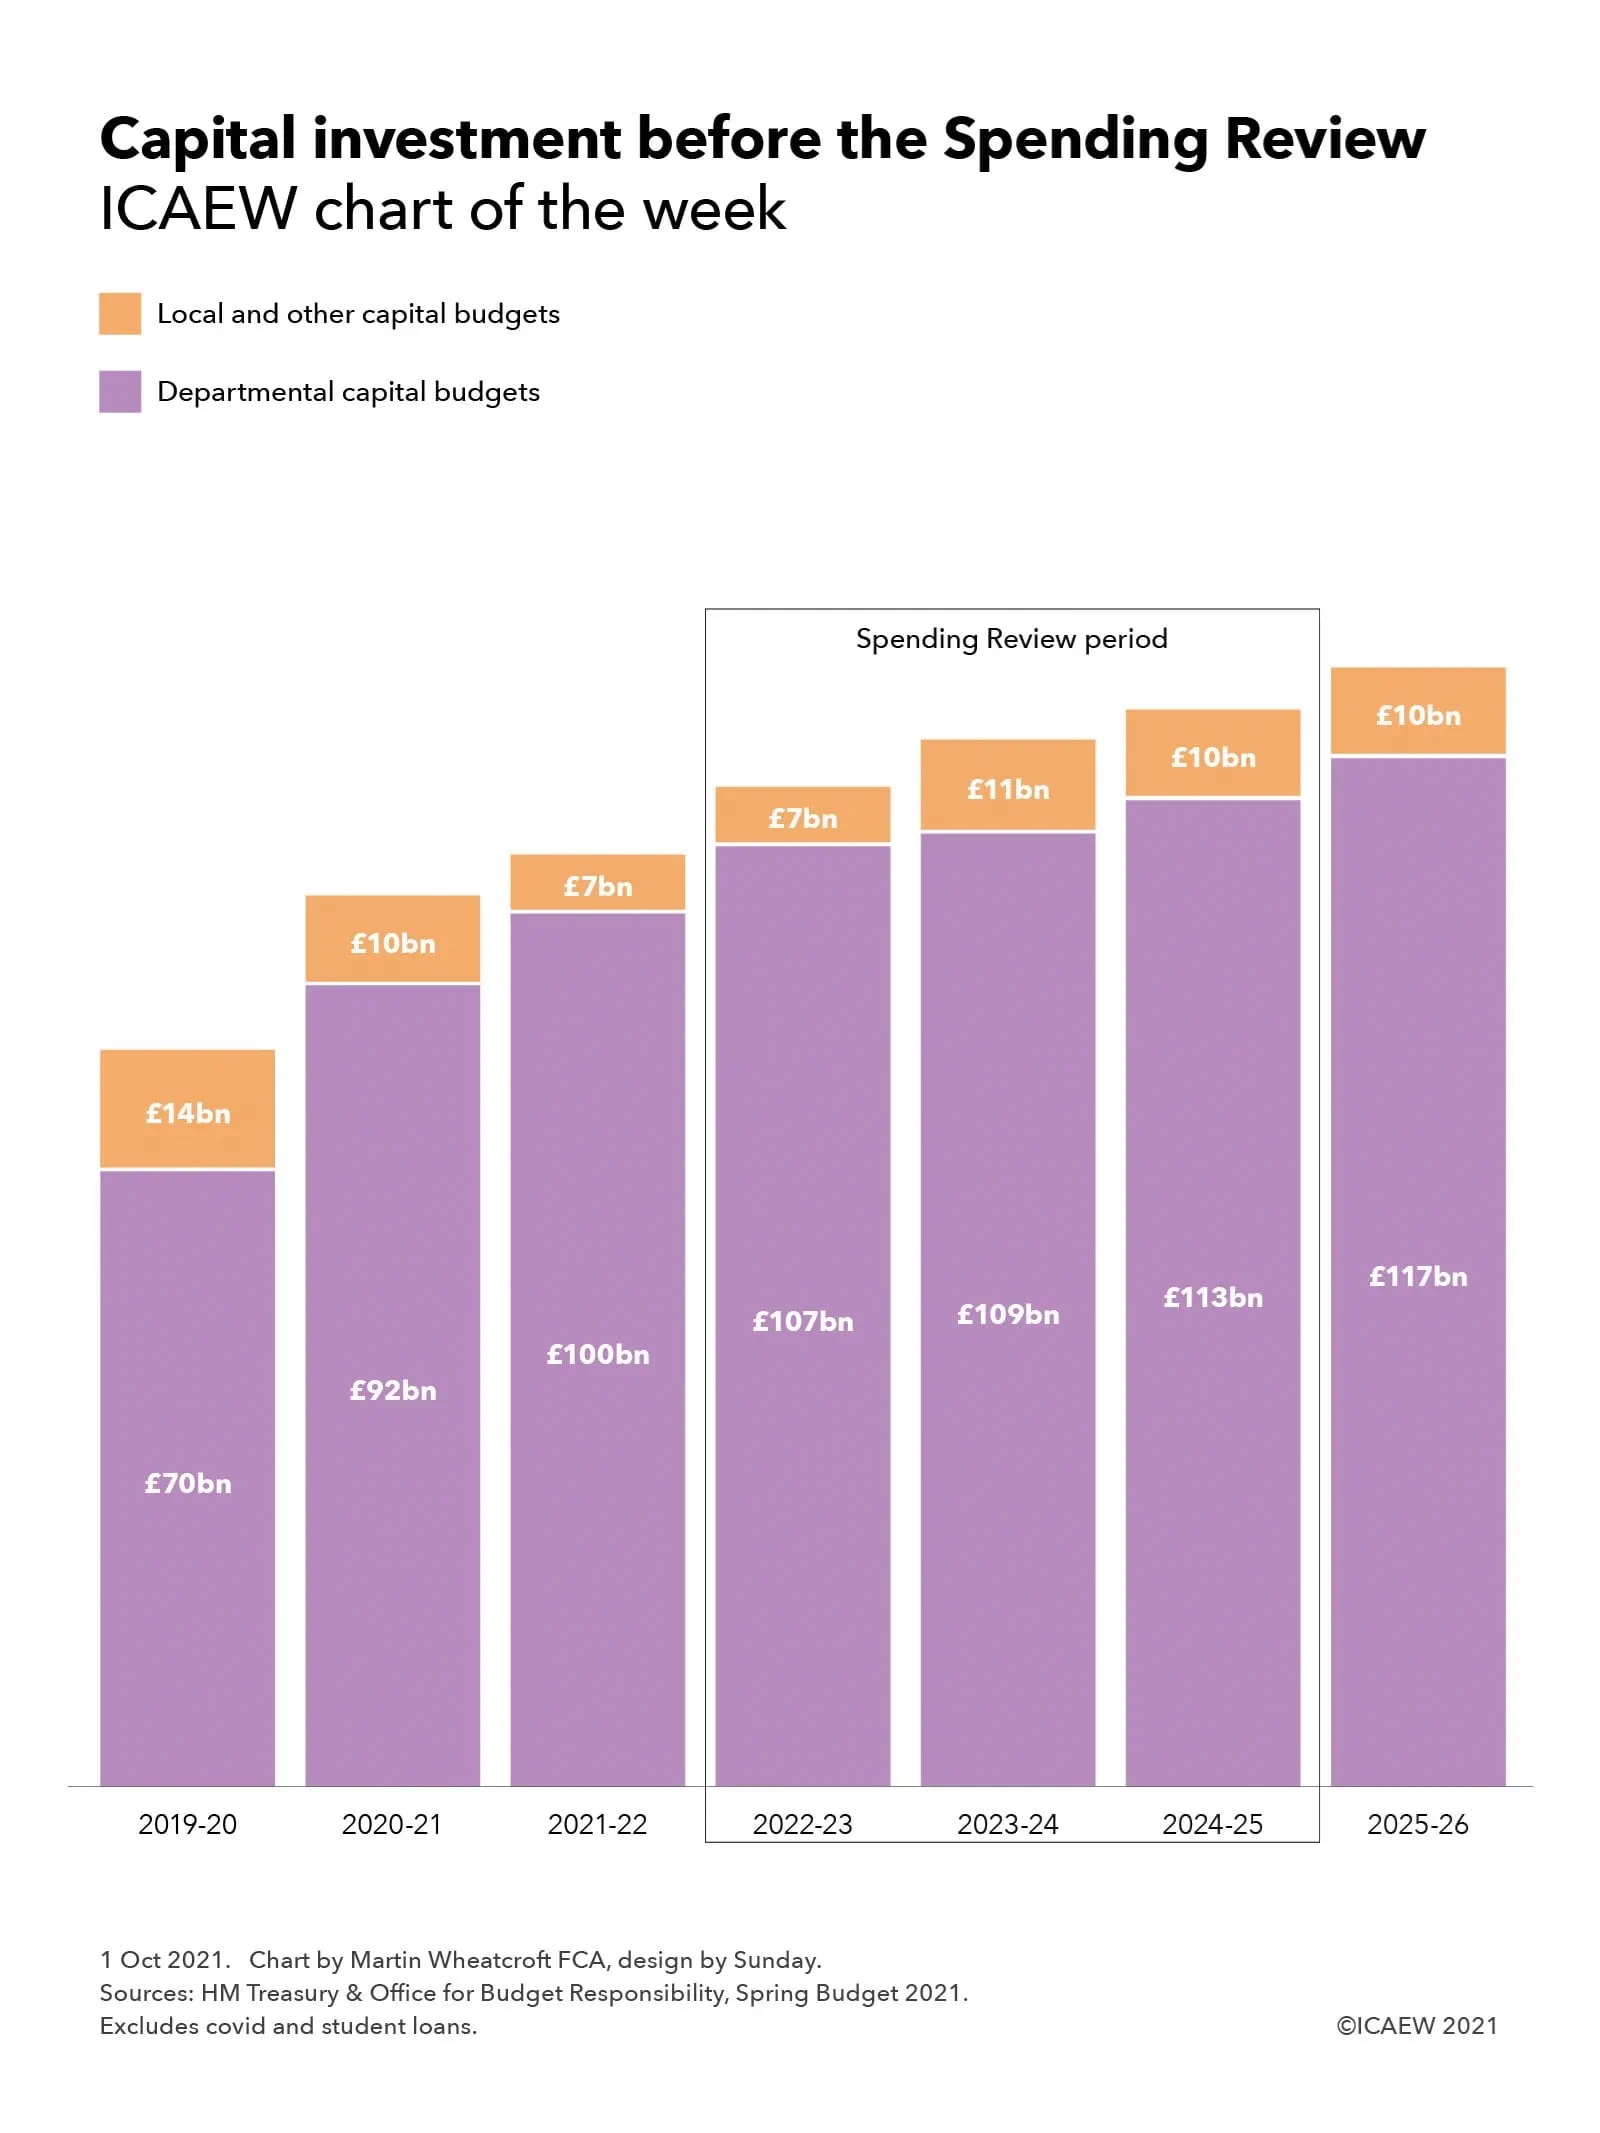
A big credit to the Chancellor is that despite the many challenges facing the public finances following the pandemic he has not scaled back the government’s capital investment programme. While it is the case that his two immediate predecessors pencilled in the substantial increases that we are now seeing, it is the current Chancellor who is delivering on them. There are significant boosts in investment in economic infrastructure, housing, research & development and digitising government amongst other areas.
Open questions remain in areas such as transport, where the long-awaited Integrated Rail Plan was not published with the Spending Review as expected. However, the £7bn pre-announced for regional rail upgrades demonstrates how much can be done with a bigger pot of money for investment.
The step-change in the level in capital budgets – from £70bn in 2019-20 to £107bn in 2022-23 is remarkable. The one concern will be whether the relatively flat capital budget allocations in subsequent years will mean investment starts to fall in real terms again, possibly ‘pulling the plug’ on the economic benefits of investment just as the economy recovers from the pandemic.
New fiscal rules: a cautious approach to repairing the public finances
The Chancellor announced two new fiscal rules: a current budget balance target and a declining debt to GDP ratio; although they were accompanied by subsidiary rules, including a 3% of GDP cap on investment spending and a commitment to return overseas development assistance to 0.7% of GDP once budget balance is achieved.
In effect, they provide a fiscally conservative framework of generating sufficient tax revenues to cover day-to-day spending, while allowing a certain amount of borrowing for investment. While debt should still grow – and is expected to reach over £2.5tn during the forecast period, the debt to GDP ratio should start to fall as the economy grows over time.
These changes confirm that George Osborne’s ambition to eliminate the fiscal deficit completely has been abandoned, replaced by a Gordon Brown-style current budget balance target. This is calculated under the statistics-based National Accounts fiscal framework, which for example excludes the long-term cost of public sector pensions; the government is still planning to continue to lose money on an accounting basis under IFRS.
The forward-looking current-budget balance accompanies the Chancellor’s other principal fiscal rule with is to reduce the ratio of public sector net debt to GDP, although again this uses a target based on fiscal measures that do not include other liabilities in the public sector balance sheet.
Even there, the Chancellor adopted a non-GASP (non-Generally Accepted Statistical Practice) measure to target (public sector net debt excluding the Bank of England) that excludes some central bank liabilities, which rather strangely means that money used to finance premiums paid to private investors for gilts purchased by the Bank of England is excluded from the formal fiscal targets.
Irrespective of the precise KPIs used in the fiscal rules, the overall approach is one of repairing the public finances gradually over time. Higher rates of economic growth would enable that to be accelerated, but the government has as yet been unable to identify how to get back onto the pre-financial crisis levels of productivity improvements that would be required to make this possible. In the meantime, the fiscal rules provide a framework in which tax rises to fund public spending are more likely, in particular to fund increases in the health, social care and the state pension costs driven by more people living longer.
There are many risks to the Chancellor keeping to his fiscal rules over the forecast period, especially as there is relatively little headroom within the current forecasts according to the OBR and the IFS. There are also risks from recessions over a longer period.
A weaker but more transparent public balance sheet
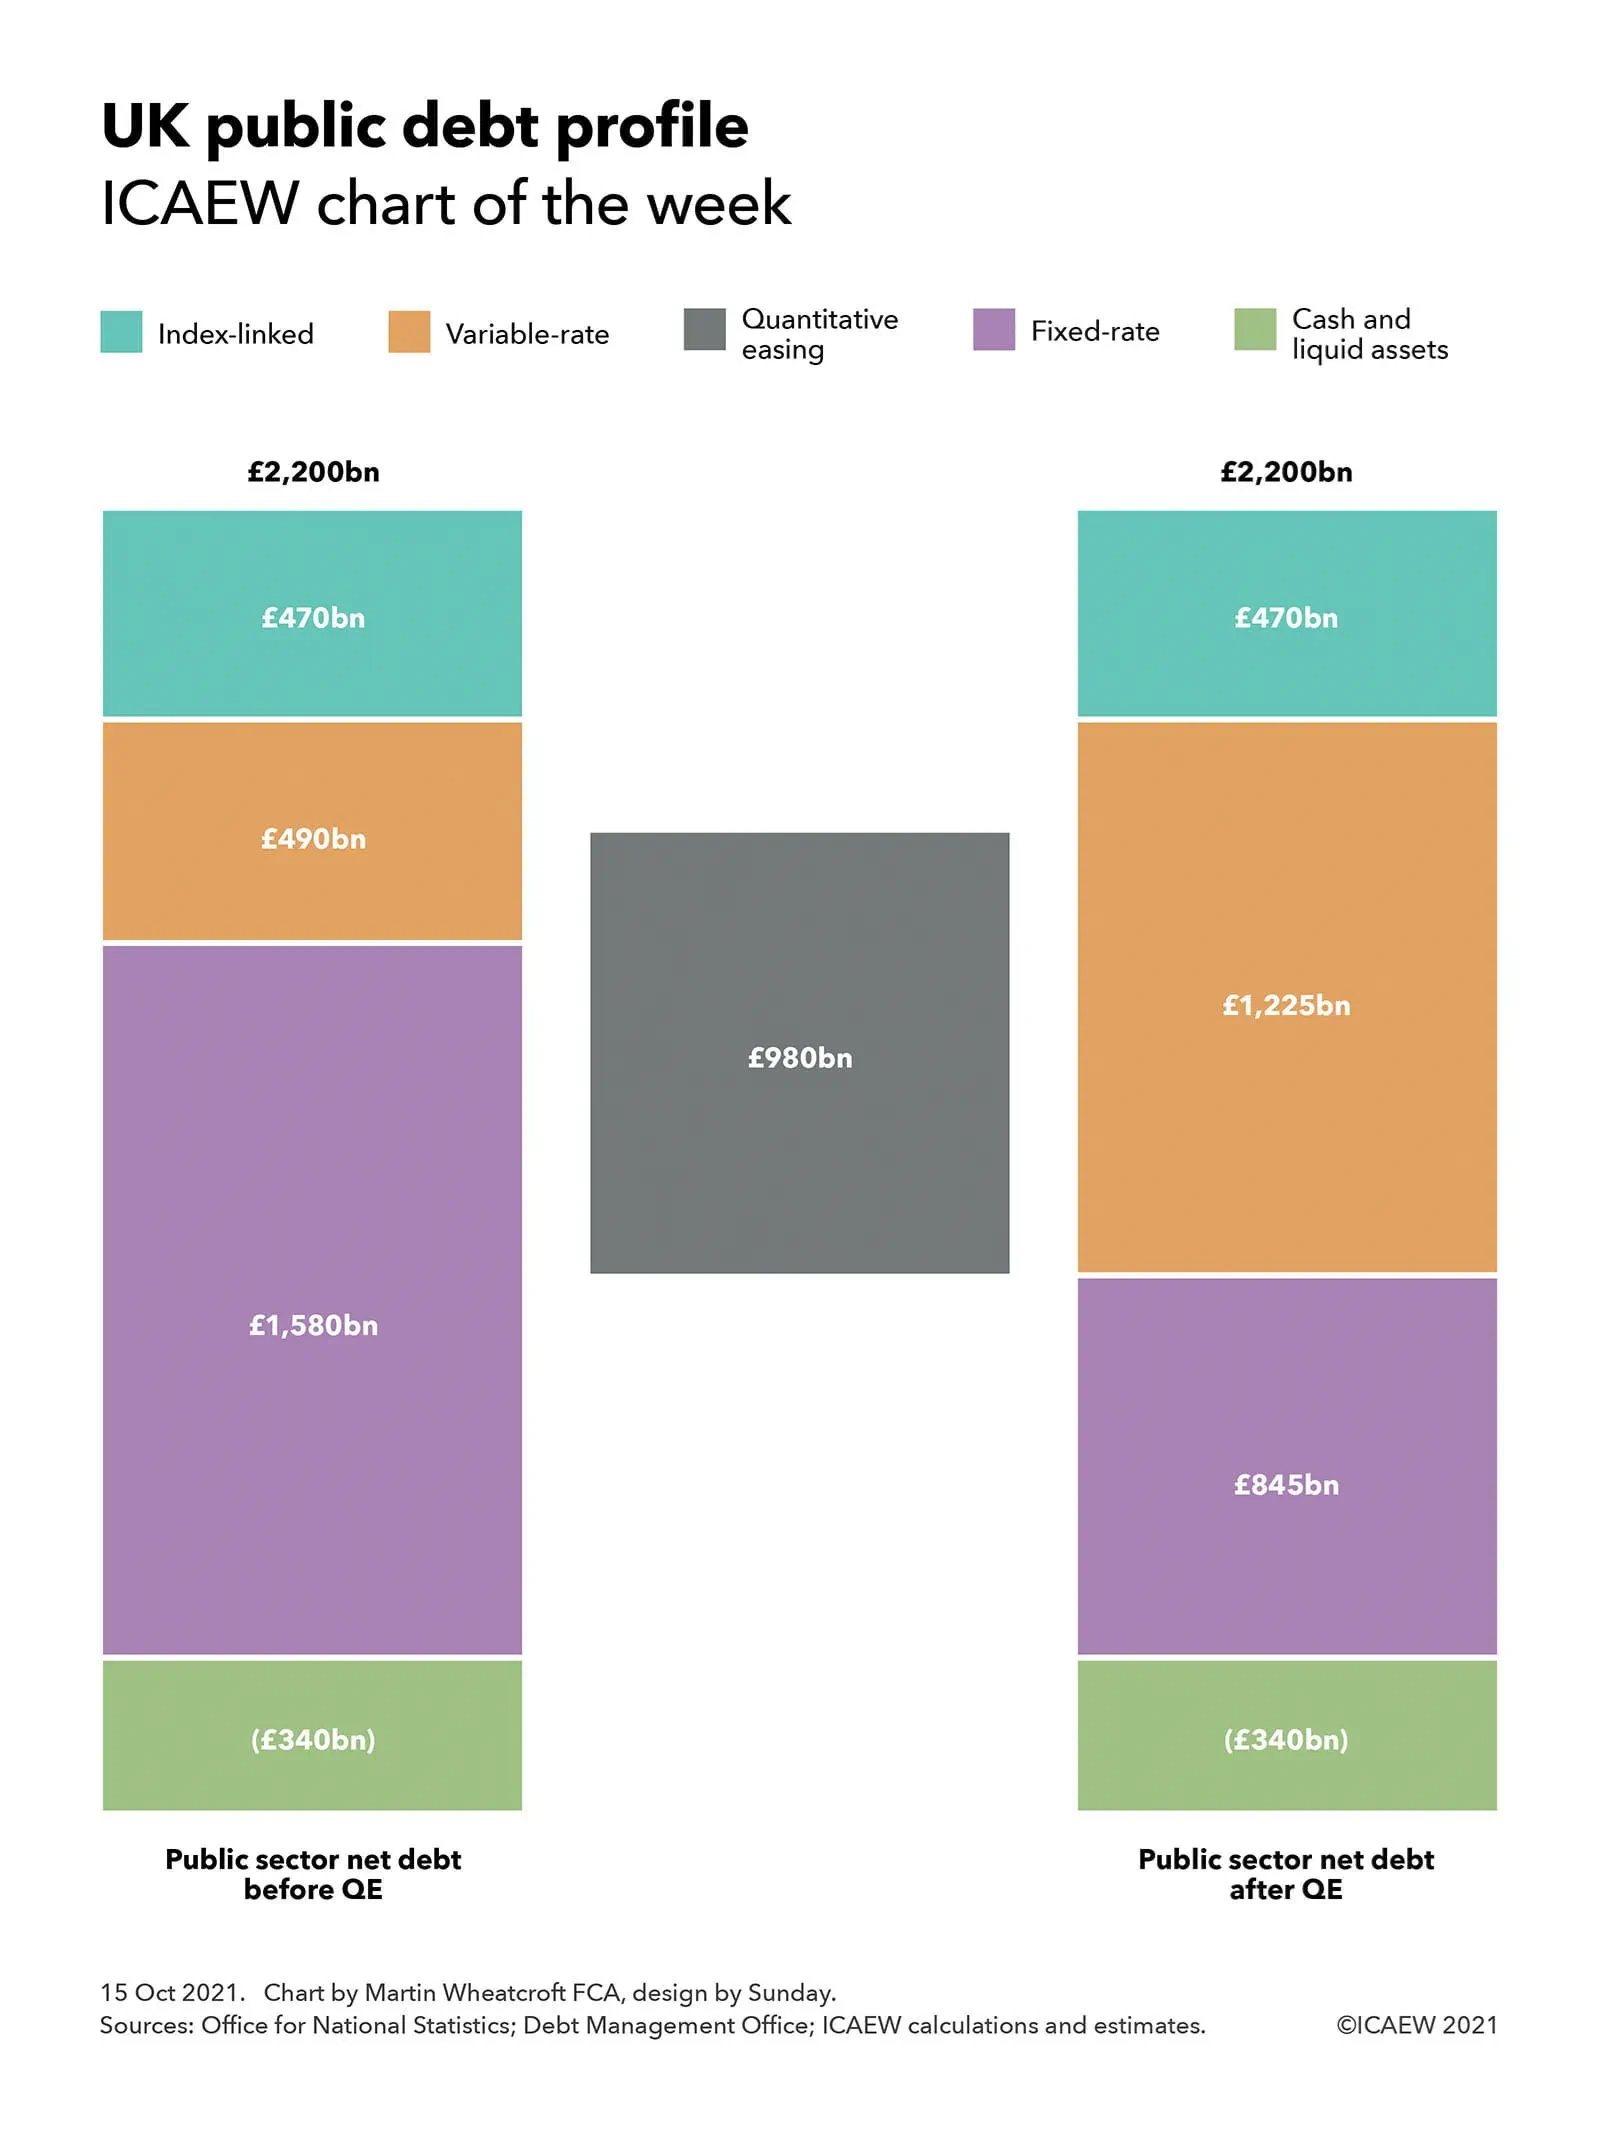
The pandemic has seen the liability side of the public balance sheet rise significantly, with £2.2tn rising to £2.5tn in debt adding to similar amounts of liabilities for public sector pensions and other obligations including nuclear decommissioning and clinical negligence.
Higher gearing in a balance sheet already in negative territory increases the exposure of the public finances to changes in interest rates and inflation, providing a higher risk profile for the public finances. For example, the OBR has estimated that a 1% increase in interest rates would add £25bn to interest costs each year – approaching more than twice the amount raised by the health and social care levy.
One positive aspect of the Autumn Budget and Spending Review announcement was a greater amount of balance sheet analysis, providing improved insights into how the government is managing the public balance sheet and into the risks facing the public finances. This includes much more granular detail on contingent liabilities.
Pre-election tax cuts have been promised, but will they happen?
The Chancellor was very clear in telling his backbenchers and the country that he would like to cut taxes before the next election, demonstrating his and the government’s commitment to lowering taxes.
For many commentators, this seemed a contradictory statement to make at the same time as presenting a fiscal event where the government is in the process of raising taxes to their highest level since the 1950s.
In practice, the Chancellor has some capacity to cut taxes based on the current forecasts and he will be hoping that the post-pandemic recovery is better than anticipated, enabling him to be even more generous.
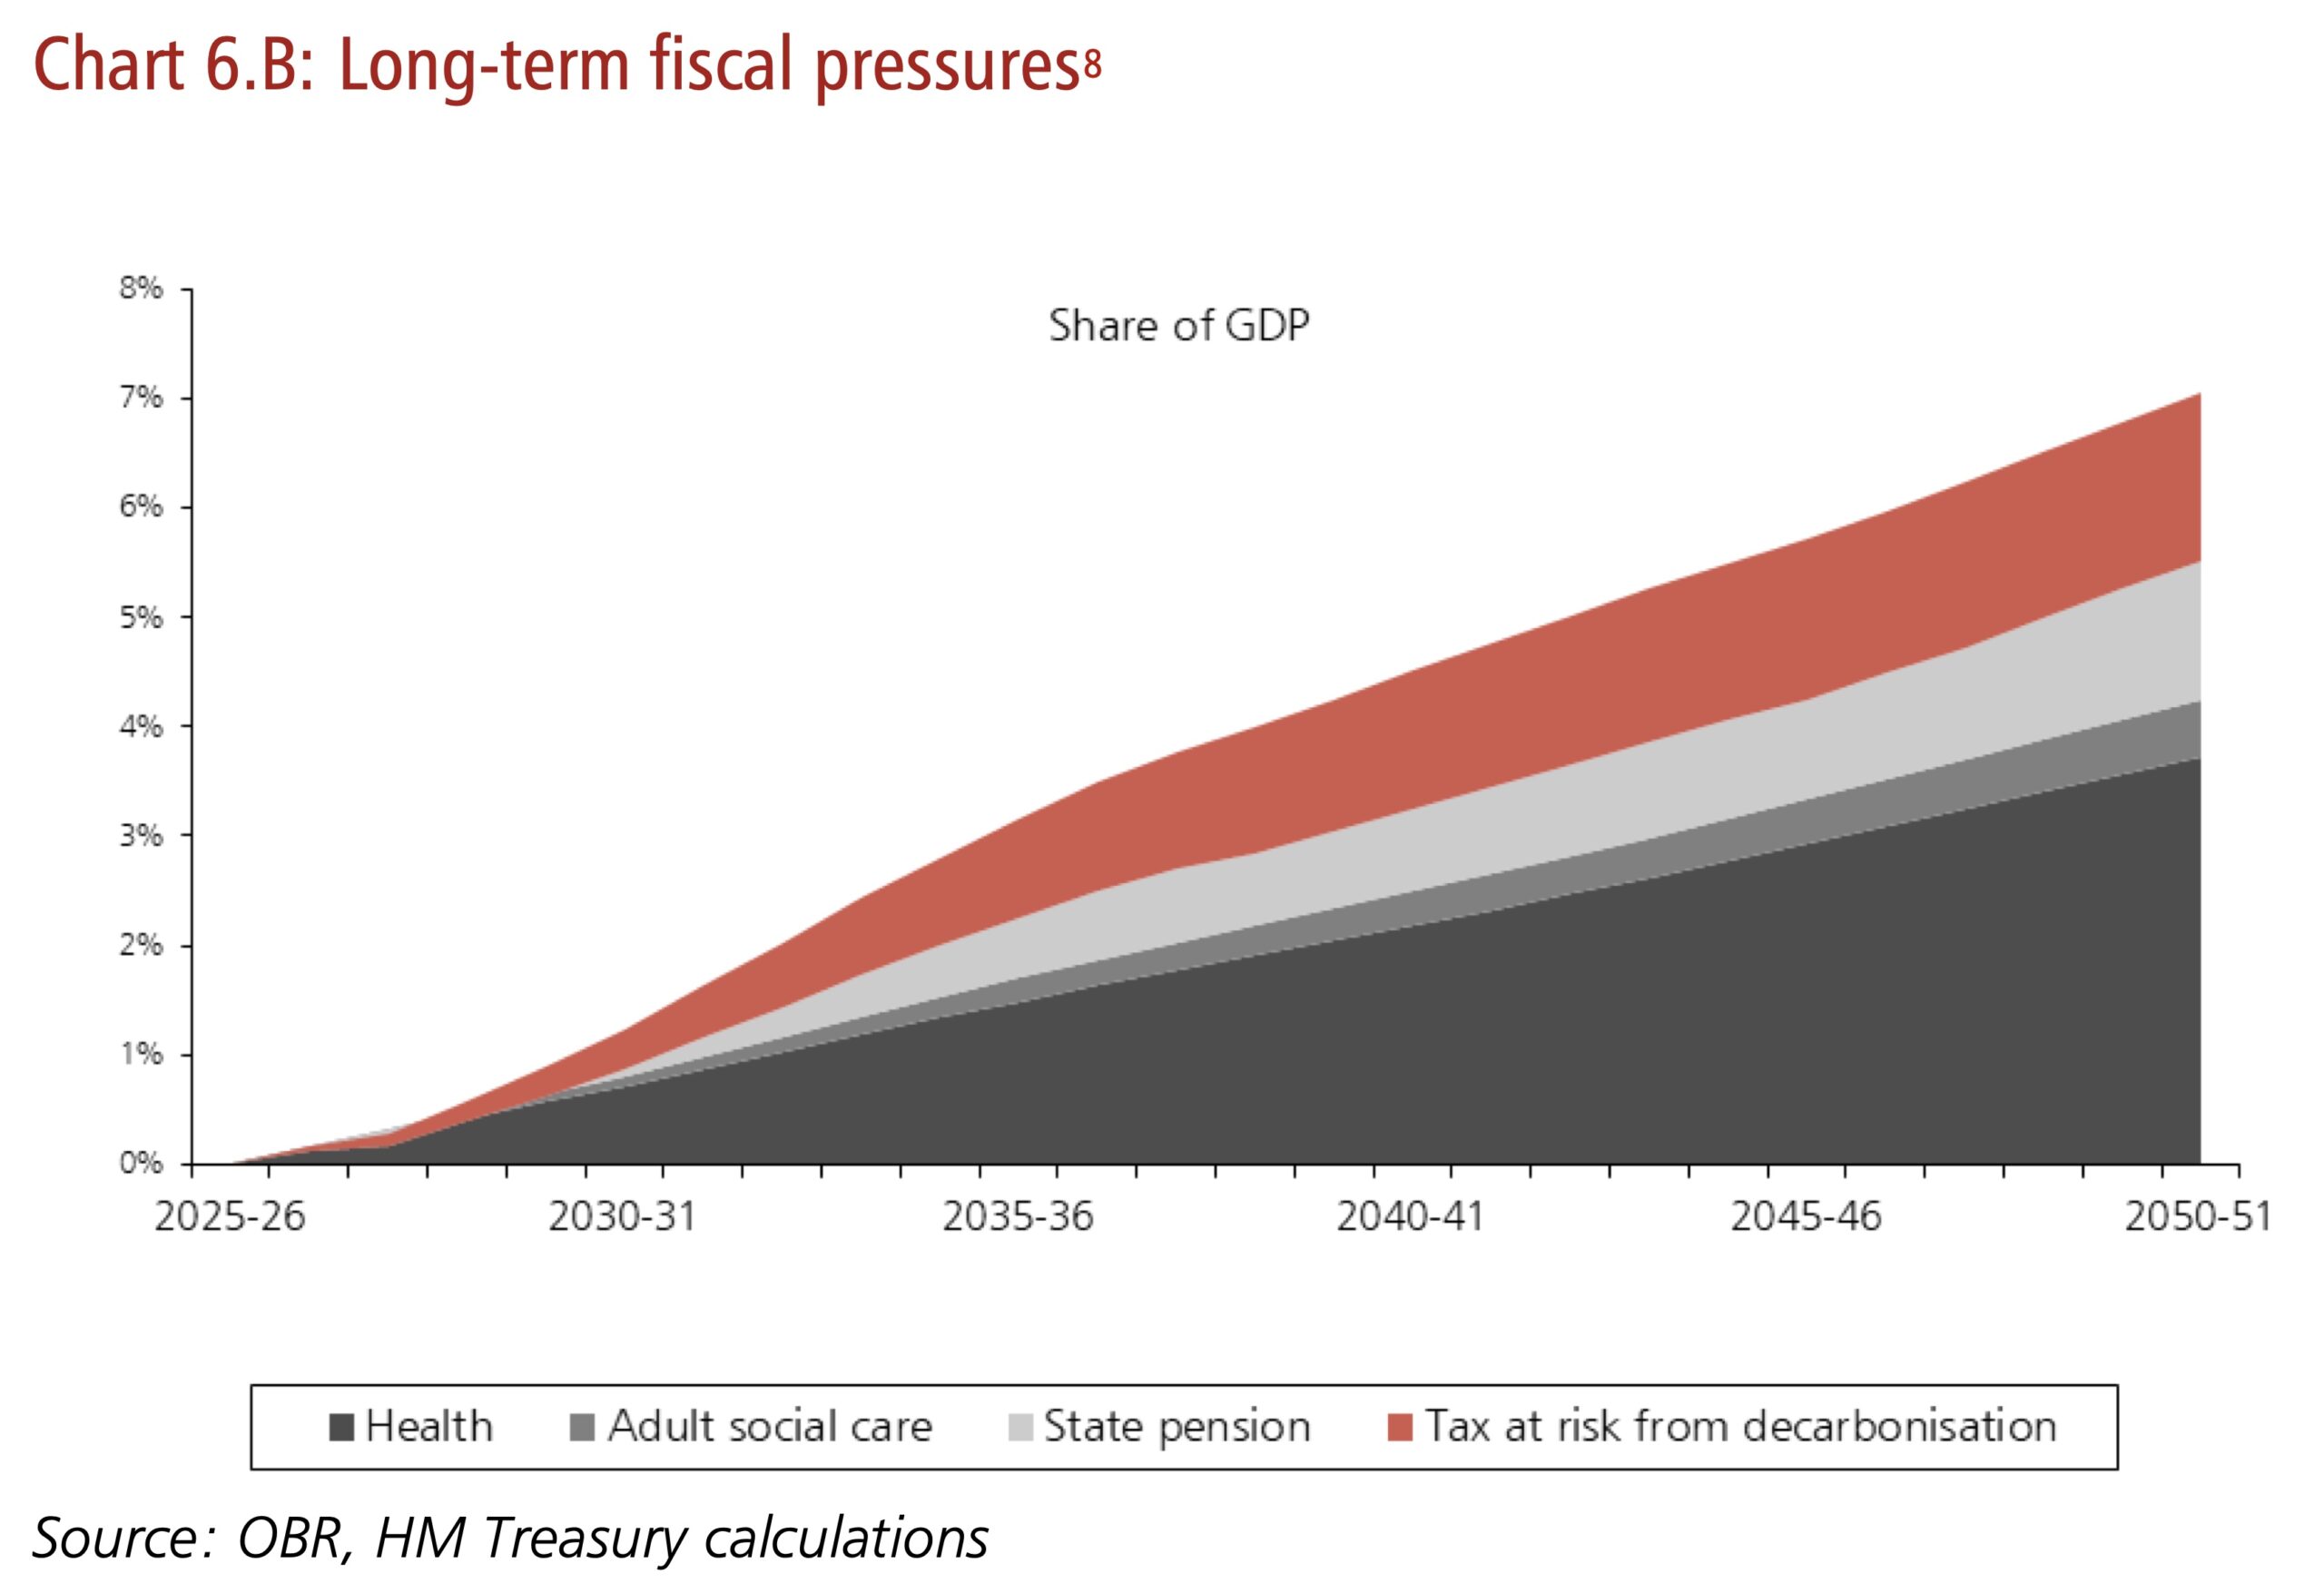
However, as our recent article on the long-term pressures facing the public finances highlighted, the prospects of reversing the entirety of recent tax increases are remote. Long-term fiscal pressures continue to imply higher taxes will be needed absent much stronger economic growth than is anticipated, while there are plenty of economic storm clouds on the horizon including a potential cost-of-living crisis this winter.