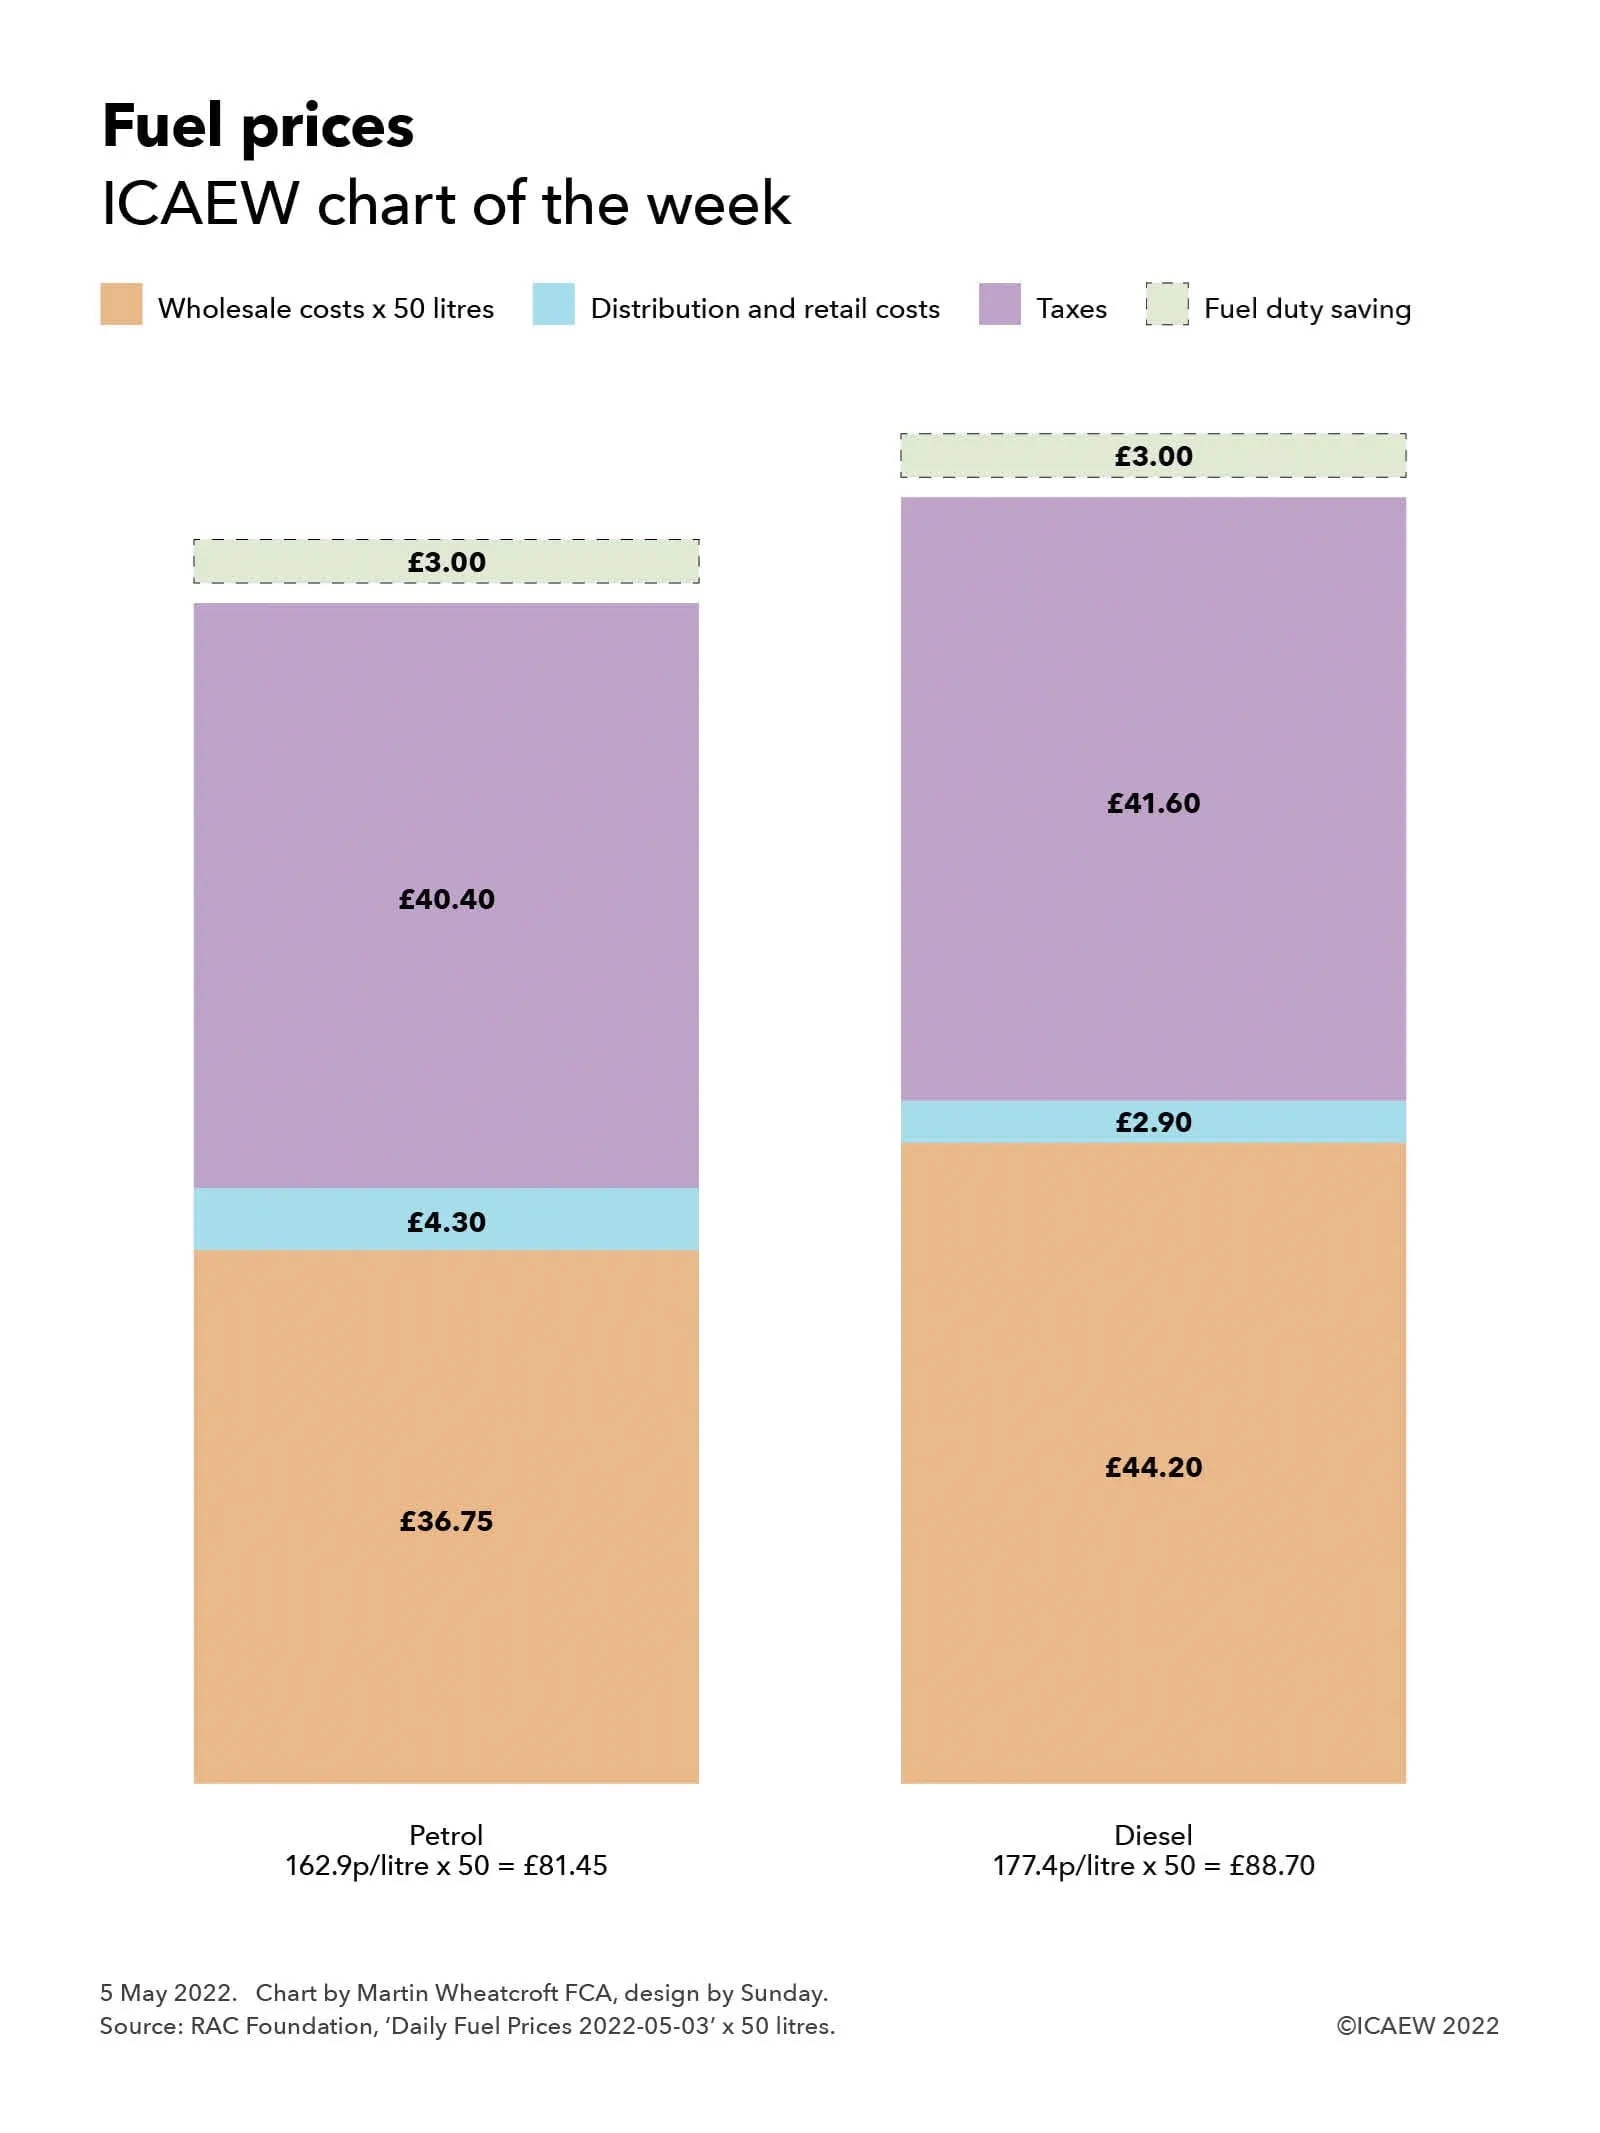
The ICAEW chart of the week looks at how real interest rates – net of inflation – remain stubbornly negative despite recent increases in the Bank of England base rate.
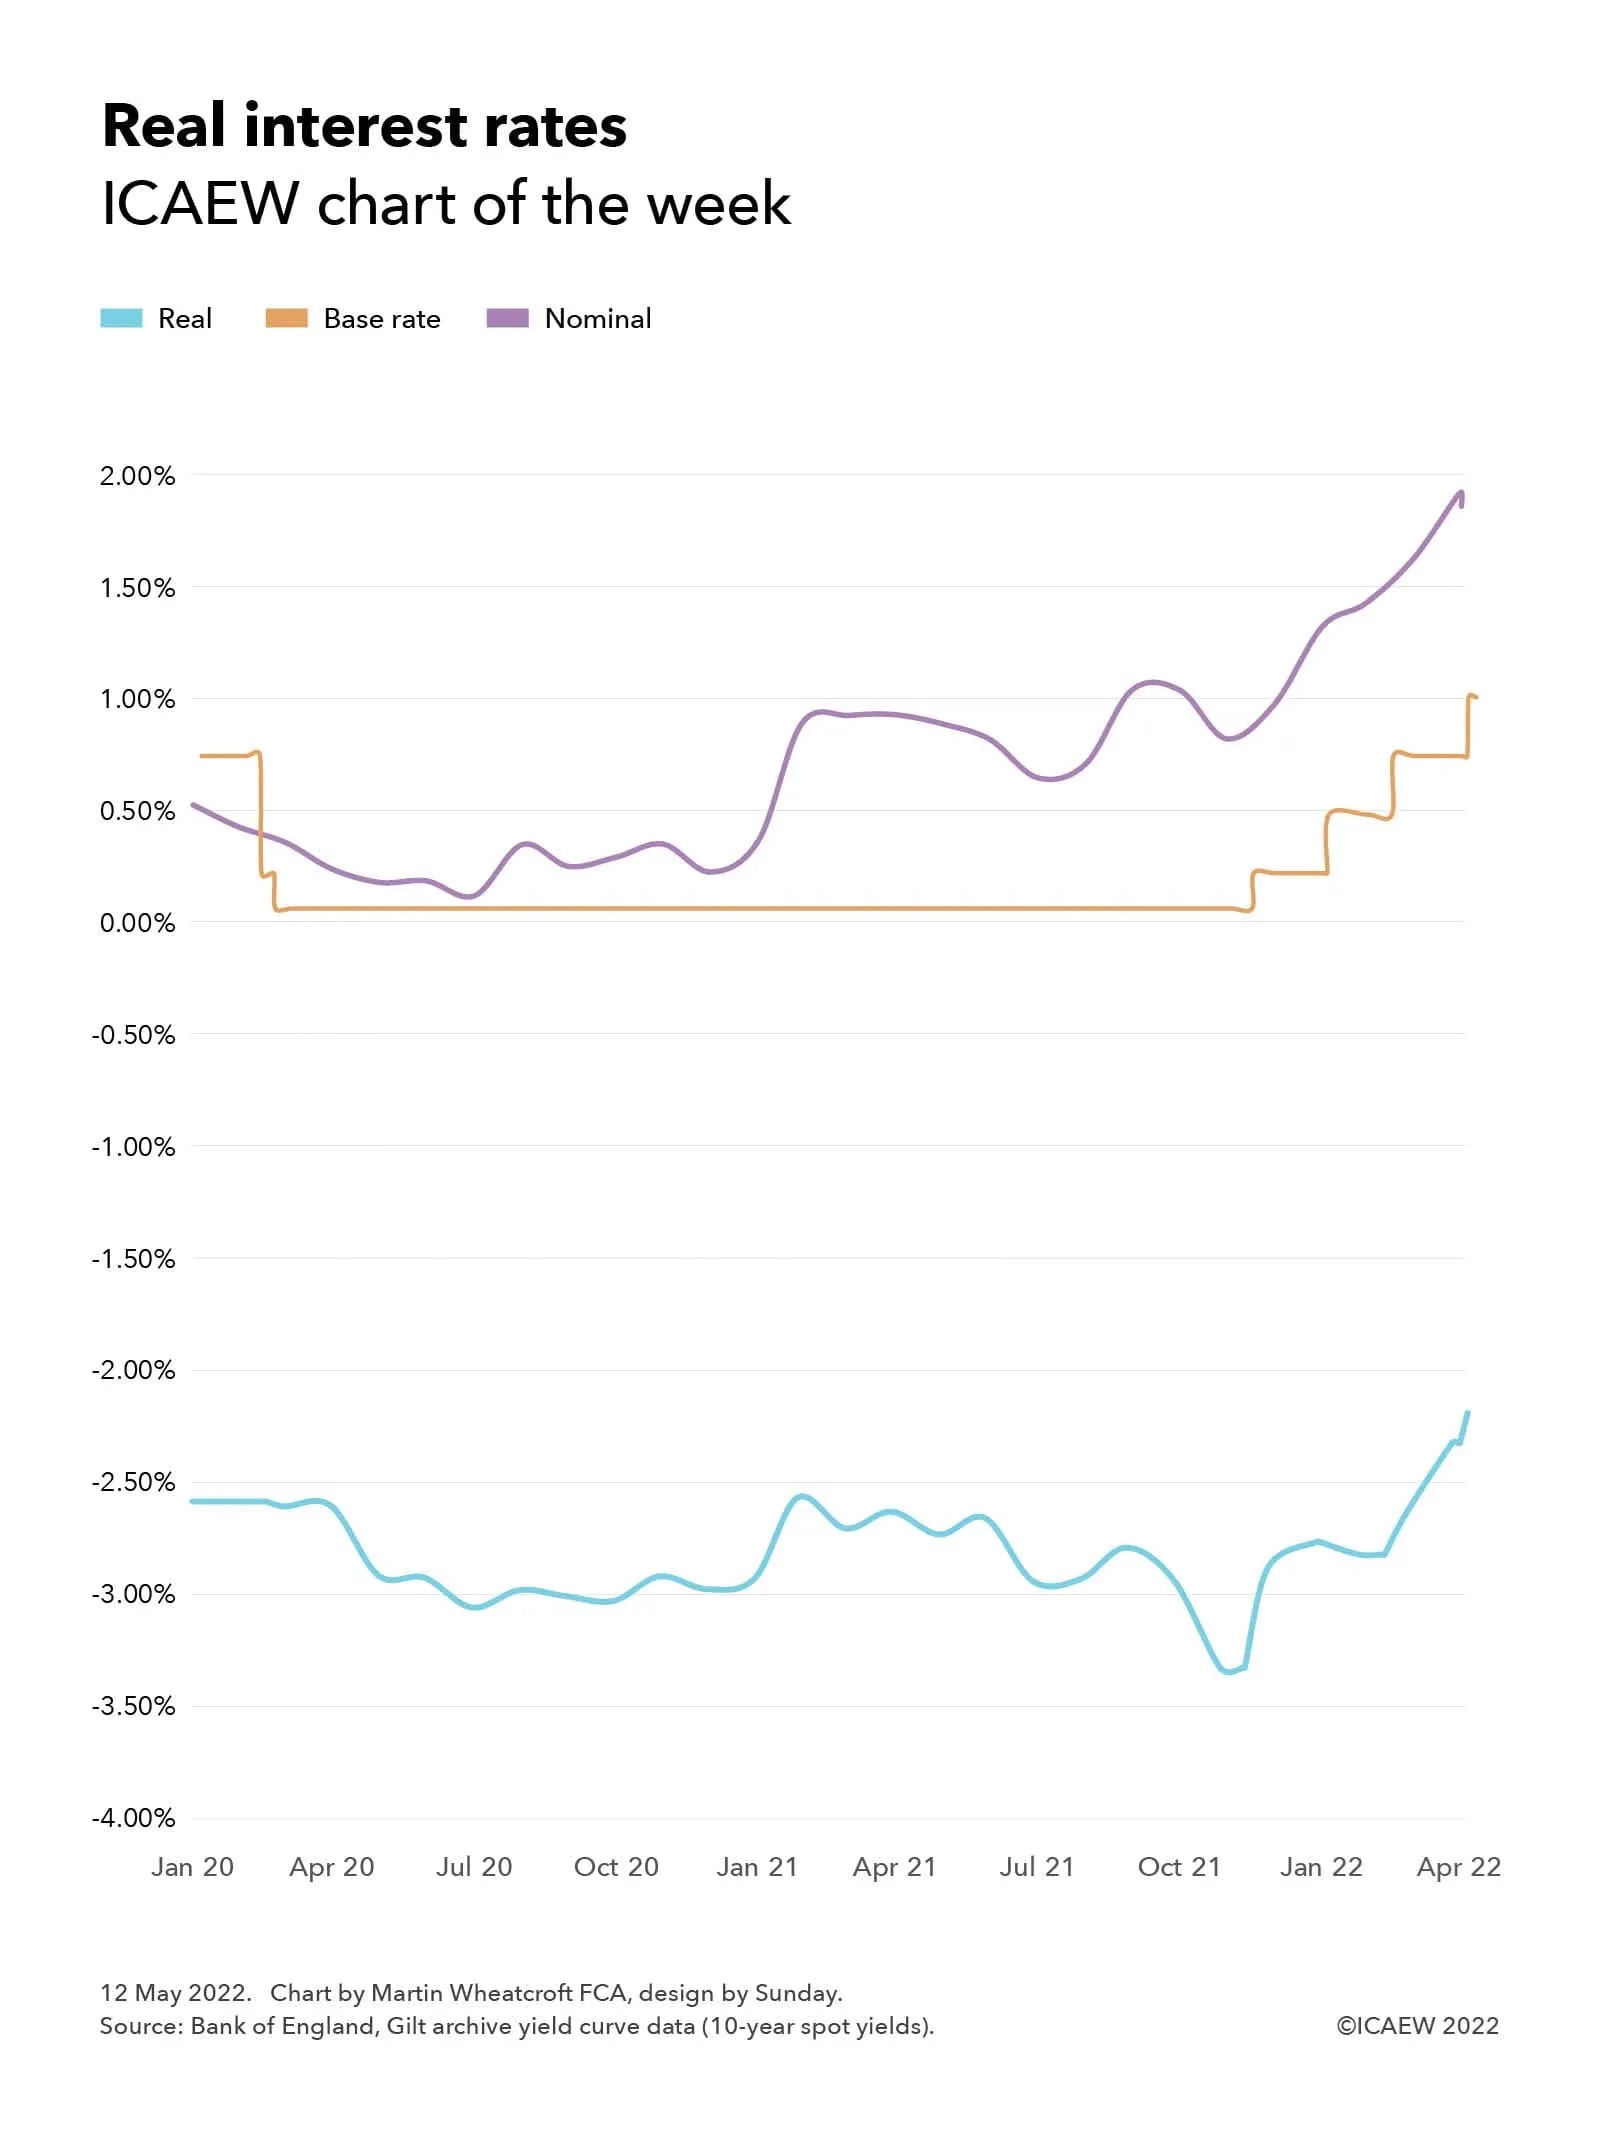
A feature of the economy since the financial crisis has been negative real interest rates, with the Bank of England reporting a -2.33% implied spot yield on 10-year government gilts as of 30 April 2022. This compares with a base rate of 0.75% on that day (since raised to 1%) and a nominal yield of +1.9%. With further increases in interest rates likely as the Bank of England seeks to bring inflation under control it is possible that real interest rates will become less negative over the next few months, at least assuming inflation peaks and doesn’t accelerate out of control.
Negative real interest rates are generally considered to be stimulative to the economy, reflecting the monetary policy support that the Bank of England has been providing since the financial crisis almost a decade and a half ago. Economic theory suggests that this should encourage spending and investment, as the nominal interest earned on savings will not be sufficient to offset the erosion in the value of money as prices rise over time.
The chart highlights how real interest rates were -2.59% in January 2020, before falling to almost -3.08% in June 2020 and bouncing around between -2.50% and -3.00% until November 2021 when they fell to -3.33%. They have since increased to -2.33% in April and to -2.20% as of 10 May 2022. Over that same period, nominal interest rates similarly based on government bond yields have fallen from 0.53% in January 2020 to 0.13% in July 2020 before increasing to between 0.3% and 0.4% until January 2021 after which they bounced between 0.8% and 1.0% until December 2021 since when rates have gradually increased to 1.92% on 30 April 2022, falling slightly to 1.86% on 10 May 2022. During this time, the Bank of England base rate was reduced from 0.75% in January 2020, to 0.25% and then 0.10% in March 2020 where it stayed until increasing to 0.25% in December 2021, to 0.50% in February 2022 to 0.75% in March 2022 and to 1.00% in May 2022.
The yields used in the chart are only one way of measuring real and nominal interest rates, and it is important to note that the former depend on the inflation expectations of market participants at particular points in time, which are not the same as the actual rates of inflation that are or will be experienced.
The challenge for the Bank of England over the next few months in tackling the current surge in inflation is how to take away the economic stimulus theoretically provided by negative real interest rates without causing a collapse in asset prices and a potential recession. A series of tough calls for even the most hardened policy makers.